Explore Our Diverse Range Of Offerings
From detailed reports to experts services offered in 15+ Industry Domains
Report
Press Release
Blogs
Industry Statistics
Add 2 More Reports For 20% off

Europe Wires and Cables Market Report Overview

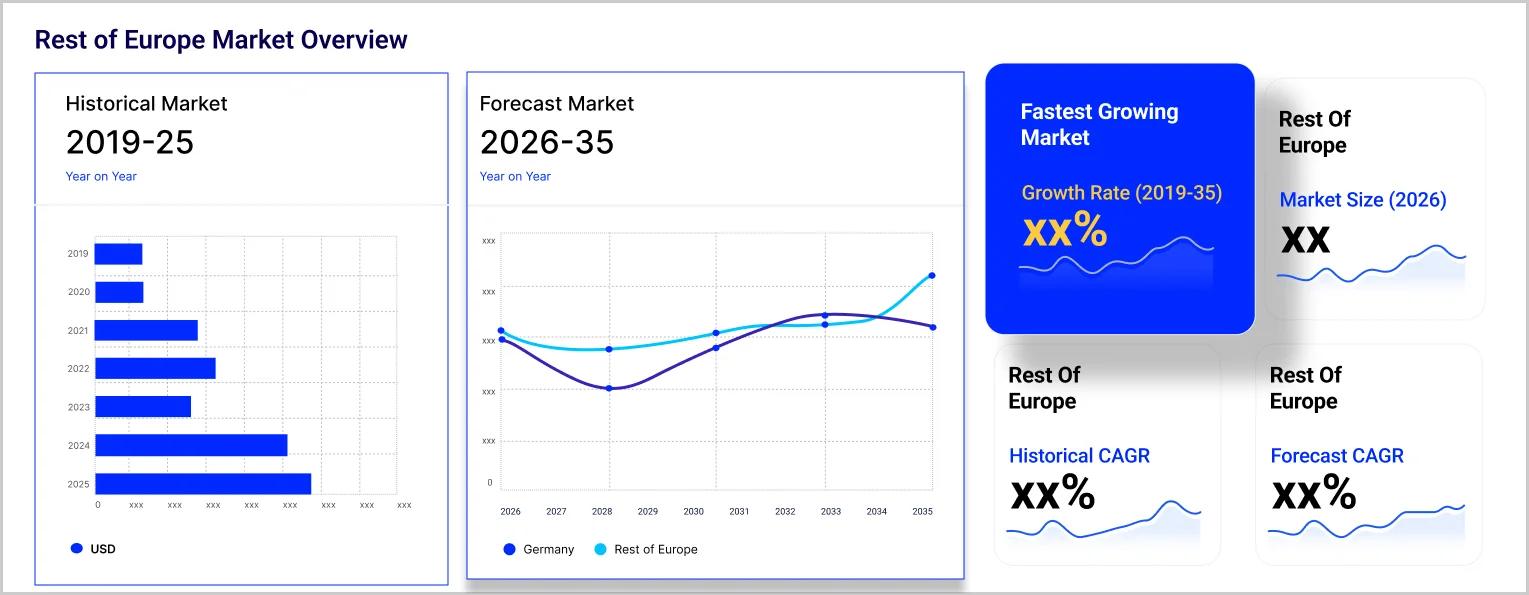
The Europe wires and cables market size reached approximately USD 50.98 Billion in 2025. The market is projected to grow at a CAGR of 3.20% between 2026 and 2035, reaching a value of around USD 69.85 Billion by 2035.

Q1 2026 Market Updates

Geopolitical Impact of Iran, US, and Israel War on the Europe Wires and Cables Market

United States: The Europe Wires and Cables Market, a key segment of the global economy, is experiencing a complex operating environment in Q1 2026 as a direct consequence of the US-Israel-Iran war. Europe faces elevated risks of recession and stagflation. The ECB warns a prolonged conflict will trigger a period of low growth and inflation. Chemical and steel manufacturers have imposed surcharges of up to 30%. European steel manufacturers are imposing surcharges of up to 30% on buyers to offset surging electricity and feedstock costs from LNG supply disruptions. Germany, the Netherlands, the United Kingdom and Italy face the highest recession risk. The Ifo Institute flags Germany and the Netherlands at high risk. UK inflation is projected to breach 5% in 2026. The ECB faces a stagflation dilemma, with rate increases to fight inflation risking a deeper economic contraction across major European markets.

Iran: Iran's domestic Europe Wires and Cables sector has been effectively suspended by the conflict. US-Israeli strikes on industrial and civilian infrastructure across Tehran, Mashhad, Isfahan, and other major cities have disrupted all commercial activity. Power outages from attacks on electricity generation facilities have halted manufacturing operations, and the collapse of the commercial banking and logistics system has eliminated any residual trade flows. The broader humanitarian crisis, with over 1,900 casualties and 4,000+ civilian buildings damaged, has redirected the entire Iranian economy toward survival rather than production or consumption.

Israel: Israel's Europe Wires and Cables sector is experiencing near-term disruption from wartime conditions. Consumer spending on non-essential categories has declined as millions of Israelis regularly shelter from missile and drone alerts. Supply chain logistics are disrupted by regional airspace closures, elevated war-risk insurance premiums, and the suspension of major carrier services through the region. International business partnerships with Israeli companies have been temporarily suspended. Post-conflict reconstruction and recovery demand is expected to provide meaningful demand acceleration across affected market segments once operational conditions normalise.

Key Takeaways

Government

  • European consumer protection agencies should monitor retail pricing for evidence of disproportionate margin-taking on top of genuine supply cost increases, ensuring that conflict-related cost inflation is not being amplified by opportunistic pricing behaviour.
  • Governments should consider targeted consumer support measures for lower-income households most exposed to rising fuel and food costs, preventing conflict-driven inflation from creating acute hardship among economically vulnerable populations.
  • Trade authorities should work with the europe wires and cables industry to identify import diversification opportunities that reduce dependence on Gulf-disrupted supply chains, stabilising product availability and moderating consumer price inflation.

Market

  • U.S. consumer inflation projected at 4.2% for 2026, gasoline above USD 4 per gallon, and global food price increases from fertilizer and logistics inflation are creating the most challenging consumer spending environment since 2022.
  • Premium and essential categories within the europe wires and cables market show different demand trajectories: premium segments serving ultra-high-net-worth consumers remain resilient, while mass-market discretionary segments face meaningful softening.
  • Supply chain cost increases from 30% higher freight, 15-20% packaging inflation, and rising input material costs are compressing retailer and brand margins, creating pressure for pricing adjustments that may further moderate volume demand.

Procurement

  • Consumer goods procurement teams should review packaging material sourcing, building 60-90 day buffer inventory of petroleum-derived packaging materials before further feedstock cost increases from the Gulf supply shock are transmitted into manufacturing costs.
  • Logistics procurement managers should lock in freight contracts at current rates before further diesel cost increases are passed through by carriers, and evaluate route optimisation strategies that reduce fuel cost exposure.
  • Retail and brand buyers should update 2026 cost models to incorporate 30% higher freight costs, 15-20% packaging material inflation, and rising input material prices, ensuring that margin targets and pricing strategies reflect the new cost environment.
2025

Base Year

2019-2025

Historical Period

2026-2035

Forecast Period

  • In 2022, about 2 million electric car registrations were carried out, an increase from 1,74 million in 2021.

  • Europe is connected to North America through 17 cables. A major number of trans-Atlantic cables land in the U.K. and France, along with Denmark, Norway, Ireland, and Spain.

  • In 2022, the European construction sector witnessed a growth of 3%.

Compound Annual Growth Rate

3.2%

Value in USD Billion

2026-2035


*this image is indicative*

Cable manufacturers in Europe are recognised worldwide technology leaders. Manufacturers are increasingly developing wires and cables in line with the sustainability needs to accelerate the grid build-up and secure European manufacturing capability for a sustainable energy transition for the region.  The EU has set interconnectivity targets, which were upgraded to 15% for 2030. This implies that a nation must have sufficient installed cable capacity to export about 15% of the electricity produced by the country’s power plants to its neighbours. Such initiatives are significantly aiding the Europe wires and cables market growth.

The telecommunication sector is considered a strategic sector and a key asset to the European economy. In 2022, the European telecom sector witnessed a total investment of EUR 59.1 billion . The telecom sector in Europe is constructing the infrastructures for digital and green transformation while speeding up the technological adoption with 5G, edge computing, cloud, Artificial Intelligence, IoT, and cybersecurity, among others.

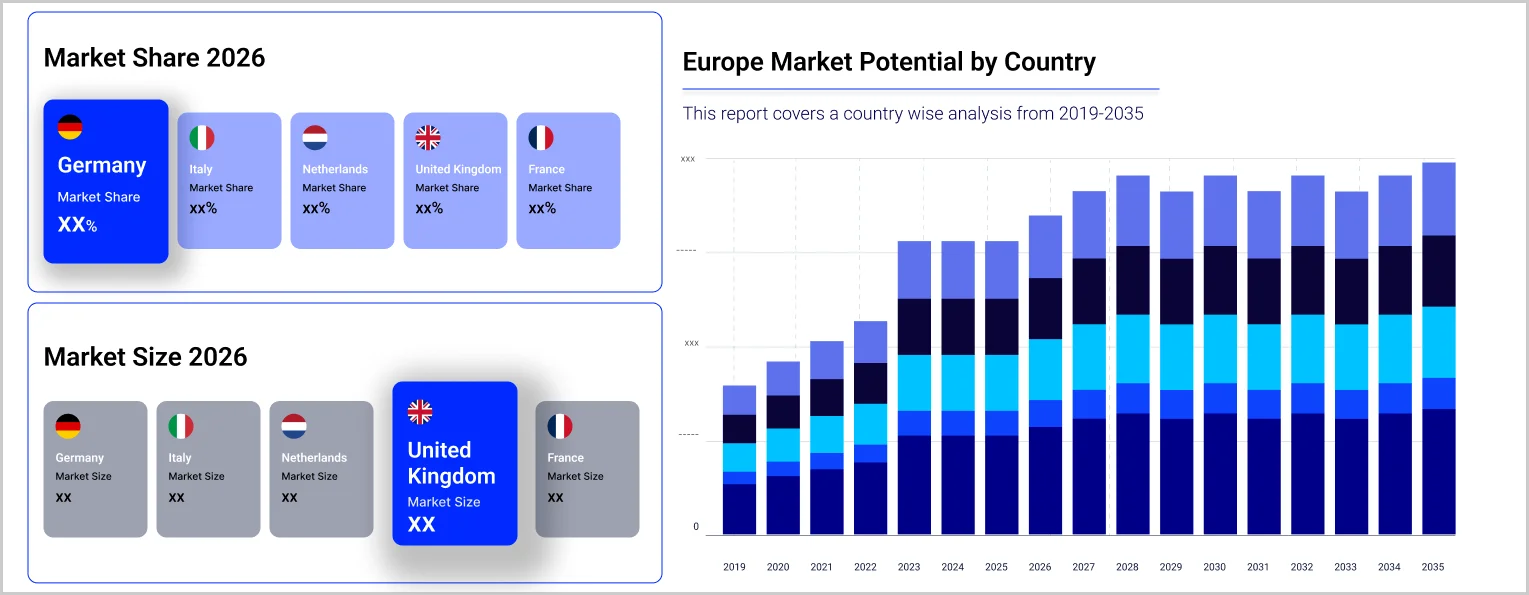
Germany is a key player in the European wires and cables market. The presence of renewable energy goals and government support for the transition towards EVs are increasing the demand for wires and cables for power transmission and automotive applications. Moreover, the ongoing Industry 4.0 practices are further necessitating the use of high-tech cables for supporting manufacturing digitisation.

Market Segmentation

"Europe Wires and Cables Market Report and Forecast 2026-2035" offers a detailed analysis of the market based on the following segments:

Market Breakup by Voltage

  • Low Voltage
  • Medium Voltage
  • High Voltage

Market Breakup by Product

  • Power Cables
  • Building Wires
  • Flexible Wires and Cables
  • EHV Cables
  • Control/Instrumentation Cables
  • Others

Market Breakup by Material

  • Copper
  • Aluminium
  • Others

Market Breakup by End Use

  • Construction
    • Residential
    • Commercial
  • Telecommunications
  • Energy and Power
  • Automotive
  • Aerospace and Defence
  • Others

Market Breakup by Country

  • Germany
  • United Kingdom
  • France
  • Italy
  • Others

Competitive Landscape

Manufacturers are increasingly focusing on offering improved products to consumers using advanced materials.

  • Nexans S.A.
  • Prysmian S.p.A.
  • Furukawa Electric Co. Ltd.
  • Leoni AG
  • KEI Industries Limited
  • Cable Harnesses UK Ltd.
  • Sumitomo Electric Industries, Ltd.
  • Heatsense Cables Limited
  • Tratos Cavi S.p.A
  • Cleveland Cable Company
  • Others

*While we strive to always give you current and accurate information, the numbers depicted on the website are indicative and may differ from the actual numbers in the main report. At Expert Market Research, we aim to bring you the latest insights and trends in the market. Using our analyses and forecasts, stakeholders can understand the market dynamics, navigate challenges, and capitalize on opportunities to make data-driven strategic decisions.*

Looking for specific insights?

Get in touch with us for a customized solution tailored to your unique requirements and save upto 35%!

Key Questions Answered in the Report

The market reached a value of approximately USD 50.98 Billion in 2025.

The market is estimated to grow at a CAGR of 3.20% between 2026 and 2035.

The market is estimated to witness a healthy growth during 2026-2035 to reach around USD 69.85 Billion by 2035.

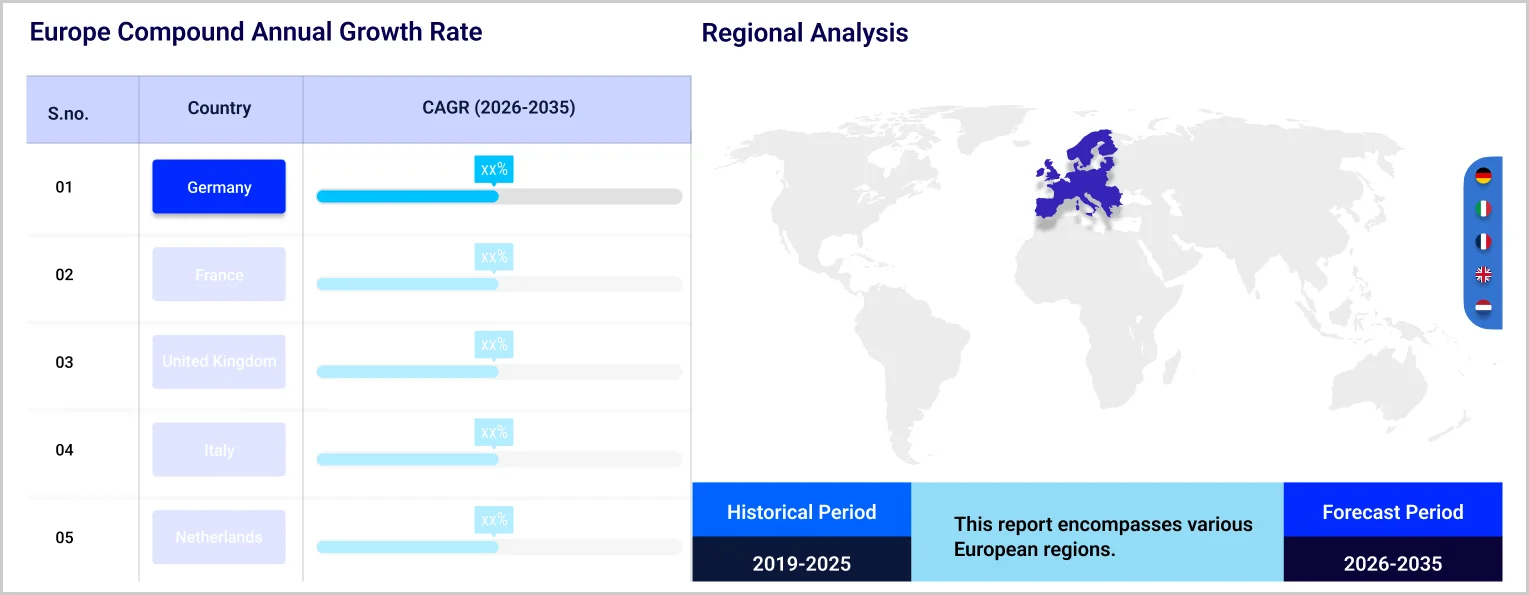
Germany, the United Kingdom, France, and Italy are the major countries explored in the market report.

The key materials are copper, aluminium, and others.

Low voltage, medium voltage, and high voltage are the three types of voltages for wires and cables.

The products include power cables, building wires, flexible wires, and cables, EHV cables, control/instrumentation cables, and others.

The major players in the market are Nexans S.A., Prysmian S.p.A, Furukawa Electric Co. Ltd., Leoni AG, KEI Industries Limited, Cable Harnesses UK Ltd., Sumitomo Electric Industries, Ltd., Heatsense Cables Limited, Tratos Cavi S.p.A, and Cleveland Cable Company, among others.

Report Summary

Explore our key highlights of the report and gain a concise overview of key findings, trends, and actionable insights that will empower your strategic decisions.

Key Highlights of the Report

Please note that the figures mentioned in the description serve as estimates and may vary from the actual figures presented in the final report.

REPORT FEATURES DETAILS
Base Year 2025
Historical Period 2019-2025
Forecast Period 2026-2035
Scope of the Report

Historical and Forecast Trends, Industry Drivers and Constraints, Historical and Forecast Market Analysis by Segment:

  • Voltage
  • Product
  • Material
  • End Use
  • Region
Breakup by Voltage
  • Low Voltage
  • Medium Voltage
  • High Voltage
Breakup by Product
  • Power Cables
  • Building Wires
  • Flexible Wires and Cables
  • EHV Cables
  • Control/Instrumentation Cables
  • Others
Breakup by Material
  • Copper
  • Aluminium
  • Others
Breakup by End Use
  • Construction
  • Telecommunications
  • Energy and Power
  • Automotive
  • Aerospace and Defence
  • Others
Breakup by Region
  • Germany
  • United Kingdom
  • France
  • Italy
  • Others
Market Dynamics
  • SWOT Analysis
  • Porter's Five Forces Analysis
  • Key Indicators for Demand
  • Key Indicators for Price
Competitive Landscape
  • Market Structure
  • Company Profiles
    • Company Overview
    • Product Portfolio
    • Demographic Reach and Achievements
    • Certifications
Companies Covered
  • Nexans S.A.
  • Prysmian S.p.A.
  • Furukawa Electric Co. Ltd.
  • Leoni AG
  • KEI Industries Limited
  • Cable Harnesses UK Ltd.
  • Sumitomo Electric Industries, Ltd.
  • Heatsense Cables Limited
  • Tratos Cavi S.p.A
  • Cleveland Cable Company
  • Others

Single User License

10 % Off

USD

3,999

3,599

Datasheet

10 % Off

USD

2,499

2,249

Five User License

15 % Off

USD

4,999

4,249

Corporate License

15 % Off

USD

5,999

5,099

Single User License

One User

USD 3,999

USD 3,599

tax inclusive*

  • All Segments
  • Printing Restrictions
  • PDF Delivered via Email
  • Custom Report Layout
  • Post Sales Analysts Support
  • Periodic Updates
  • Unlimited Prints

Datasheet

One User

USD 2,499

USD 2,249

tax inclusive*

  • Selected Segments
  • Printing Restrictions
  • Excel Spreadsheet Delivered via Email
  • Full Report
  • Periodic Updates
  • Post Sales Analysts Support
  • Unlimited Prints

Five User License

Five User

USD 4,999

USD 4,249

tax inclusive*

  • All Segments
  • Five Prints Available
  • PDF Delivered via Email
  • Limited Free Customization
  • Post Sales Analyst Support
  • Custom Report Layout
  • Periodic Updates
  • Unlimited Prints

Corporate License

Unlimited Users

USD 5,999

USD 5,099

tax inclusive*

  • All Segments
  • Unlimited Prints Available
  • PDF & Excel Delivery via Email
  • Limited Free Customization
  • Post Sales Analysts Support
  • Discount On Next Update
  • Custom Report Layout

*Please note that the prices mentioned below are starting prices for each bundle type. Kindly contact our team for further details.*

Bundle Type

Flash Bundle

20% OFF Number of Reports: 3

Small Business Bundle

25% OFF Number of Reports: 5

Growth Bundle

30% OFF Number of Reports: 8

Enterprise Bundle

35% OFF Number of Reports: 10
Overview
  • Life Time Access
  • Analyst Support Related to Report
  • PDF Version of the Report
  • Complimentary Excel Data Set
  • Free Analyst Hours
  • Complimentary Free 1 Month Subscription to Trade Data Base
  • Complimentary One Month Subscription to Price Database (Chemicals only)
  • Complimentary PPT Version of the Report
  • Complimentary License Upgrade
  • Complimentary Power BI Dashboards
  • Life Time Access
  • Analyst Support Related to Report
  • PDF Version of the Report
  • Complimentary Excel Data Set
  • Free Analyst Hours - 50 Hours
  • Complimentary Free 1 Month Subscription to Trade Data Base
  • Complimentary One Month Subscription to Price Database (Chemicals only)
  • Complimentary PPT Version of the Report
  • Complimentary License Upgrade
  • Complimentary Power BI Dashboards
  • Life Time Access
  • Analyst Support Related to Report
  • PDF Version of the Report
  • Complimentary Excel Data Set
  • Free Analyst Hours - 80 Hours
  • Complimentary Free 1 Month Subscription to Trade Data Base
  • Complimentary One Month Subscription to Price Database (Chemicals only)
  • Complimentary PPT Version of the Report
  • Complimentary License Upgrade
  • Complimentary Power BI Dashboards
  • Life Time Access
  • Analyst Support Related to Report
  • PDF Version of the Report
  • Complimentary Excel Data Set
  • Free Analyst Hours - 100 Hours
  • Complimentary Free 1 Month Subscription to Trade Data Base
  • Complimentary One Month Subscription to Price Database (Chemicals only)
  • Complimentary PPT Version of the Report
  • Complimentary License Upgrade
  • Complimentary Power BI Dashboards

*Please note that the prices mentioned below are starting prices for each bundle type. Kindly contact our team for further details.*

Flash Bundle

Number of Reports: 3

20%

tax inclusive*

  • 3 Reports Included
  • Life Time Acess
  • Analyst Support Related to Report
  • PDF Version of the Report
  • Free 1 Month Subscription to Trade Data Base
  • 1 Month Subscription to Price Database (Chemicals only)
  • Complimentary Excel Data Set
  • PPT Version of the Report
  • Power BI Dashboards
  • License Upgrade
  • Free Analyst Hours

Small Business Bundle

Number of Reports: 5

25%

tax inclusive*

  • 5 Reports Included
  • Life Time Acess
  • Analyst Support Related to Report
  • PDF Version of the Report
  • Complimentary Excel Data Set
  • Free Analyst Hours - 50 Hours
  • Free 1 Month Subscription to Trade Data Base
  • 1 Month Subscription to Price Database (Chemicals only)
  • Complimentary Excel Data Set
  • PPT Version of the Report
  • Power BI Dashboards
  • License Upgrade

Growth Bundle

Number of Reports: 8

30%

tax inclusive*

  • 8 Reports Included
  • Life Time Acess
  • Analyst Support Related to Report
  • PDF Version of the Report
  • Complimentary Excel Data Set
  • Free Analyst Hours - 50 Hours
  • Free 1 Month Subscription to Trade Data Base
  • 1 Month Subscription to Price Database (Chemicals only)
  • License Upgrade
  • Free Analyst Hours - 80 Hours
  • Power BI Dashboards

Enterprise Bundle

Number of Reports: 10

35%

tax inclusive*

  • 10 Reports Included
  • Life Time Acess
  • Analyst Support Related to Report
  • PDF Version of the Report
  • Complimentary Excel Data Set
  • Free Analyst Hours - 50 Hours
  • Free 1 Month Subscription to Trade Data Base
  • 1 Month Subscription to Price Database (Chemicals only)
  • License Upgrade
  • Power BI Dashboards
  • Free Analyst Hours - 100 Hours

How To Order

This is a collaborative report by Avni Johari, Jaideep Kumar and Rakesh Nandi reflecting perspectives and research-driven insights from Expert Market Research.

Our step-by-step guide will help you select, purchase, and access your reports swiftly, ensuring you get the information that drives your decisions, right when you need it.

License Type

Select License Type

Choose the right license for your needs and access rights.

shopping cart

Click on ‘Buy Now’

Add the report to your cart with one click and proceed to register.

Bookmark Icon

Select Mode of Payment

Choose a payment option for a secure checkout. You will be redirected accordingly.

Strategic Solutions for Informed Decision-Making

Connect For More Information

Our expert team of analysts will offer full support and resolve any queries regarding the report, before and after the purchase.

Our expert team of analysts will offer full support and resolve any queries regarding the report, before and after the purchase.

We employ meticulous research methods, blending advanced analytics and expert insights to deliver accurate, actionable industry intelligence, staying ahead of competitors.

Our skilled analysts offer unparalleled competitive advantage with detailed insights on current and emerging markets, ensuring your strategic edge.

We offer an in-depth yet simplified presentation of industry insights and analysis to meet your specific requirements effectively.

We’re here to help answer any questions about our products and services.

Contact us