

Consumer Insights
Uncover trends and behaviors shaping consumer choices today
Procurement Insights
Optimize your sourcing strategy with key market data
Industry Stats
Stay ahead with the latest trends and market analysis.
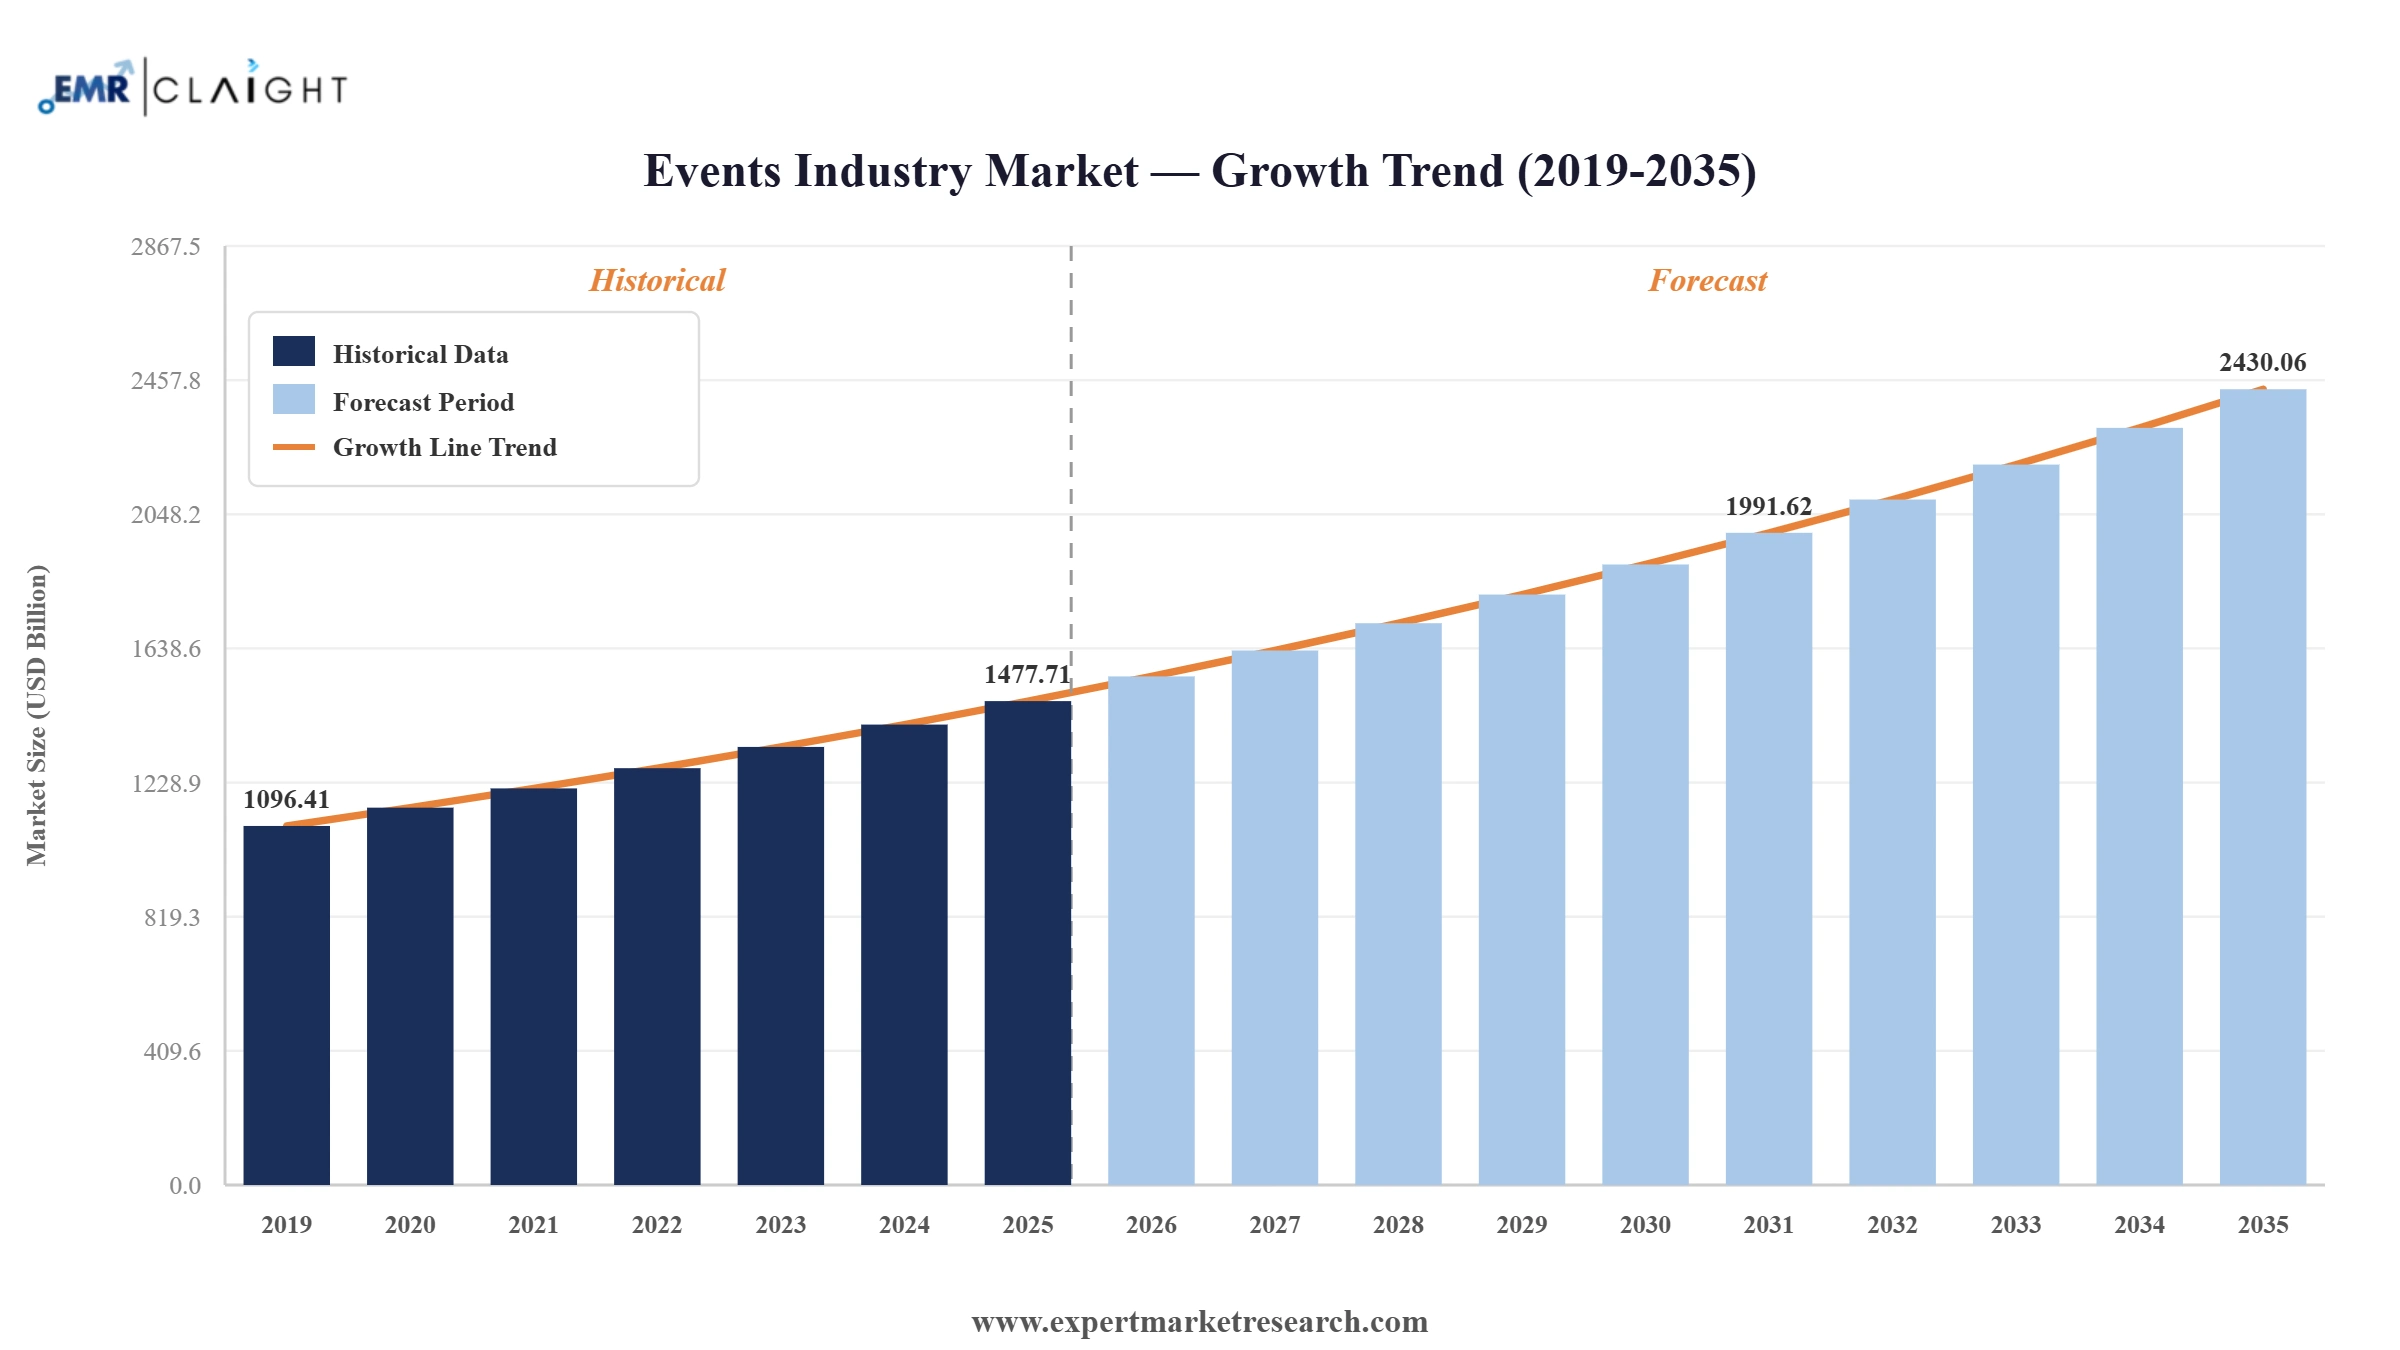
The global events industry market reached a value of USD 1477.71 Billion at 2025 and is projected to expand at a CAGR of around 5.10% during the forecast period of 2026-2035. With the increasing frequency of social and commercial gatherings globally, growing consumer spending on music festivals and sports events, a rising number of corporate sponsors investing in live engagement, and the expanding start-up ecosystem driving demand for conferences and exhibitions, the market is expected to reach USD 2430.06 Billion by 2035.
In May 2026, The world's leading exhibition organizers including Clarion Events, Comexposium, Emerald, Informa Markets, Messe Frankfurt, and RX announced they will join forces on June 3, 2026, to mark the 11th edition of Global Exhibitions Day (GED), united under the theme "Exhibitions Drive Opportunities," calling on businesses, policymakers, and communities worldwide to recognize the transformative power of exhibitions.
In March 2026, Informa announced a strategic collaboration with Ascential to integrate the prestigious Cannes Lions International Festival of Creativity into its events portfolio, significantly strengthening Informa's position in the creative, marketing, and media event sectors.
In June 2025, Reed Exhibitions successfully hosted INTERPHEX 2025, collaborating with leading pharmaceutical and biotechnology companies to showcase innovations, strengthen industry partnerships, and promote advancements in manufacturing, quality control, and supply chain solutions.
Read more about this report - REQUEST FREE SAMPLE COPY IN PDF
| Global Events Industry Market Report Summary | Description | Value |
| Base Year | USD Billion | 2025 |
| Historical Period | USD Billion | 2019-2025 |
| Forecast Period | USD Billion | 2026-2035 |
| Market Size 2025 | USD Billion | 1477.71 |
| Market Size 2035 | USD Billion | 2430.06 |
| CAGR 2019-2025 | Percentage | 1.3% |
| CAGR 2026-2035 | Percentage | 5.10% |
| CAGR 2026-2035 - Market by Region | Asia Pacific | 5.5% |
| CAGR 2026-2035 - Market by Country | India | 6.4% |
| CAGR 2026-2035 - Market by Country | China | 5.7% |
| CAGR 2026-2035 - Market by Type | Music Events | 6.4% |
| CAGR 2026-2035 - Market by End Use | Sponsorship | 5.4% |
| Market Share by Country | USA | 30.3% |
The global events industry market is experiencing a period of vigorous growth and rapid consolidation, with major event technology companies, venue operators, and organisers accelerating acquisition strategies to secure market position. Artificial intelligence is transforming attendee experiences and event planning workflows, while rising consumer appetite for live experiences across music, sports, and cultural formats is driving sustained volume and revenue growth across all event types and geographies.
Cvent spent approximately USD 700 million in December 2025, acquiring ON24 for USD 400 million and Goldcast for approximately USD 300 million. The deals extended Cvent's acquisitions to seven since January 2024, signalling its shift toward AI-powered event marketing platforms.
Reed Exhibitions (RX) unveiled AI-powered matchmaking capabilities across its global event portfolio in August 2025, integrating machine learning algorithms that analyse attendee profiles, behavioural signals, and engagement patterns to generate personalised networking recommendations across its technology and food ingredients events.
GL events acquired 100% of B4Event, the organiser of 12 medical congresses in France focused primarily on geriatrics, in July 2025. The acquisition expanded GL events' congress management portfolio and strengthened its medical and healthcare sector events capabilities.
Cvent acquired Prismm, a leader in spatial event design technology, in April 2025. The deal added 3D venue visualisation and floor plan design capabilities to Cvent's event management platform, strengthening its position in event space planning.
North America leads the global events industry market. In 2023, live events averaged 12,655 tickets sold per show globally, while 10% of companies increased their meetings and events budgets by more than 11%, reflecting strong audience demand and corporate reinvestment.
Sponsorship is the dominant revenue source in the global events industry market, driven by brands seeking direct consumer engagement at events. The rising number of corporate sponsors and growing use of data analytics to demonstrate ROI is expanding sponsorship revenues.
Music and sports events are among the fastest-growing types in the global events industry market. CTS Eventim sold 177.9 million tickets globally in 2025, up 30.7 million year-on-year, generating EUR 3.079 billion in revenue and reflecting sustained strong audience demand.
Corporate events and exhibitions are growing in the global events industry market, driven by the expanding start-up ecosystem. As of July 2023, 1,200 unicorn start-ups worldwide actively engaged in conferences, exhibitions, and networking events, creating sustained demand for professional formats.
Asia Pacific is the fastest-growing region in the global events industry market, driven by large-scale mega events including Expo 2025 Osaka. The region's rapid urbanisation, rising disposable incomes, and expanding business ecosystem are generating growing demand across all event types.
The report by Expert Market Research titled "Global Events Industry Market Report and Forecast 2026-2035" offers a detailed analysis of the market based on the following segments:
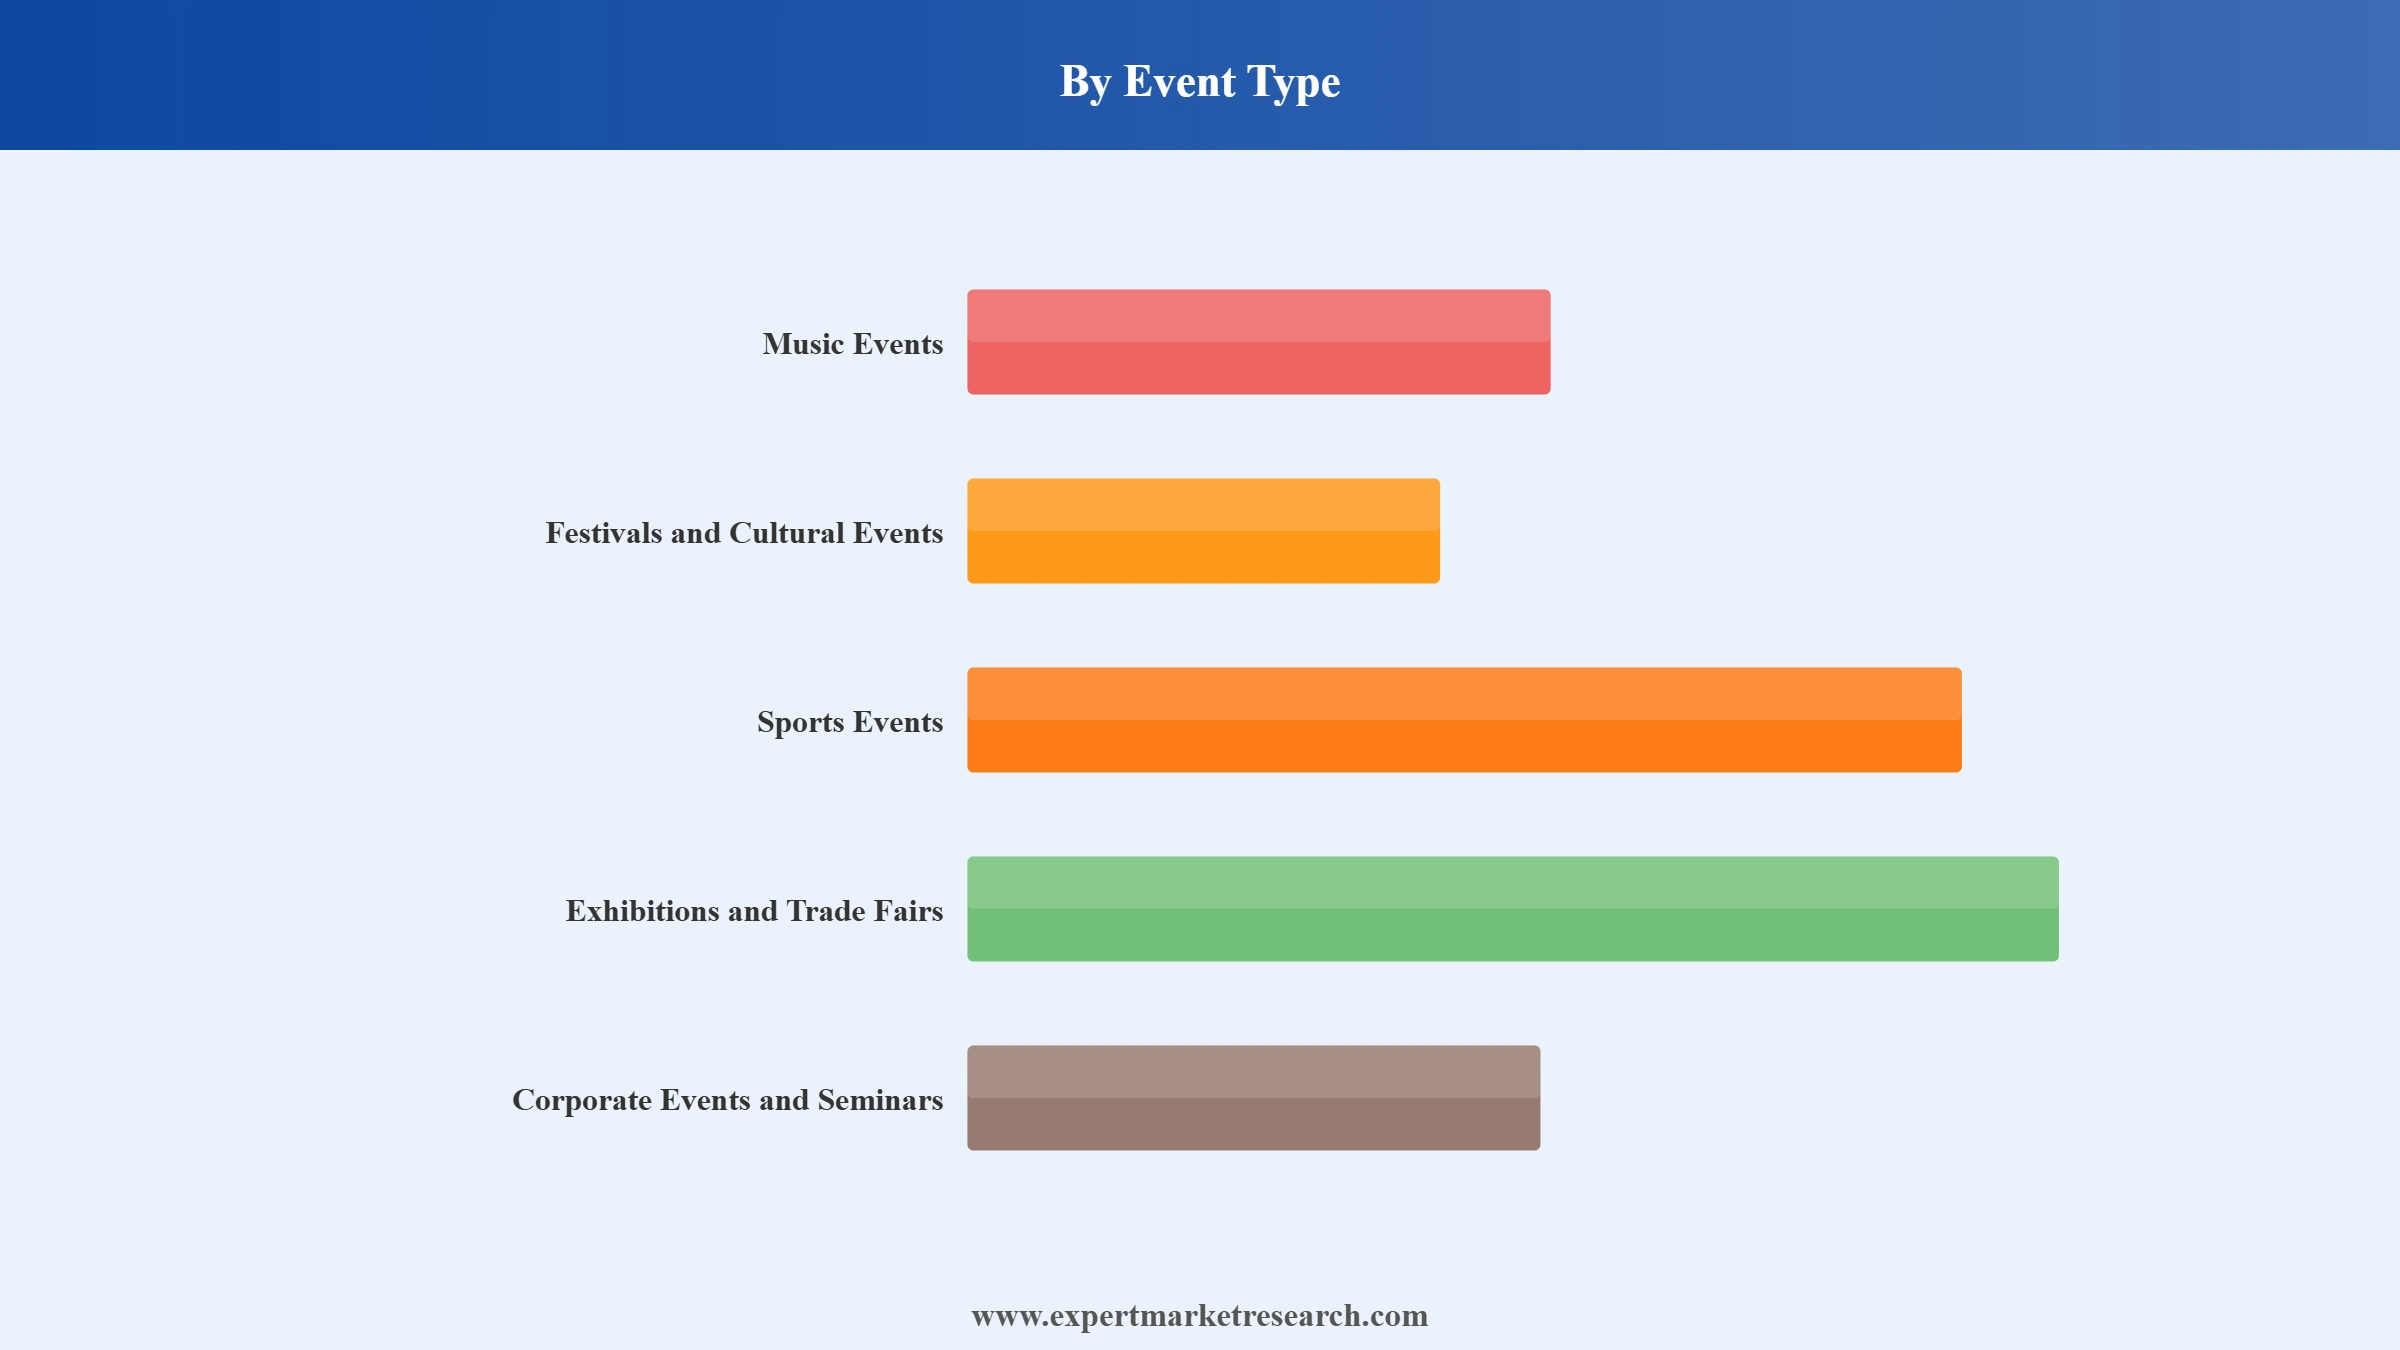
Market Breakup by Event Type
Key Insight: Corporate events and seminars are the dominant event type in the global events industry market, representing the largest revenue share through a high volume of recurring business conferences, executive meetings, product launches, corporate retreats, and professional development seminars. Corporate event spending is supported by rising corporate budgets, with 10% of companies globally increasing their meetings and events expenditure by more than 11% in 2023. The growing start-up ecosystem, with 1,200 unicorn start-ups globally as of July 2023, is also driving significant corporate event demand. Music events and sports events are the fastest-growing types, fuelled by sustained consumer appetite for live entertainment experiences and the expansion of global artist touring.
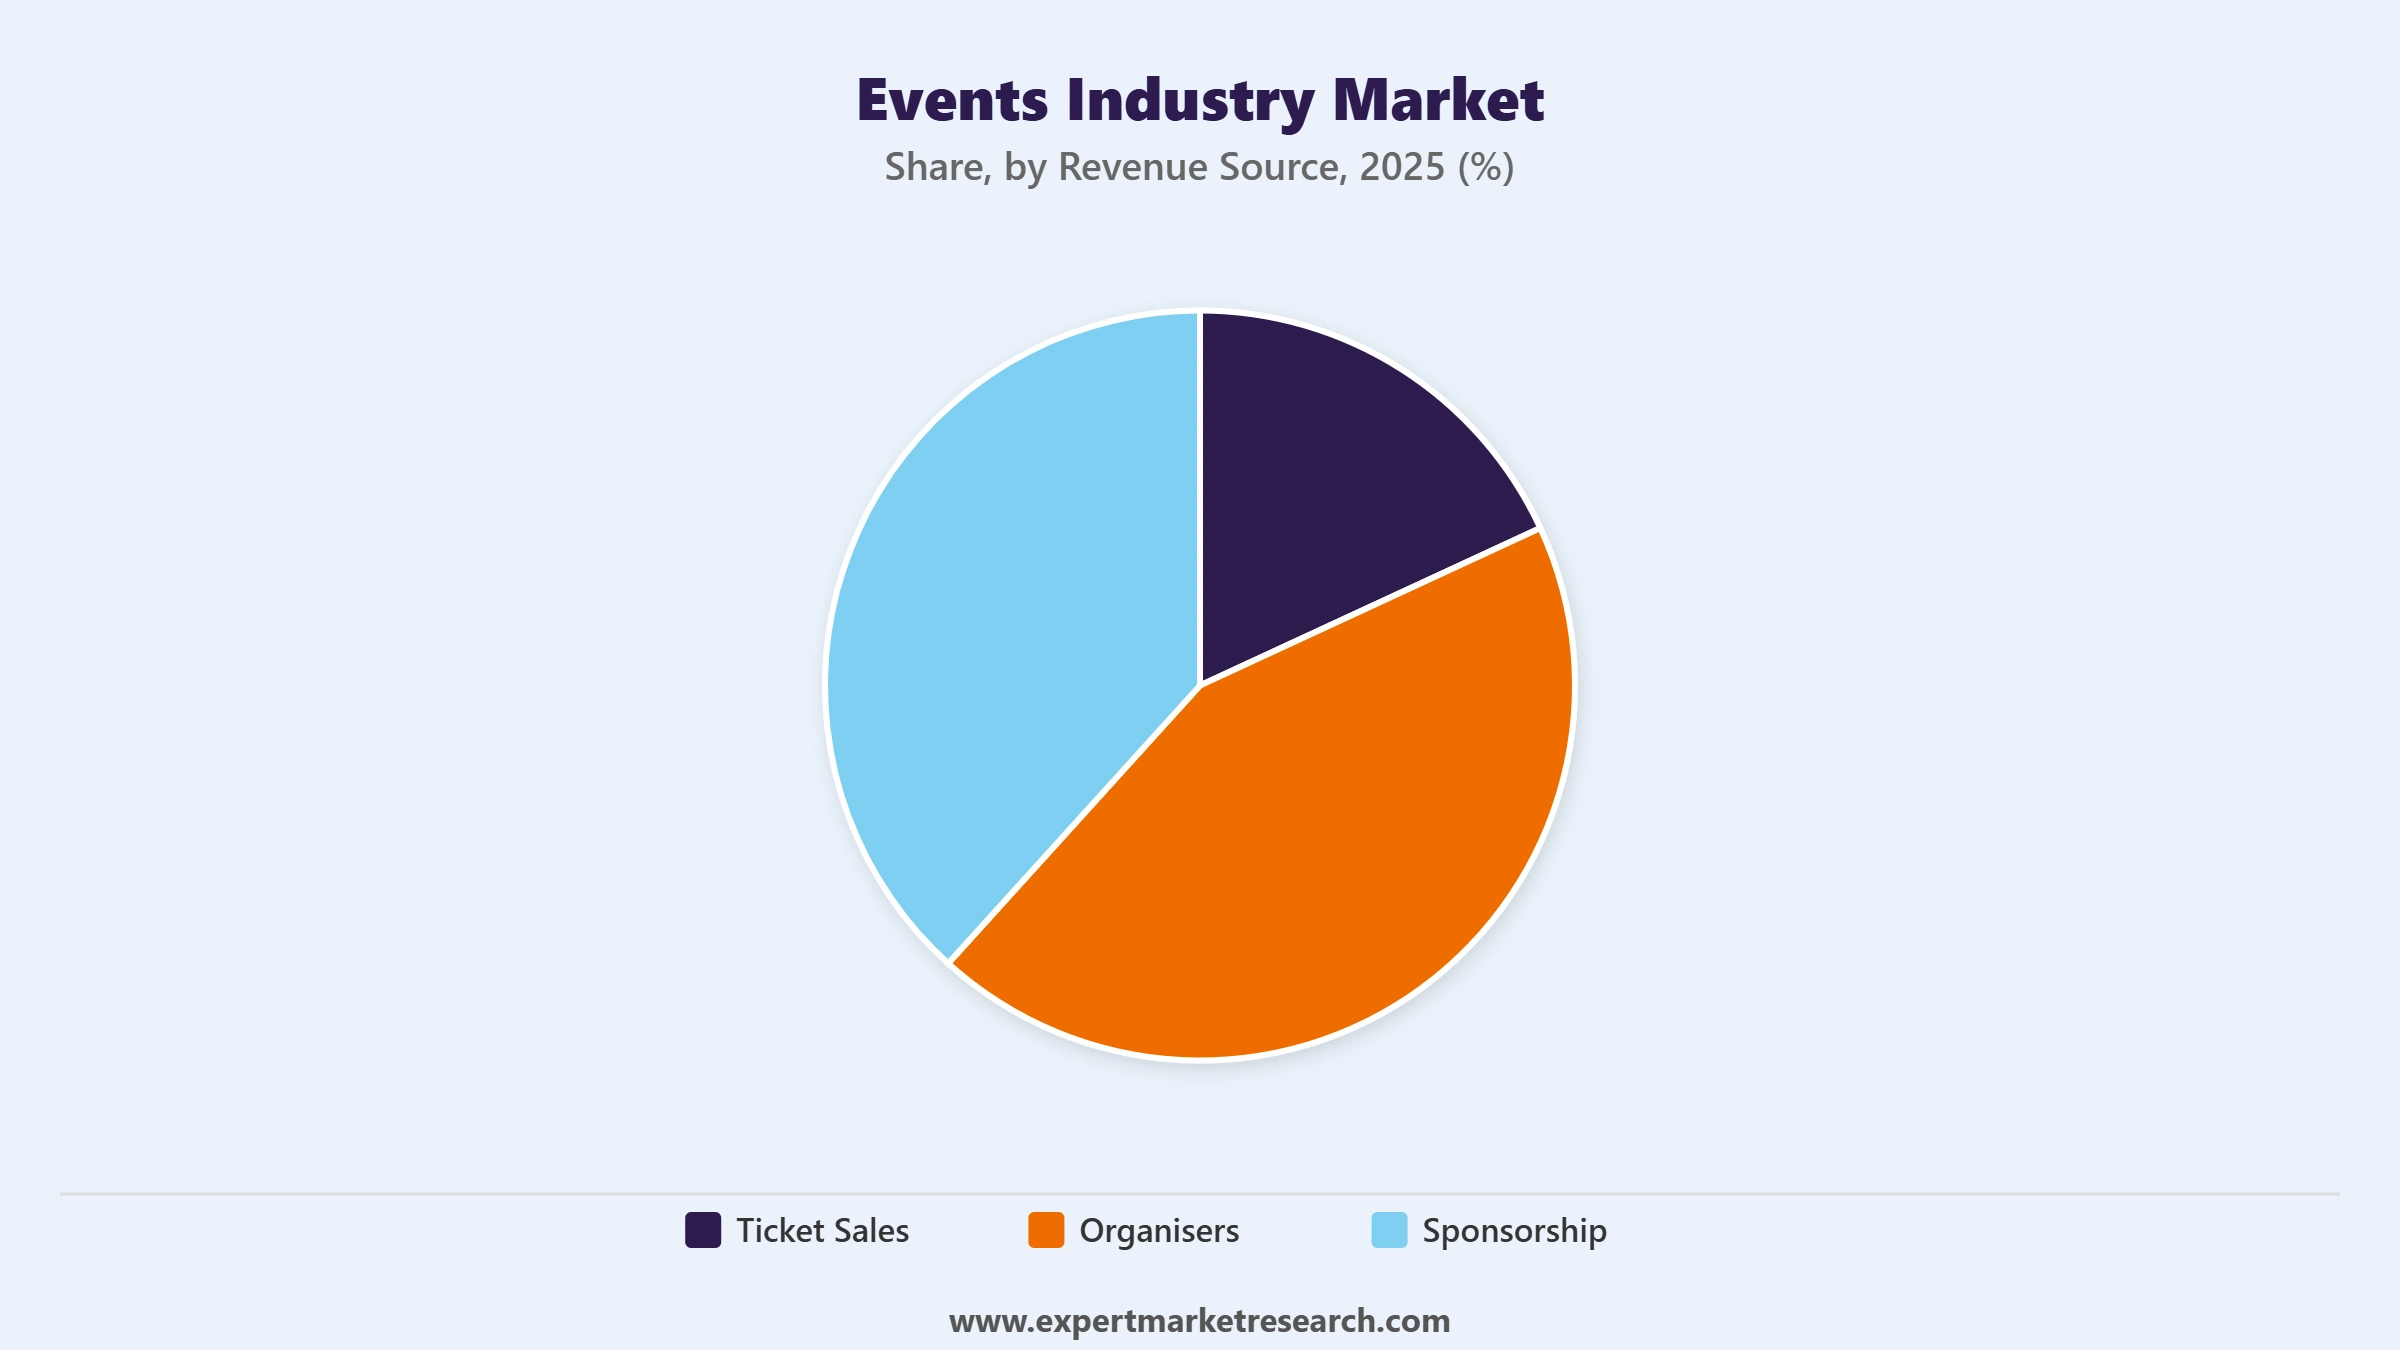
Market Breakup by Revenue Source
Key Insight: Sponsorship is the dominant revenue source in the global events industry market, generating the largest share of total market revenue through brand investments in music festivals, sports events, trade exhibitions, and corporate gatherings. Brands leverage event sponsorship for direct consumer engagement, experiential marketing, and measurable ROI, reinforcing the category's dominance. Ticket sales are the fastest-growing revenue source, supported by rising live event attendance globally, the acceleration of digital and mobile ticketing platforms, and the growth of premium and VIP ticket offerings. CTS Eventim sold 177.9 million tickets in 2025, up 30.7 million from the prior year, illustrating the sustained momentum of ticket revenue in the sector.
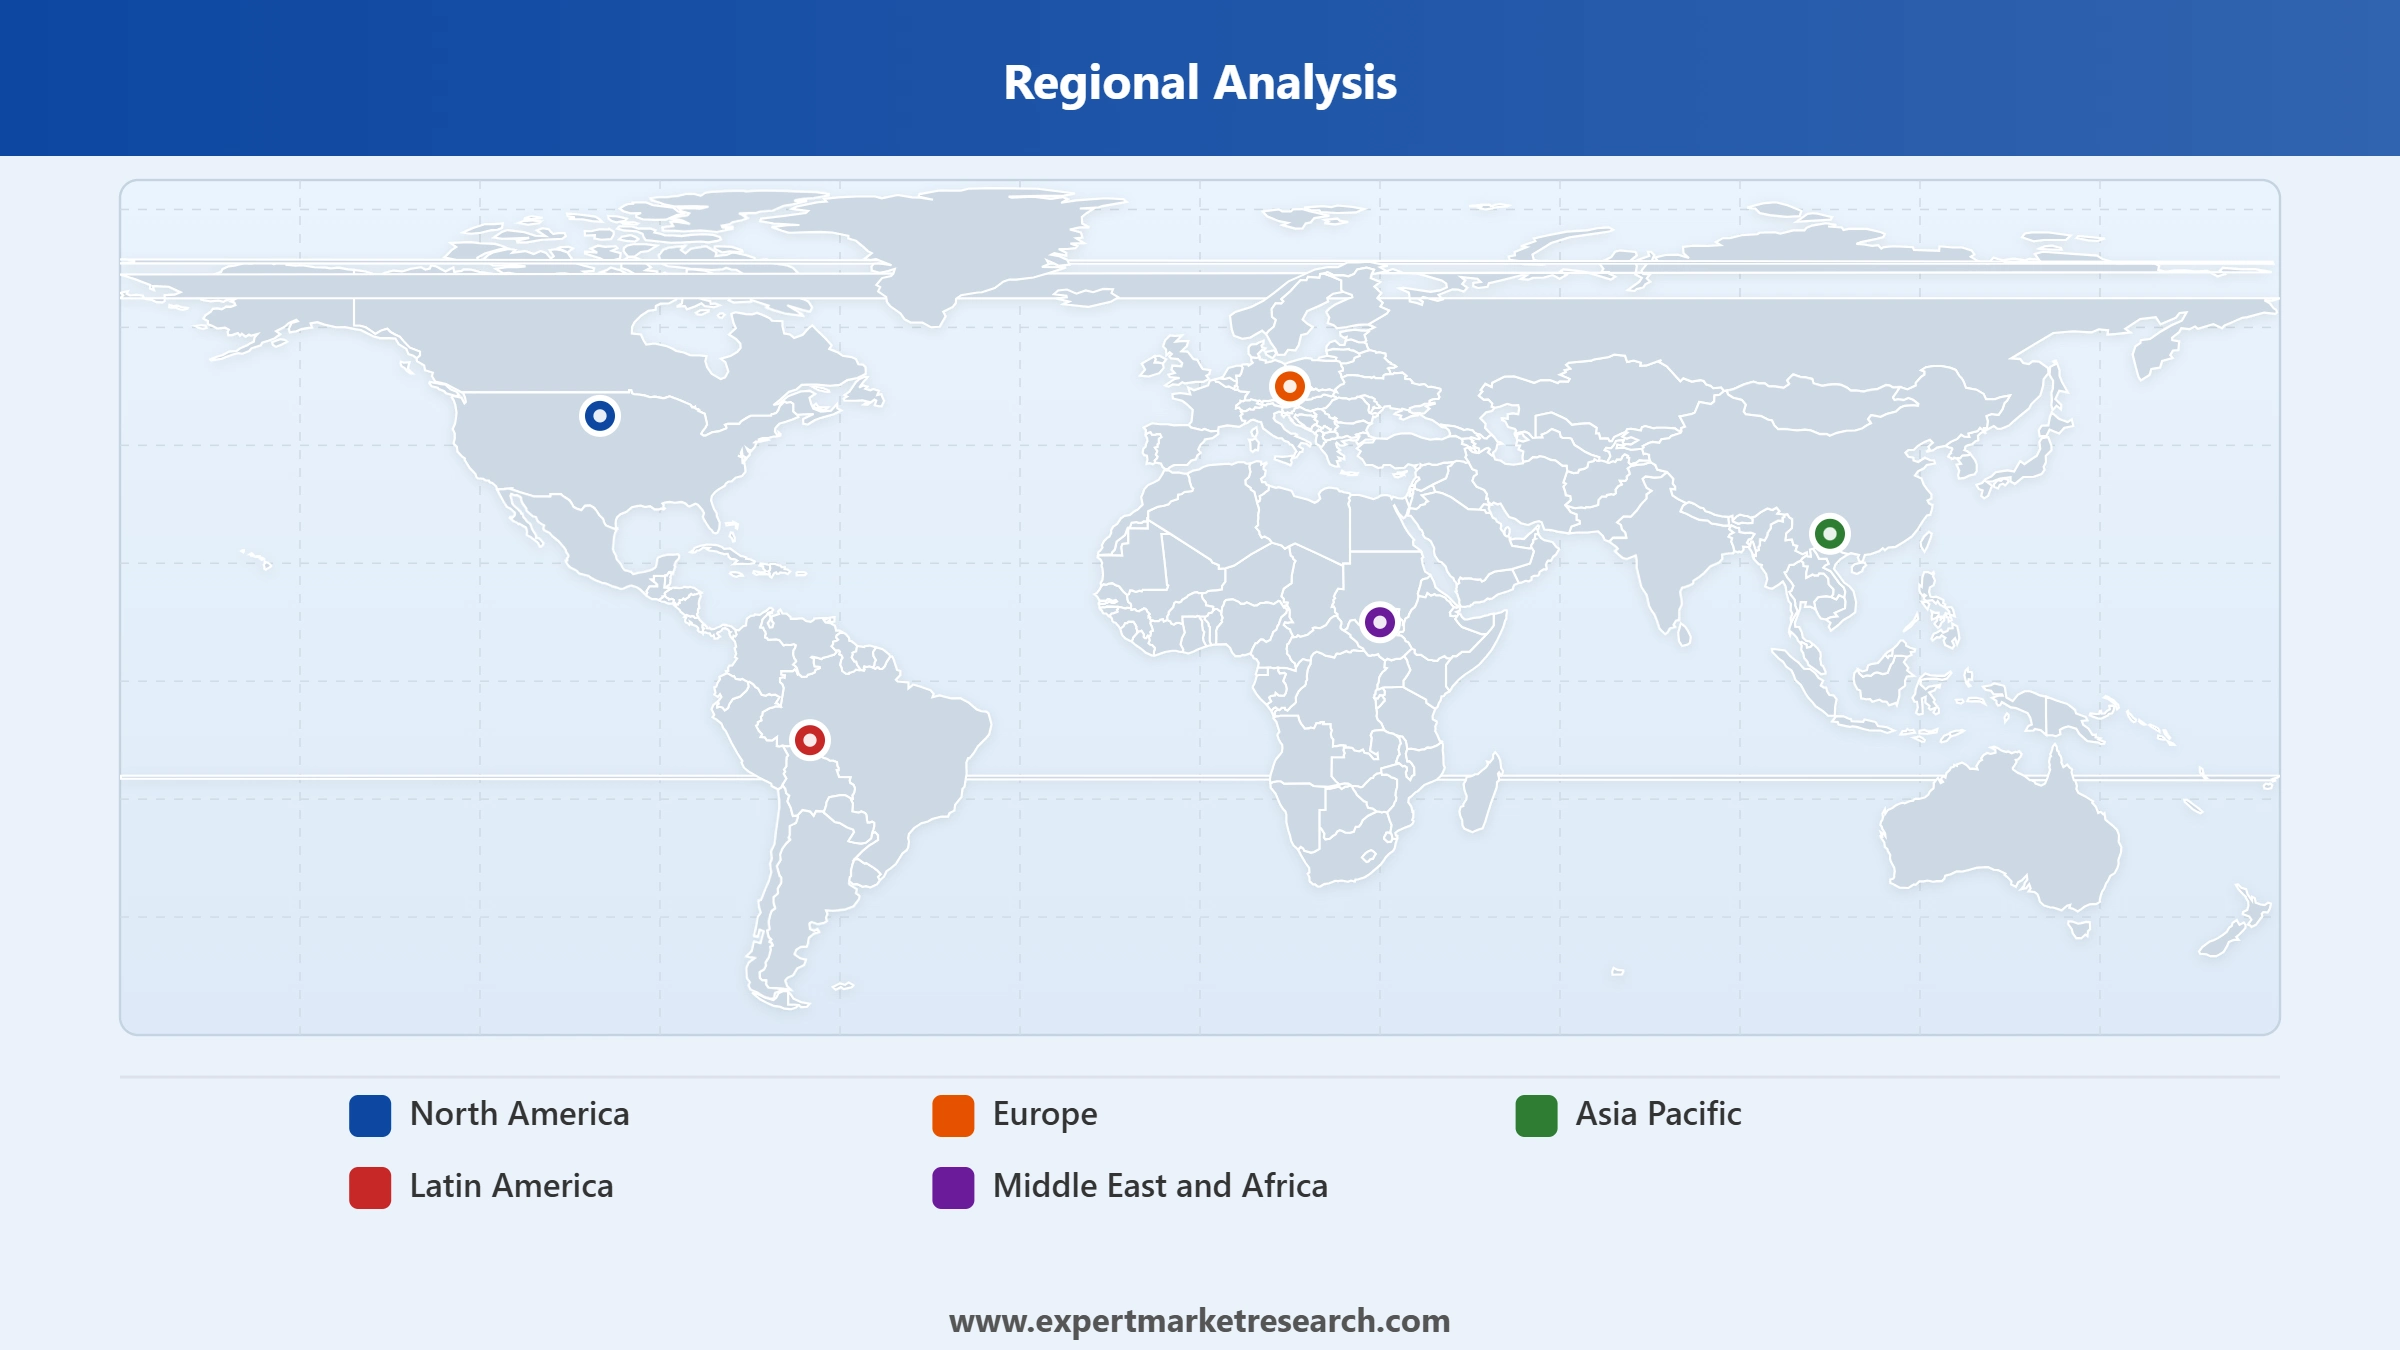
Market Breakup by Region
North America
Key Insight: Europe is the leading region in the global events industry market, holding the largest revenue share driven by mature events infrastructure, a rich calendar of music festivals, trade fairs, sports events, and congresses across the United Kingdom, Germany, France, and Italy. Germany's Messe Frankfurt and Messe Dusseldorf, the UK's Reed Exhibitions and Clarion Events, and France-based GL events operate some of the world's most prominent exhibition and live events venues from this region. Asia Pacific is the fastest-growing region, propelled by major mega events including Expo 2025 Osaka, the Aichi-Nagoya Asian Games, the growing corporate conference sector in China, India, and ASEAN, and rapid urbanisation. North America is a major market anchored by the United States' scale of music, sports, and corporate event activity. Latin America and the Middle East and Africa are high-growth emerging regions.


Read more about this report - REQUEST FREE SAMPLE COPY IN PDF
By Event Type, corporate events and seminars account for the dominant share of the market due to high-frequency recurring corporate demand and growing start-up ecosystem engagement
Corporate events and seminars are the dominant event type in the global events industry market, generating the largest revenue contribution through a sustained high volume of business conferences, executive retreats, product launches, and training seminars that span all geographies and industries. Corporate event budgets are rising, with 10% of companies globally increasing their meetings and events spending by more than 11% in 2023. The expanding global start-up ecosystem, with over 1,200 unicorn companies worldwide as of July 2023, is also a significant structural driver of professional event demand.
Read more about this report - REQUEST FREE SAMPLE COPY IN PDF
Music events are the fastest-growing event type in the global events industry market, supported by robust consumer appetite for live entertainment, the sustained expansion of global artist touring, and the growth of large-format music festivals across Europe, North America, and Asia Pacific. CTS Eventim's FY2025 results, with revenues of EUR 3.079 billion and ticket sales of 177.9 million, illustrate the scale and growth momentum of the live entertainment segment. Sports events are similarly growing rapidly, with major global sporting tournaments including the FIFA World Cup, the Olympics, and Formula 1 grands prix generating significant ticketing, sponsorship, and broadcast revenue.
By Revenue Source, sponsorship accounts for the dominant share of the market due to strong brand demand for direct consumer engagement at live events
Sponsorship is the dominant revenue source in the global events industry market, generating the largest share of total revenue through brand investment in music festivals, sports events, trade exhibitions, and corporate gatherings. Corporate sponsors value event partnerships for their ability to deliver direct consumer engagement, experiential marketing opportunities, and measurable brand ROI. The growing use of data analytics tools to demonstrate event sponsorship effectiveness has reinforced brand commitment to the channel, with rising sponsorship commitments evident across both commercial and non-commercial event formats globally.
Read more about this report - REQUEST FREE SAMPLE COPY IN PDF
Ticket sales are the fastest-growing revenue source in the global events industry market, driven by rising live event attendance, the rapid adoption of digital and mobile ticketing platforms, and the expansion of premium ticket offerings across music, sports, and cultural events. CTS Eventim sold 177.9 million tickets in FY2025, up 30.7 million year-on-year, with its ticketing segment generating revenues of EUR 977.1 million at an adjusted EBITDA margin of 46.4%. Cvent's December 2025 acquisition of ON24 and July 2025 integration of QuickMobile also reflects the industry-wide investment in digital event management and ticketing infrastructure.
Europe dominates the market due to mature events infrastructure, a diverse calendar of trade fairs, music festivals, and cultural events, and home to several of the world's largest event organiser companies
Europe holds the dominant position in the global events industry market, generating the largest regional revenue share through a dense and mature events ecosystem spanning the United Kingdom, Germany, France, Italy, and the Netherlands. The region is home to some of the world's most prominent event organisers, including Reed Exhibitions, GL events, Clarion Events, and CTS Eventim, as well as globally recognised exhibition venues including Messe Frankfurt and Messe Dusseldorf. GL events directly participated in two of the most significant global events of 2025, supporting Expo 2025 Osaka and the initial milestones of the Milano Cortina 2026 Olympic and Paralympic Winter Games, while also assuming operations at the Stade de France. CTS Eventim's FY2025 revenues of EUR 3.079 billion, up 9.6% year-on-year, reflect the scale and resilience of European live entertainment and ticketing demand.
Read more about this report - REQUEST FREE SAMPLE COPY IN PDF
Asia Pacific is the fastest-growing region in the global events industry market, driven by large-scale international mega events, a rapidly expanding corporate conference and exhibition sector, and strong growth in consumer demand for live entertainment across China, India, Japan, and ASEAN. Expo 2025 Osaka, the Aichi-Nagoya Asian Games, and GL events' multi-year contracts for Formula 1 grands prix at Interlagos underscore the scale of the global events portfolio now being staged in this region. North America is a substantial and established market anchored by the United States, which hosts a large proportion of the world's top music festivals, professional sports events, and corporate conferences. The Middle East and Africa, particularly Saudi Arabia and the UAE through Vision 2030-related event investments, represents a high-priority emerging growth market.
The global events industry market is a highly fragmented but rapidly consolidating sector, encompassing event organisers, venue operators, technology platform providers, corporate travel and events managers, and ticketing specialists. The competitive landscape is being reshaped by an unprecedented wave of consolidation, with technology platforms including Cvent completing seven acquisitions since January 2024 alone, and private equity investment flowing into event organiser acquisitions including Marketplace Events and ASM Global. Scale, technology capability, geographic reach, and event portfolio diversification are the primary sources of competitive advantage.
European companies including GL events, Reed Exhibitions, Clarion Events, and CTS Eventim lead the competitive landscape for live events, exhibitions, and trade fairs, while US-based platforms including Cvent and ASM Global compete across technology, venue management, and corporate events. The integration of AI-powered personalisation tools, data analytics for sponsorship ROI measurement, and digital ticketing infrastructure is redefining competitive positioning across all event industry segments heading into the forecast period.
ATPI Ltd. is a global corporate travel and events management company headquartered in London, United Kingdom. It provides end-to-end event management services for corporate clients across industries including energy, marine, and sports. ATPI operates in over 100 countries, delivering tailored event planning, logistics, and travel management solutions to multinational corporations and professional sports organisations.
Triumph Group International S.P.A. Benefit Company is an Italian-based events management firm that organises and manages international events, congresses, and exhibitions. As a certified benefit company, Triumph Group integrates social and environmental responsibility into its event management business model, delivering large-scale meetings, product launches, and cultural events for global clients across Europe and beyond.
Reed Exhibitions Limited, founded in 1960 in Surrey, United Kingdom, is one of the world's largest event organiser companies. It delivers event management and exhibitions across automotive, transport, aerospace, construction, beauty, technology, and energy industries. RX operates in over 30 countries and launched AI-powered matchmaking capabilities across its global portfolio in August 2025.
GL events Group, established in 1978 and headquartered in Lyon, France, provides event management services for live events, venues, and exhibitions. Operating in over 20 countries with close to 100 venues worldwide, GL events supports major global events, acquired B4Event in July 2025, and holds multi-year contracts for the Stade de France, Las Vegas and Interlagos Formula 1 Grands Prix.
Other key players in the market are BCD Meetings & Events, Anschutz Entertainment Group, Inc., ASM Global, CTS EVENTIM AG & Co. KGaA, Clarion Events Ltd., Cvent Inc., and Others.
*Please note that this is only a partial list; the complete list of key players is available in the full report. Additionally, the list of key players can be customized to better suit your needs.*
Gain comprehensive insight into the global events industry market with Expert Market Research's definitive 2026 report. Explore detailed analysis of event type performance from music and sports to corporate conferences and trade exhibitions, regional market dynamics across Europe, North America, and Asia Pacific, revenue source growth in ticket sales and sponsorship, and competitive strategies from leading global event organisers. Whether you are an event company, venue operator, technology provider, corporate event buyer, or strategic investor, this report provides the clarity and evidence needed to succeed in the world's expanding events sector. Download your free sample today.
Upto 15% Off
USD
$2499 $2249
$3999 $3599
$4999 $4249
$5999 $5099


*While we strive to always give you current and accurate information, the numbers depicted on the website are indicative and may differ from the actual numbers in the main report. At Expert Market Research, we aim to bring you the latest insights and trends in the market. Using our analyses and forecasts, stakeholders can understand the market dynamics, navigate challenges, and capitalize on opportunities to make data-driven strategic decisions.*
The Events Industry market reached USD 1477.71 Billion in 2025
The market is projected to grow at a CAGR of 5.10% between 2026 and 2035.
The market is estimated to witness healthy growth in the forecast period of 2026-2035 to reach about USD 2430.06 Billion by 2035.
The events industry is a dynamic sector that involves organising and hosting several events, including trade shows, conferences, and exhibitions. It helps businesses, industries, and individuals to share knowledge, network with an audience, and showcase products.
The event industry supports the economy by creating jobs, generating revenue, attracting visitors, and promoting destinations.
The major drivers of the market include the increasing frequency of social and non-social gatherings, the rising number of sponsors, and the growing corporate culture.
The increasing number of live performances, rising corporate events, and technological advancements are supporting the market growth.
The major regions in the market are North America, Latin America, the Middle East and Africa, Europe, and the Asia Pacific.
The major event types include music events, festivals and cultural events, sports events, exhibitions and trade fairs, and corporate events and seminars.
The key players include ATPI Ltd., Triumph Group International S.P.A. Benefit Company, Reed Exhibitions Limited, GL Events Group, BCD Meetings & Events, Anschutz Entertainment Group, Inc., ASM Global, CTS EVENTIM AG & Co. KGaA, Clarion Events Ltd., Cvent Inc., and Others.
Yes, it is a big industry.
2026-2035 is the forecast period in the market.
Explore our key highlights of the report and gain a concise overview of key findings, trends, and actionable insights that will empower your strategic decisions.
| REPORT FEATURES | DETAILS |
| Base Year | 2025 |
| Historical Period | 2019-2025 |
| Forecast Period | 2026-2035 |
| Scope of the Report |
Historical and Forecast Trends, Industry Drivers and Constraints, Historical and Forecast Market Analysis by Segment:
|
| Breakup by Event Type |
|
| Breakup by Revenue Source |
|
| Breakup by Region |
|
| Market Dynamics |
|
| Competitive Landscape |
|
| Companies Covered |
|
Datasheet
One User
USD 2,499
USD 2,249
tax inclusive*
Single User License
One User
USD 3,999
USD 3,599
tax inclusive*
Five User License
Five User
USD 4,999
USD 4,249
tax inclusive*
Corporate License
Unlimited Users
USD 5,999
USD 5,099
tax inclusive*
*Please note that the prices mentioned below are starting prices for each bundle type. Kindly contact our team for further details.*
Flash Bundle
Small Business Bundle
Growth Bundle
Enterprise Bundle
*Please note that the prices mentioned below are starting prices for each bundle type. Kindly contact our team for further details.*
Flash Bundle
Number of Reports: 3
20%
tax inclusive*
Small Business Bundle
Number of Reports: 5
25%
tax inclusive*
Growth Bundle
Number of Reports: 8
30%
tax inclusive*
Enterprise Bundle
Number of Reports: 10
35%
tax inclusive*
How To Order

Select License Type
Choose the right license for your needs and access rights.

Click on ‘Buy Now’
Add the report to your cart with one click and proceed to register.

Select Mode of Payment
Choose a payment option for a secure checkout. You will be redirected accordingly.
Strategic Solutions for Informed Decision-Making
Gain insights to stay ahead and seize opportunities.

Get insights & trends for a competitive edge.

Track prices with detailed trend reports.

Analyse trade data for supply chain insights.

Leverage cost reports for smart savings

Enhance supply chain with partnerships.

Connect For More Information
Our expert team of analysts will offer full support and resolve any queries regarding the report, before and after the purchase.
Our expert team of analysts will offer full support and resolve any queries regarding the report, before and after the purchase.
We employ meticulous research methods, blending advanced analytics and expert insights to deliver accurate, actionable industry intelligence, staying ahead of competitors.
Our skilled analysts offer unparalleled competitive advantage with detailed insights on current and emerging markets, ensuring your strategic edge.
We offer an in-depth yet simplified presentation of industry insights and analysis to meet your specific requirements effectively.


