

Consumer Insights
Uncover trends and behaviors shaping consumer choices today
Procurement Insights
Optimize your sourcing strategy with key market data
Industry Stats
Stay ahead with the latest trends and market analysis.
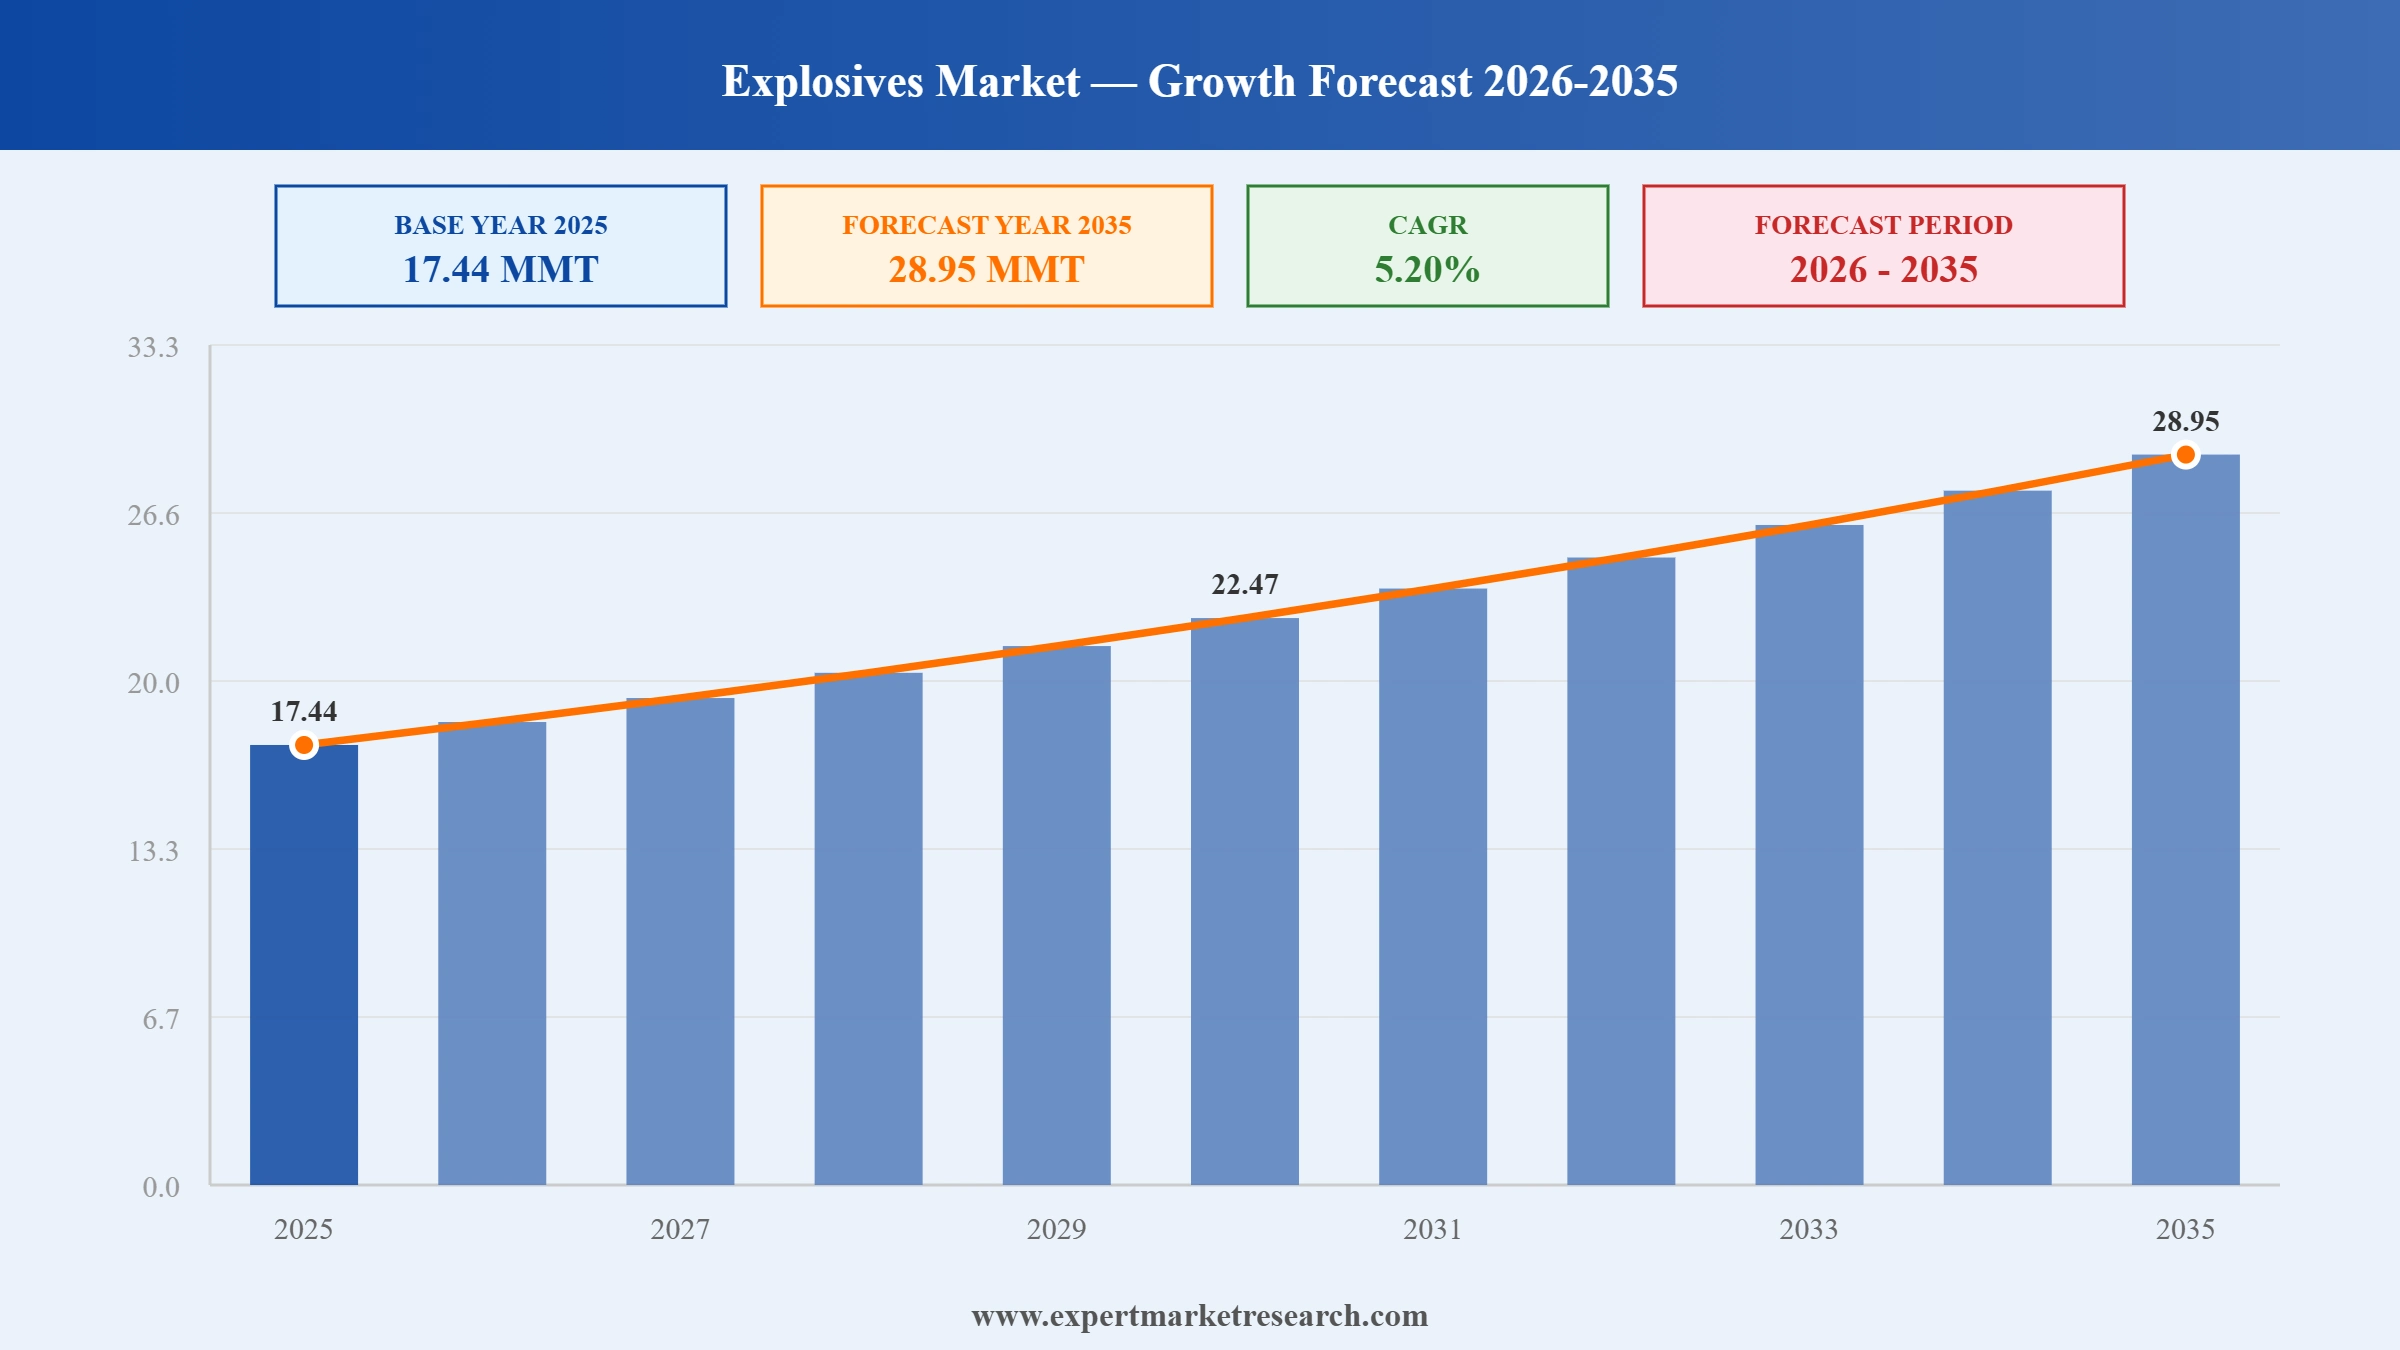
The Global Explosives Market reached a volume of 17.44 MMT at 2025 and is projected to expand at a CAGR of around 5.20% during the forecast period of 2026-2035. With sustained coal mining demand, accelerating metal mining for copper, lithium, and gold, the rapid uptake of electronic detonators, and infrastructure-led construction blasting, the market is expected to reach 28.95 MMT by 2035.
Read more about this report - REQUEST FREE SAMPLE COPY IN PDF
| Global Explosives Market Report Summary | Description | Value |
| Base Year | MMT | 2025 |
| Historical Period | MMT | 2019-2025 |
| Forecast Period | MMT | 2026-2035 |
| Market Size 2025 | MMT | 17.44 |
| Market Size 2035 | MMT | 28.95 |
| CAGR 2019-2025 | Percentage | XX% |
| CAGR 2026-2035 | Percentage | 5.20% |
| CAGR 2026-2035 - Market by Region | Asia Pacific | 6.0% |
| CAGR 2026-2035 - Market by Country | India | 6.9% |
| CAGR 2026-2035 - Market by Country | China | 5.7% |
| CAGR 2026-2035 - Market by End Use | Metal Mining | 5.9% |
| CAGR 2026-2035 - Market by End Use | Coal Mining | 5.6% |
| Market Share by Country 2025 | Italy | 2.5% |
The Global Explosives Market is being shaped by digital initiation systems, energy-transition mining, sustainable bulk emulsion chemistry, and continued consolidation among pure-play explosives suppliers, with regional capacity additions reshaping competitive dynamics.
Incitec Pivot, through Dyno Nobel, advanced its partnership with Saudi Arabia's Modern Chemicals Company (MCC) to construct the Kingdom's first technical-grade ammonium nitrate facility. The plant, planned at Ras Al Khair Industrial City in Eastern Province, is designed for 300,000 tonnes per annum of TAN capacity, anchoring local supply for mining, construction, and quarrying operations. The investment supports Saudi Vision 2030 industrial-localisation goals and creates a new Middle East supply hub for explosives feedstock for regional and African mining.
Following shareholder approval at its 19 December 2024 Annual General Meeting, Incitec Pivot moved forward with the demerger of its explosives and fertiliser businesses. Dyno Nobel emerged as a pure-play global explosives business, while Incitec Pivot Fertilisers was created as a separately listed entity. The split is intended to sharpen capital allocation and re-pricing across Dyno Nobel's North American and Australian operations, while enabling its new leadership to focus the business transformation programme on operational efficiency, customer technology adoption, and recontracting.
Orica Limited completed the acquisition of Cyanco for USD 640 million, more than doubling its sodium cyanide production capacity to approximately 240 kilotons per annum. The deal substantially deepens Orica's exposure to North American gold mining customers and complements its mining services and digital monitoring portfolio. The acquisition reinforces Orica's strategic positioning as a one-stop provider for blasting agents, mining chemicals, and digital optimisation, with synergies expected across customer relationships, manufacturing, and logistics in major North American gold districts.
Orica Limited signed a USD 377 million (A$556.76 million) agreement with Vance Street Capital to acquire Terra Insights, a Vancouver-based supplier of geotechnical, structural, and geospatial monitoring technology. Terra Insights provides InSAR sensors, GPS/GNSS monitoring, data loggers, gateways, and software platforms used across mining and infrastructure assets in more than 90 countries. The deal accelerates Orica's strategy of bundling digital insights with blasting services, helping mining customers improve safety, productivity, and ESG outcomes.
Dyno Nobel introduced a next-generation bulk emulsion explosives line designed to deliver reduced NOx emissions during blasting, supporting customer ESG targets and tightening air-quality standards. The launch reflects more than 15% of the explosives portfolio now focused on greener and more sustainable blasting solutions, with reformulated emulsion chemistries and improved oxygen balancing. Dyno Nobel positioned the product line for mining and quarrying customers seeking measurable reductions in post-blast fume events while maintaining productivity at large-scale surface and underground operations.
Electronic detonators continued their advance in 2025, holding around 39.38% of the initiation segment and projected to expand at a 4.28% CAGR through 2031. Programmable timing improves fragmentation, cuts misfires, lowers vibration impacts on neighbouring infrastructure, and helps mines comply with tighter regulatory limits. Adoption is rising fastest in large surface operations across Australia, Chile, Canada, and Africa, with payback periods often under 18 months. The shift is fuelling Global Explosives Market growth by enabling premium pricing for digital initiation packages and reinforcing supplier differentiation through software, training, and analytics.
Mining for copper, lithium, gold, and rare earth elements is structurally accelerating to support the energy transition, lifting explosives demand across Latin America, Africa, and Australia. Brazil and Chile lead copper and lithium output expansion, while battery-metal projects in Argentina, Indonesia, and the Democratic Republic of Congo are scaling. Each new mine drives demand for bulk emulsions, ammonium nitrate, and electronic detonators. The trend is shifting product mix towards higher-energy formulations and digital blasting services, and is encouraging suppliers including Orica, Enaex, and Maxam to align capacity expansions with battery-metal hubs and copper belts.
The Dyno Nobel demerger from Incitec Pivot, approved by shareholders in December 2024, illustrates a wider industry trend towards focused pure-play explosives operators. Investors are rewarding companies that allocate capital and management attention exclusively to mining and industrial explosives, supported by clearer recontracting strategies and technology adoption. Combined with Orica's USD 1 billion-plus acquisitions of Cyanco and Terra Insights, the trend is consolidating capabilities in fewer, larger, more vertically integrated explosives platforms with stronger digital, sustainability, and customer-service propositions across North America, Asia Pacific, and Latin America.
Sustainable bulk emulsion explosives, including reduced-NOx and hydrogen-derived ammonium nitrate formulations, are moving from pilot to mainstream deployment. Dyno Nobel's January 2024 reduced-NOx emulsion launch and Orica's hydrogen-based TAN milestones illustrate the direction of travel, supported by customer ESG mandates and tightening air-quality standards in jurisdictions such as Australia, Canada, and Chile. The trend is creating a new premium tier of sustainable blasting products and reshaping customer procurement scorecards, with carbon footprint and post-blast fume performance increasingly weighted alongside cost and productivity.
The Expert Market Research's report titled “Global Explosives Market Report and Forecast 2026-2035” offers a detailed analysis of the market based on the following segments:
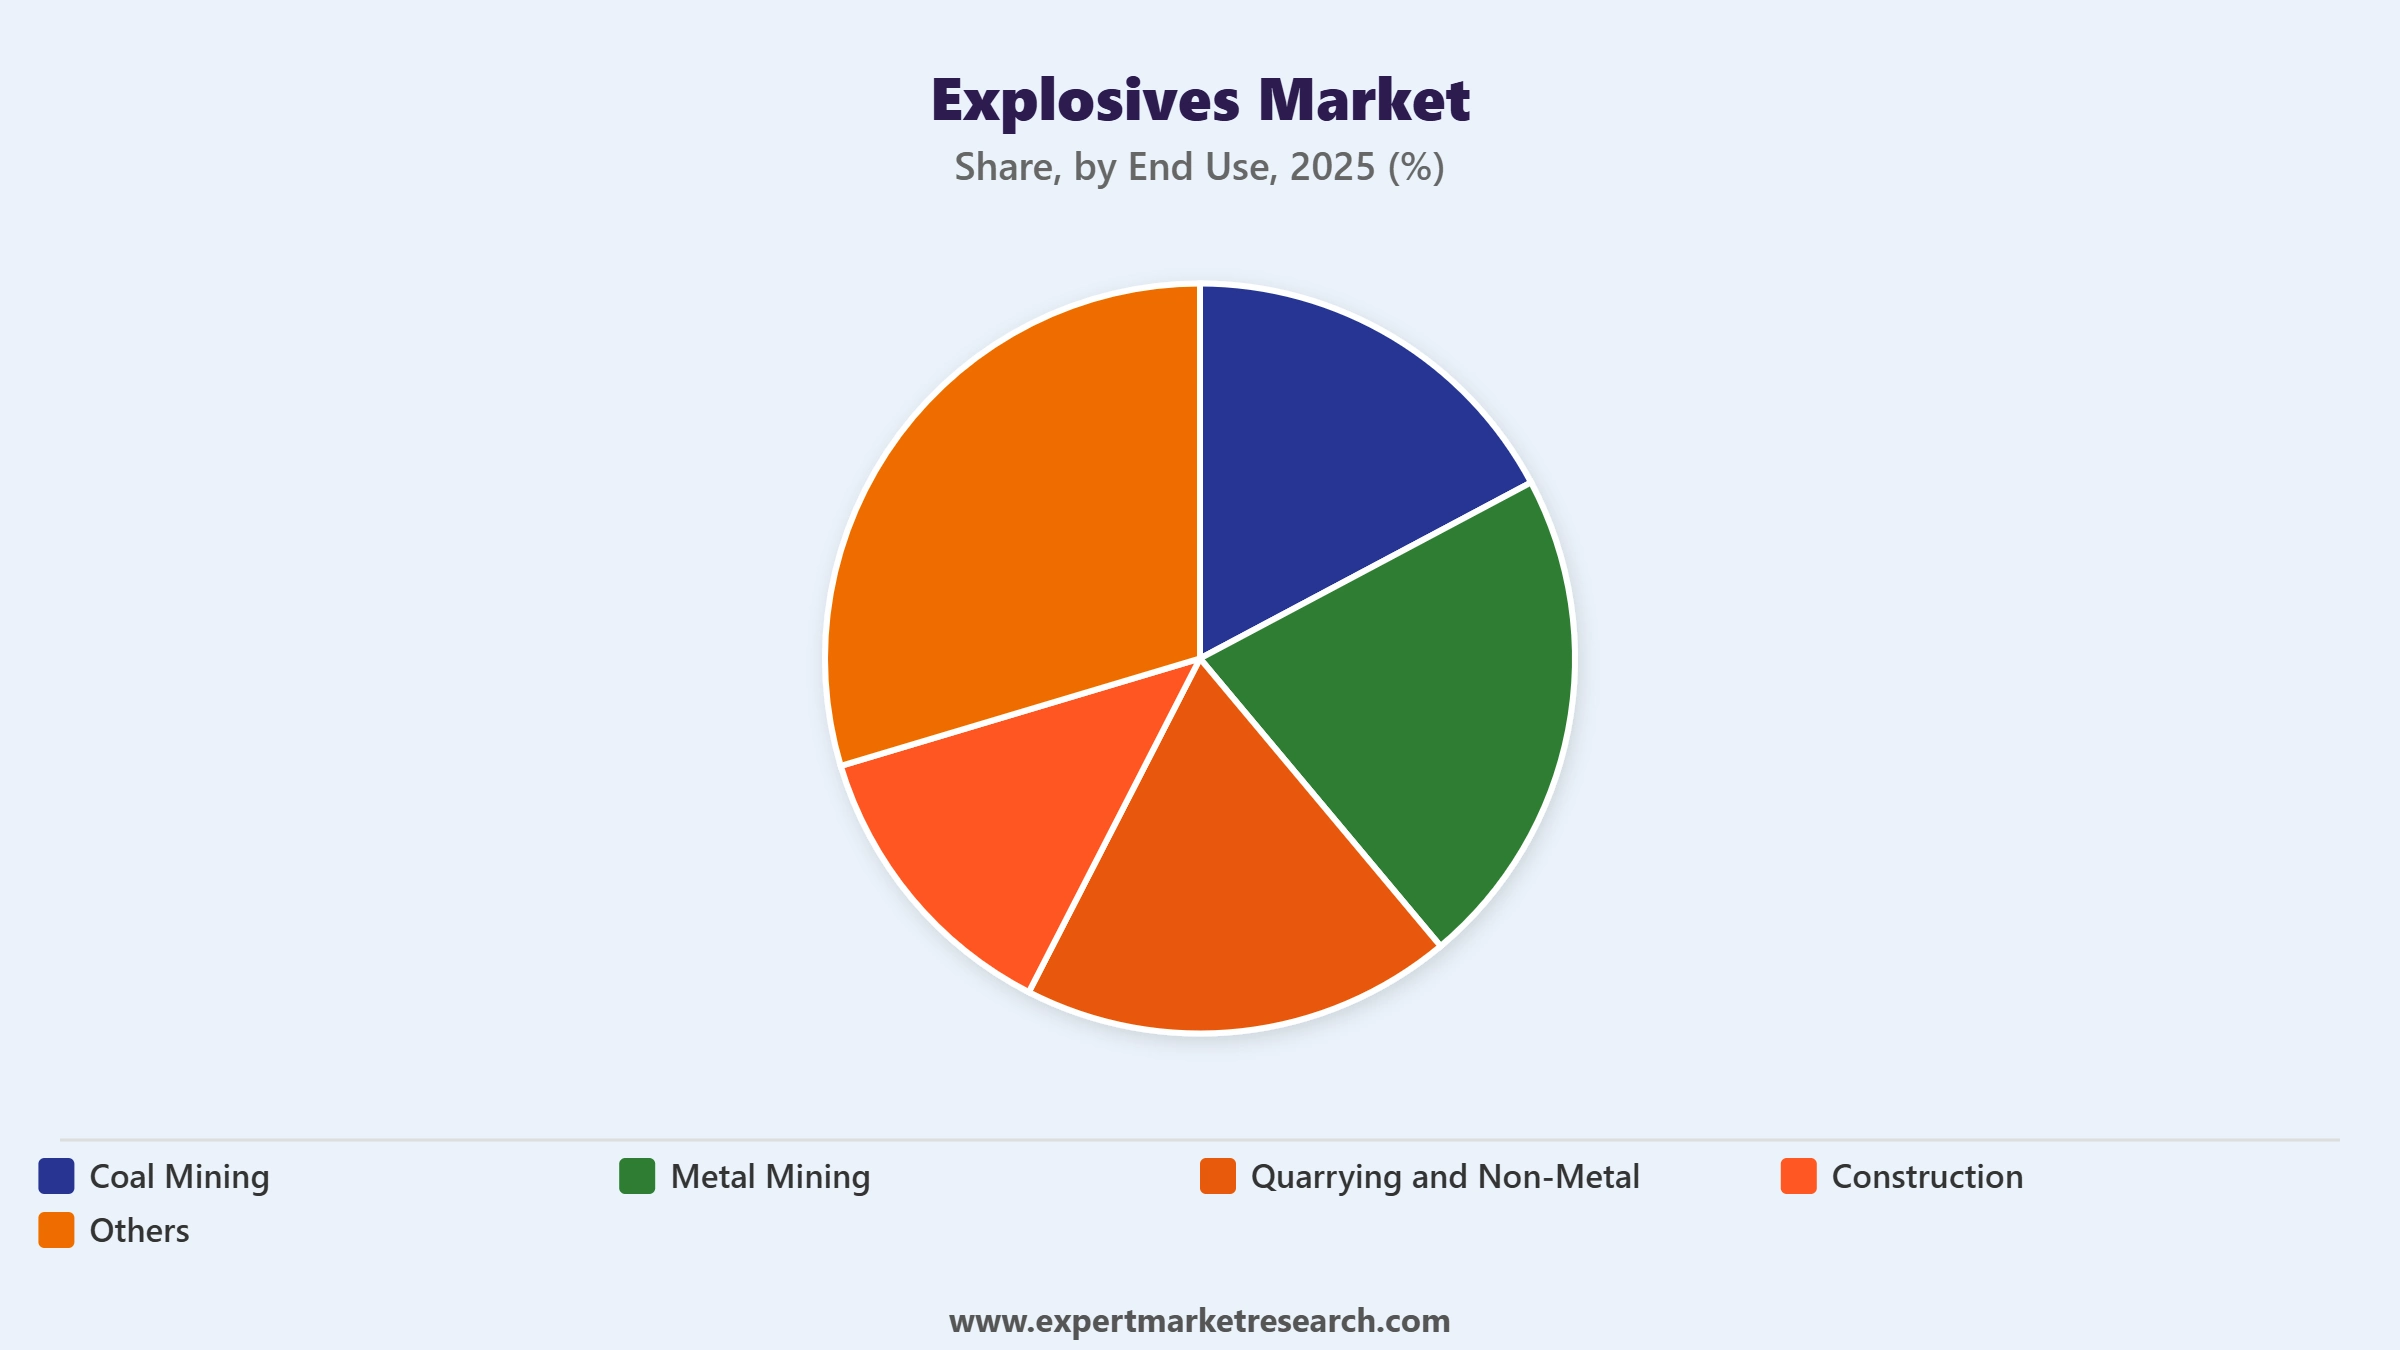
Market Breakup by End Use
Key Insight: Coal Mining remains a dominant end-use as global energy demand continues to support coal volumes in China, India, and parts of Southeast Asia, sustaining bulk explosives consumption. Metal Mining is the strongest growth contributor, anchored by demand for copper, lithium, gold, and rare earths critical to the energy transition. Quarrying and Non-Metal demand is expanding alongside aggregates and cement production for infrastructure programmes, while Construction blasting is driven by tunnelling, road building, and large-scale civil works in Asia, Africa, and the Middle East. Top players including Orica Limited, Dyno Nobel, Enaex, and Maxam are tailoring formulations and digital services to each end-use vertical.
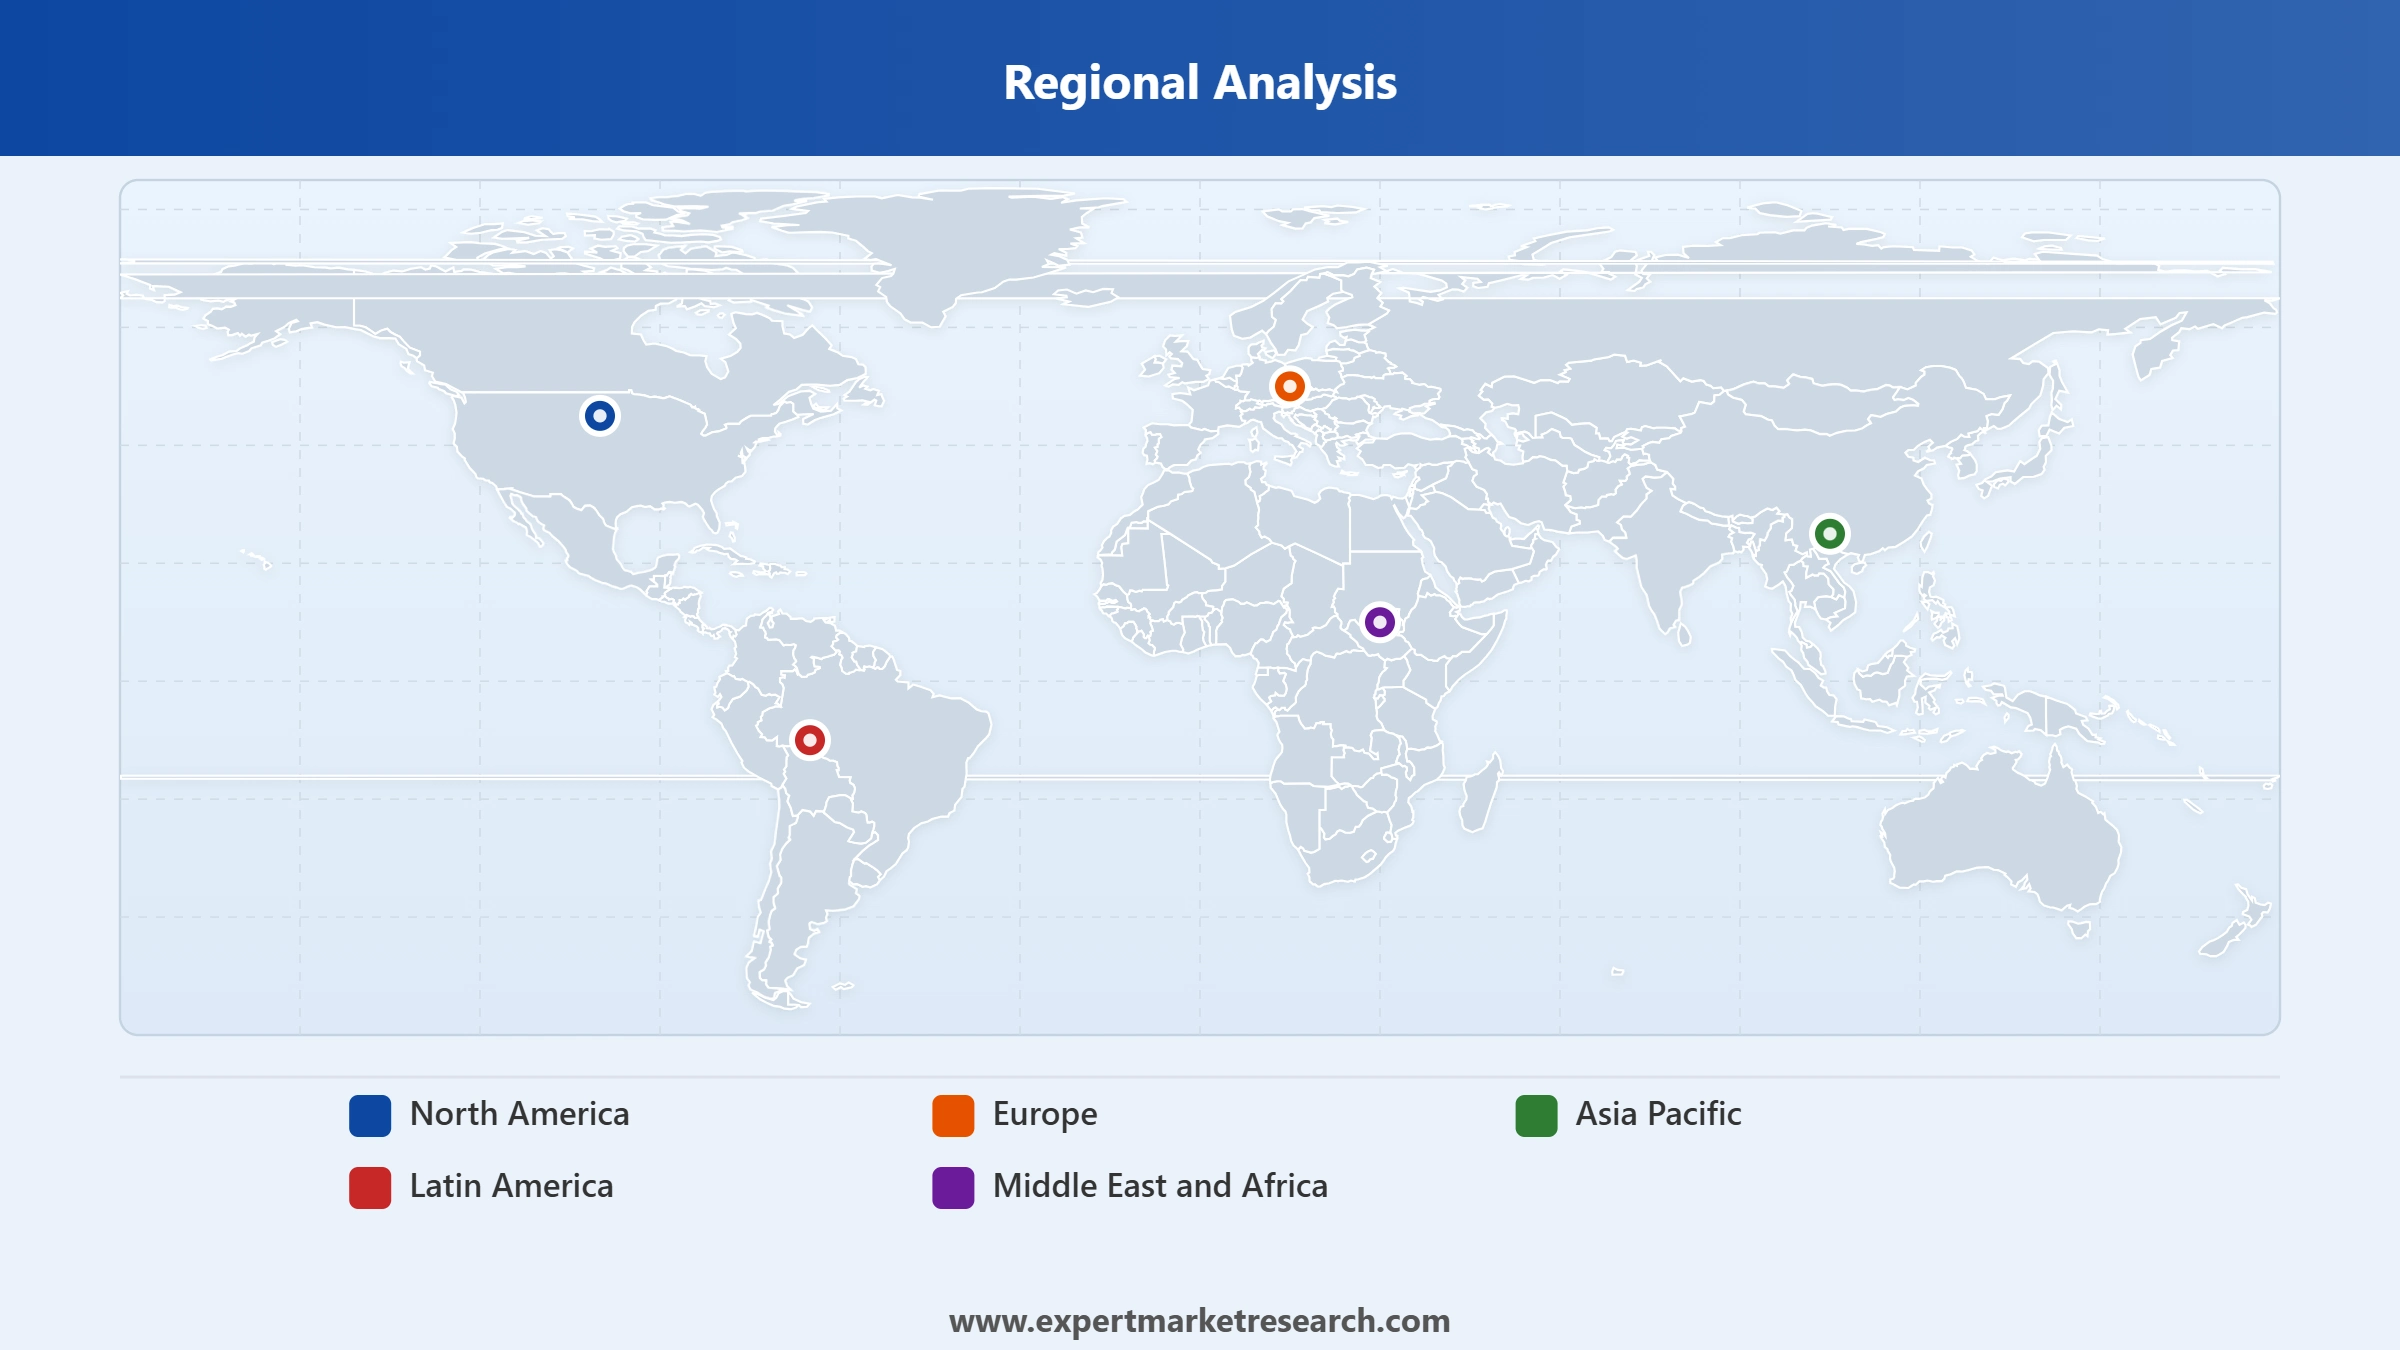
Market Breakup by Region
Key Insight: Asia Pacific leads the market with around 45-48% of global volume in 2025, driven by China's coal and metal mining base, Australia's iron ore, gold, and lithium operations, and India's expanding coal sector. Latin America is the fastest-growing region with explosives volume of approximately 1.56 MMT in 2025 and a forecast CAGR of 5.20%, anchored by copper and lithium expansions in Chile, Peru, and Argentina. Middle East and Africa is benefiting from gold, copper, and platinum mining expansions, supported by new local production such as the planned Saudi Ras Al Khair TAN plant. North America and Europe represent stable, technology-led markets dominated by Orica and Dyno Nobel.


Read more about this report - REQUEST FREE SAMPLE COPY IN PDF
Within the End Use segmentation, Coal Mining and Metal Mining capture the largest share of demand. Coal Mining historically dominates volumes thanks to extensive surface and underground operations in China, India, Indonesia, and parts of the United States, where bulk explosives are essential to access coal seams and overburden. Metal Mining, however, is the strategic growth engine, fuelled by structurally rising demand for copper, gold, and battery-grade lithium tied to the energy transition. Each new copper porphyry, lithium spodumene, or rare-earth project triggers multi-year ammonium nitrate and emulsion offtake, with companies such as Orica Limited, Enaex S.A., and Dyno Nobel closely aligning capacity expansions with these high-growth metal mining hubs.
Read more about this report - REQUEST FREE SAMPLE COPY IN PDF
Within the Region segmentation, Asia Pacific and Latin America are the most influential. Asia Pacific accounts for approximately 45-48% of global explosives volume in 2025, anchored by China's mining output, Australia's bulk operations, and India's growing coal demand. Latin America, with around 1.56 MMT in 2025 and a 5.20% CAGR, is the fastest-growing region as Chile, Peru, Argentina, and Brazil expand copper, lithium, and gold output to meet clean-energy supply needs. Recent moves such as Orica's Latin America investments and Enaex's leadership in low-density ammonium nitrate via its Prillex America complex underscore why these two regions anchor the global supplier playbook.
Within the Initiation Type lens, bulk products lead by volume while digital electronic detonators set the growth narrative for the Global Explosives Market. Bulk explosives such as ANFO and pumpable emulsions captured around 65.12% of mining explosives spending in 2025, reflecting their cost efficiency in high-volume surface operations. Electronic detonators, with 39.38% of initiation segment share in 2025 and a 4.28% CAGR through 2031, offer programmable timing, lower misfires, and improved fragmentation. Suppliers including Orica, Dyno Nobel, and Maxam are competing increasingly on the depth of their digital initiation portfolios, software platforms, integrated services, and customer training programmes rather than purely on chemical product economics.
Asia Pacific is the leading regional market, holding roughly 45-48% of global explosives volume in 2025, anchored by China's vast coal mining base, Australia's iron ore, gold, and lithium operations, and India's expanding coal and metal mining footprint. Chinese technical-grade ammonium nitrate exporters supply mining hubs across Africa and Latin America, reinforcing the region's pivot to a global swing supplier. Major projects in Indonesia, the Philippines, and Vietnam are driving metal mining demand, while Australia continues to scale large-scale battery-metal operations. Recent moves such as Dyno Nobel's pure-play repositioning and ongoing investments by Orica are sharpening competitive positioning across this volume-dominant region.
Read more about this report - REQUEST FREE SAMPLE COPY IN PDF
Latin America is the fastest-growing region, with explosives volumes of approximately 1.56 MMT in 2025 and a forecast CAGR of 5.20% through 2035. The growth reflects rising mining activity for copper and lithium across Chile, Peru, and Argentina, alongside Brazilian iron ore and Mexican gold-silver expansions. Major players such as Enaex S.A. lead through their Prillex America ammonium nitrate complex, while Orica's earlier Exsa acquisition expanded its Latin American footprint. Foreign direct investment continues to flow into copper, gold, and lithium projects, with international miners committing to multi-year offtake agreements with explosives suppliers, creating durable backlog and reinforcing the region's strategic importance.
The Global Explosives Market is highly consolidated at the top end, with Orica Limited, Dyno Nobel Inc., Maxam, Enaex S.A., and Austin Powder Company setting the competitive pace through targeted acquisitions, sustainable product launches, and digital initiation systems. Industry leaders compete on integrated mining services, digital platforms, sustainable chemistry, and global supply reliability.
Recent strategic moves include Orica's USD 1 billion-plus acquisitions of Cyanco and Terra Insights, the Dyno Nobel demerger from Incitec Pivot, and Saudi Arabia's first technical-grade ammonium nitrate facility. Yara International ASA and Sasol Limited remain important ammonium nitrate suppliers serving downstream explosives chains, while Maxam's global manufacturing footprint and Austin Powder's North American services capability anchor regional positions. The competitive landscape continues to consolidate as scale, technology, sustainability, and customer-service breadth become decisive factors.
Founded in 1874 and headquartered in Melbourne, Australia, Orica Limited is the world's largest commercial explosives and blasting systems supplier. Its February 2024 acquisitions of Cyanco for USD 640 million and Terra Insights for USD 377 million expanded its sodium cyanide capacity and digital monitoring portfolio, reinforcing leadership across mining services.
Originally founded in 1865 in Norway and now headquartered in Salt Lake City, USA following its December 2024 demerger from Incitec Pivot, Dyno Nobel is a pure-play explosives provider serving mining and quarrying customers across North America, Australia, and Asia Pacific with bulk emulsions, packaged products, and electronic detonators.
Founded in 1920 and headquartered in Santiago, Chile, Enaex S.A. is a Sigdo Koppers subsidiary and one of the world's largest low-density ammonium nitrate producers. It owns the Prillex America complex, the world's largest ammonium nitrate facility, and operates extensive blasting service plants across Latin America for copper, gold, and iron ore mining customers.
Founded in 1872 and headquartered in Madrid, Spain, MaxamCorp Holding is a global explosives manufacturer serving mining, quarrying, and construction customers across more than 50 countries. It produces bulk emulsions, packaged explosives, ammonium nitrate, electronic detonators, and integrated blasting services for surface and underground operations worldwide.
Other key players in the market are Yara International ASA, Austin Powder Company, Sasol Limited, and Others.
*Please note that this is only a partial list; the complete list of key players is available in the full report. Additionally, the list of key players can be customized to better suit your needs.*
Discover the latest insights on the Global Explosives Market 2026 with our comprehensive report. Stay ahead of the curve with valuable data on bulk emulsion innovations, electronic detonator adoption, and top growth regions. Whether you are scaling mining operations, launching a new sustainable explosive line, or expanding regional supply, this report gives you the clarity you need. Download your free sample now and discover the key opportunities in the thriving Global Explosives industry.
Middle East and Africa Explosives Market
Latin America Explosives Market
Upto 15% Off
USD
$2499 $2249
$3999 $3599
$4999 $4249
$5999 $5099


*While we strive to always give you current and accurate information, the numbers depicted on the website are indicative and may differ from the actual numbers in the main report. At Expert Market Research, we aim to bring you the latest insights and trends in the market. Using our analyses and forecasts, stakeholders can understand the market dynamics, navigate challenges, and capitalize on opportunities to make data-driven strategic decisions.*
In 2025, the market reached an approximate volume of 17.44 MMT.
The market is projected to grow at a CAGR of 5.20% between 2026 and 2035.
The market is estimated to witness healthy growth in the forecast period of 2026-2035 to reach a volume of around 28.95 MMT by 2035.
Key strategies driving the market include developing eco-friendly and smart explosives, expanding production capacity to meet mining and defence demand, strengthening supply chain resilience through partnerships, and enhancing customer engagement with tailored solutions. Innovation and regional expansion remain critical to addressing safety, regulatory, and market growth challenges globally.
The key trends guiding the growth of the explosives market include the growth opportunities of battery materials, like lithium and cobalt, and increasing demand from the construction industry.
The major regions in the market are North America, Latin America, the Middle East and Africa, Europe, and the Asia Pacific.
The major end uses of explosives in the market are coal mining, metal mining, quarrying and non-metal, and construction, among others.
The key players in the market report include Enaex S.A., Yara International ASA, Orica Limited, MaxamCorp. Holding, S.L., Austin Powder Company, Sasol Limited, and Dyno Nobel Inc, among others.
Asia Pacific dominates the market led by high-volume mining activities in China, Australia, and India, which use bulk explosives extensively in coal and metal extraction.
Explore our key highlights of the report and gain a concise overview of key findings, trends, and actionable insights that will empower your strategic decisions.
| Report Features | Details |
| Base Year | 2025 |
| Historical Period | 2019-2025 |
| Forecast Period | 2026-2035 |
| Scope of the Report |
Historical and Forecast Trends, Industry Drivers and Constraints, Historical and Forecast Market Analysis by Segment:
|
| Breakup by End Use |
|
| Breakup by Region |
|
| Market Dynamics |
|
| Competitive Landscape |
|
| Companies Covered |
|
| Report Price and Purchase Option | Explore our purchase options that are best suited to your resources and industry needs. |
| Delivery Format | Delivered as an attached PDF and Excel through email, with an option of receiving an editable PPT, according to the purchase option. |
Datasheet
One User
USD 2,499
USD 2,249
tax inclusive*
Single User License
One User
USD 3,999
USD 3,599
tax inclusive*
Five User License
Five User
USD 4,999
USD 4,249
tax inclusive*
Corporate License
Unlimited Users
USD 5,999
USD 5,099
tax inclusive*
*Please note that the prices mentioned below are starting prices for each bundle type. Kindly contact our team for further details.*
Flash Bundle
Small Business Bundle
Growth Bundle
Enterprise Bundle
*Please note that the prices mentioned below are starting prices for each bundle type. Kindly contact our team for further details.*
Flash Bundle
Number of Reports: 3
20%
tax inclusive*
Small Business Bundle
Number of Reports: 5
25%
tax inclusive*
Growth Bundle
Number of Reports: 8
30%
tax inclusive*
Enterprise Bundle
Number of Reports: 10
35%
tax inclusive*
How To Order

Select License Type
Choose the right license for your needs and access rights.

Click on ‘Buy Now’
Add the report to your cart with one click and proceed to register.

Select Mode of Payment
Choose a payment option for a secure checkout. You will be redirected accordingly.
Strategic Solutions for Informed Decision-Making
Gain insights to stay ahead and seize opportunities.

Get insights & trends for a competitive edge.

Track prices with detailed trend reports.

Analyse trade data for supply chain insights.

Leverage cost reports for smart savings

Enhance supply chain with partnerships.

Connect For More Information
Our expert team of analysts will offer full support and resolve any queries regarding the report, before and after the purchase.
Our expert team of analysts will offer full support and resolve any queries regarding the report, before and after the purchase.
We employ meticulous research methods, blending advanced analytics and expert insights to deliver accurate, actionable industry intelligence, staying ahead of competitors.
Our skilled analysts offer unparalleled competitive advantage with detailed insights on current and emerging markets, ensuring your strategic edge.
We offer an in-depth yet simplified presentation of industry insights and analysis to meet your specific requirements effectively.


