

Consumer Insights
Uncover trends and behaviors shaping consumer choices today
Procurement Insights
Optimize your sourcing strategy with key market data
Industry Stats
Stay ahead with the latest trends and market analysis.


The Gulf Cooperation Council activated carbon market attained a value of USD 252.72 Million in 2025 and is projected to expand at a CAGR of 13.00% through 2035. The market is further expected to achieve USD 857.88 Million by 2035. Construction of wastewater reuse plants, tighter adherence to emissions standards by industries, and the need for refinery purification are among the key factors driving the demand for activated carbon.
Saudi Arabia's continued commitment to expanding desalination and wastewater treatment infrastructure under Vision 2030 reinforced the Kingdom's position as the largest activated carbon consumer in the GCC, accounting for over 38% of regional demand. Bloomberg reported that ongoing build-outs of municipal water treatment plants and petrochemical complex air purification systems across Riyadh, Jubail and Yanbu have driven sustained orders for granular and powdered activated carbon from international suppliers and emerging regional producers.
Dubai and Abu Dhabi continued to expand sewage treatment capacity to address rapid urban growth and high per-capita water consumption, sustaining demand for activated carbon used in organic chemical adsorption applications. According to Reuters, the United Arab Emirates' increased reliance on treated wastewater reuse, alongside Qatar's recycling of approximately 24% of freshwater annually, has reinforced the GCC's position as a strategically important regional market for water and wastewater treatment-grade activated carbon products.
There are two primary factors propelling the growth of the Gulf Cooperation Council activated carbon market. The first factor is the rising demand for both granular and powdered activated carbons within the desalination projects and municipal wastewater treatment plants of the GCC countries. Another contributing factor is the increasing use of high-quality adsorption materials in petrochemical applications, including sulfur removal, mercury control, and gas purification.
Factors like increasing investments in industrial decarbonization and water purification have a significant impact on the Gulf Cooperation Council activated carbon market, especially with the growth of local producers’ filtration capacities. Companies like Jacobi Carbons are putting more emphasis on developing high-quality activated carbon products for use in air filters and industrial and drinking water purification. For example, in May 2026, Con-Air expanded Clorox air filtration portfolio with carbon-enhanced HVAC filters, improving air purification and odor control. Such an approach is highly relevant for GCC customers, given that desalination is still their primary concern. According to reports, Saudi Arabia consumes roughly 7 billion/m3 of water every day, of which 60% is desalinated water.
The continuous demand in the Gulf Cooperation Council activated carbon market is driven by regulations concerning wastewater recycling, industrial process safety, and emission control in petrochemical applications. For example, in December 2023, Petro Rabigh inaugurated a carbon capture and utilization facility, advancing emission reduction and sustainable industrial processing. The expansion of adsorptive processes among refinery operators, gas processing plants, and municipalities can also be attributed to the stringent requirements under the environmental framework.
Compound Annual Growth Rate
13%
Value in USD Million
2026-2035
Read more about this report - REQUEST FREE SAMPLE COPY IN PDF
Global Carbon Council and TERI launched India’s first digital carbon exchange platform, making carbon trading more transparent, sustainable, and promoting decarbonization within industries. Such innovations present opportunities for companies in the Gulf Cooperation Council activated carbon market to incorporate themselves into carbon-centric filtration and sustainable industrial solutions.
Kemira made the decision to invest in an activated carbon reactivation plant, thus supporting circular economy practices and sustainable recycling of filtration materials. Such advancements provide chances for other companies to extend their reactivation plants and benefit from recycled activated carbon.
The use of Carbon Clean improved carbon capture innovations, enabling industrial emission reductions and scalable purification technology. Such developments in the Gulf Cooperation Council activated carbon market allow companies to create innovative ways of using activated carbon for carbon capture and purification purposes.
Sulzer made great advancements in carbon capture innovations in the GCC region, enhancing efficiency and sustainability practices, and improving the ability to treat emissions. Such advances show potential investment opportunities in activated carbon technology and environmental development in the GCC.
Water security continues to be an important driver for the Gulf Cooperation Council activated carbon market growth. Countries like Saudi Arabia, UAE, and Oman are implementing more desalination and wastewater reclamation schemes that necessitate effective adsorbent materials in their pre-filtration and polishing processes. Activated carbon is increasingly being chosen for chlorine removal, organic substance elimination, and deodorization applications. Programs supported by governments for circular water systems are enhancing procurement opportunities for suppliers. For example, in November 2025, Saudi Water Authority partnered with Ebb Carbon to launch desalination-based carbon removal, advancing water sustainability and emissions reduction.
There is an increasing demand for activated carbon owing to its suitability in the refinery and petrochemical industry of the GCC region. Industrial facilities in the region need adsorbent media in their gas purification and sulfur and hydrocarbon vapor treatments as well as mercury abatement processes. Both Saudi Arabia and Kuwait are promoting cleaner processes of operations, boosting the use of high-performance impregnated and pelletized carbon. Aligning with this trend in the Gulf Cooperation Council activated carbon market, in July 2025, KAPSARC launched a direct air capture testing unit, advancing carbon removal innovation and industrial decarbonization research.
The Gulf Cooperation Council activated carbon market is being driven by specifications rather than volumes. Specifications are emerging for activated carbon grades intended for purposes of consistency and purity in pharmaceuticals, food processing, and specialty chemical applications. Technical services are being extended by GCC distributors, along with specialization in application-oriented supply models. Powdered activated carbon use is rising in liquid purification applications, whereas extruded carbon is becoming popular in air purification processes across industrial applications. Pore size optimization and adsorption efficiency are becoming the key areas of product differentiation. For example, in December 2024, Cleanova launched advanced carbon capture filtration technology, improving industrial emissions control, filtration efficiency, and sustainable processing capabilities.
Sustainable filtration techniques influence future purchasing decisions, redefining the Gulf Cooperation Council activated carbon market dynamics. The trend towards regenerated carbon is expected to continue since there is pressure from GCC industries to minimize waste production and cost. The reuse of filtration systems is considered cost-effective across water treatment, mining, and various industrial applications. Suppliers are now looking into opportunities for regenerated carbon and service contracts while reducing import dependency. In January 2026, Birchtech demonstrated utility-validated carbon rejuvenation, delivering performance comparable to virgin activated carbon with sustainability benefits.
Supply chain resilience is increasingly emerging as a competitive advantage in the Gulf Cooperation Council activated carbon market. Buyers are becoming more concerned with the provision of shorter lead time, technological assistance, and availability of stock. The importers of the activated carbon are now concentrating on developing their warehousing capabilities in Saudi Arabia and the UAE to ensure that they minimize procurement problems. This is because water utility companies and refineries require regular and constant maintenance procedures. In October 2025, Sirona launched Project Moringa in Oman, advancing CO2 capture, storage infrastructure, and regional decarbonization efforts.
The Expert Market Research's report titled “Gulf Cooperation Council Activated Carbon Market Report and Forecast 2026-2035” offers a detailed analysis of the market based on the following segments:
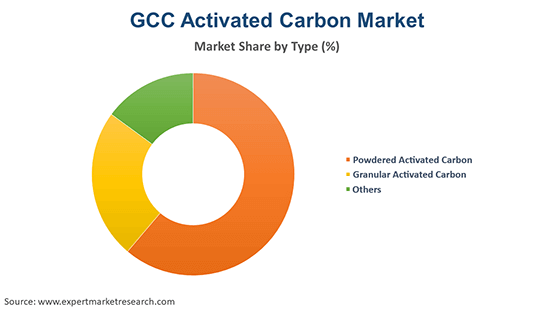
Market Breakup by Products
Key Insight: The powdered activated carbon, the granular activated carbon, and other specialty carbon are aligned with varying industrial needs within the GCC. Granular activated carbon takes the lead in the Gulf Cooperation Council activated carbon market scope because of better possibilities for regeneration, mechanical durability, and suitability for industrial filtration processes requiring extended periods of operation. Powdered activated carbon is growing more popular because of the capability for quick changes in treatment process, liquid filtration, and rapid cycle absorption processes. Other segments such as the extruded and impregnated activated carbon continue to be popular for gas phase filtration and odor control applications.
Market Breakup by Application
Key Insight: Both liquid-phase and gas-phase applications influence the technological demand configuration for activated carbon in the GCC. Liquid-phase applications are driving the growth of the Gulf Cooperation Council activated carbon market due to the increasing need for stable impurity removal in processes such as water desalination, water reuse, food purification, and chemical manufacturing. For example, Rashtriya Chemicals and Fertilizers launched a 100 MTPD liquid CO2 plant, expanding industrial gas capacity in September 2025. Gas phase applications include refinery treatments, air purification, odor removal, and vapor handling. Purchasing decisions are influenced by the adsorptive capacity, impurity types, gas flow dynamics, and filtration cycle among other variables.
Market Breakup by End Use
Key Insight: Water purification application dominates the Gulf Cooperation Council activated carbon market since filtration stability and purification are critical considerations in all cases. In April 2024, Organic Recycling Systems unveiled GAC-01 water treatment solution, improving activated carbon applications and sustainable wastewater purification. Refining processes involve gas purification, sulfur removal, and contaminant adsorption. In food and beverage industries, activated carbon is used for purification purposes due to its ability to decolorize the water and improve the efficiency of the process. The pharmaceuticals industry requires controlled adsorption and removal of contaminants. In air purification applications, demand is increasing due to the growing need for vapor control and odor removal. On the other hand, activated carbon is used in sewage treatment as tertiary treatment and contamination removal.
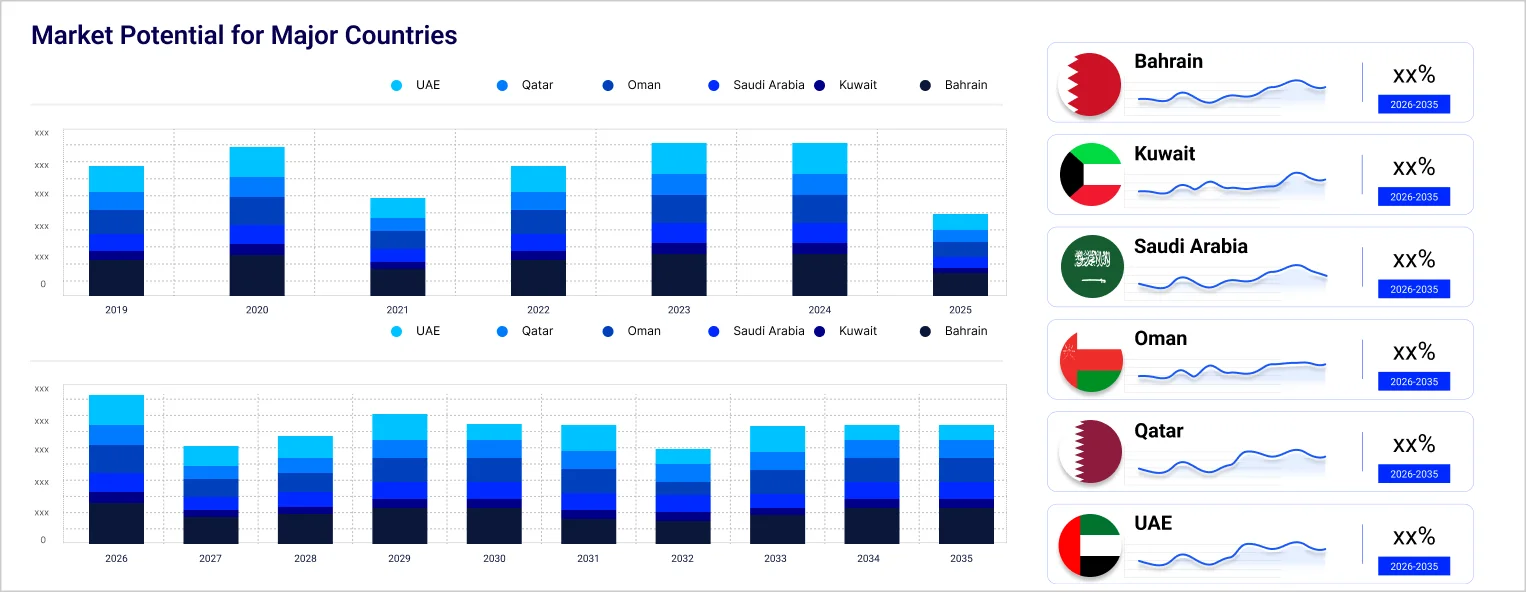
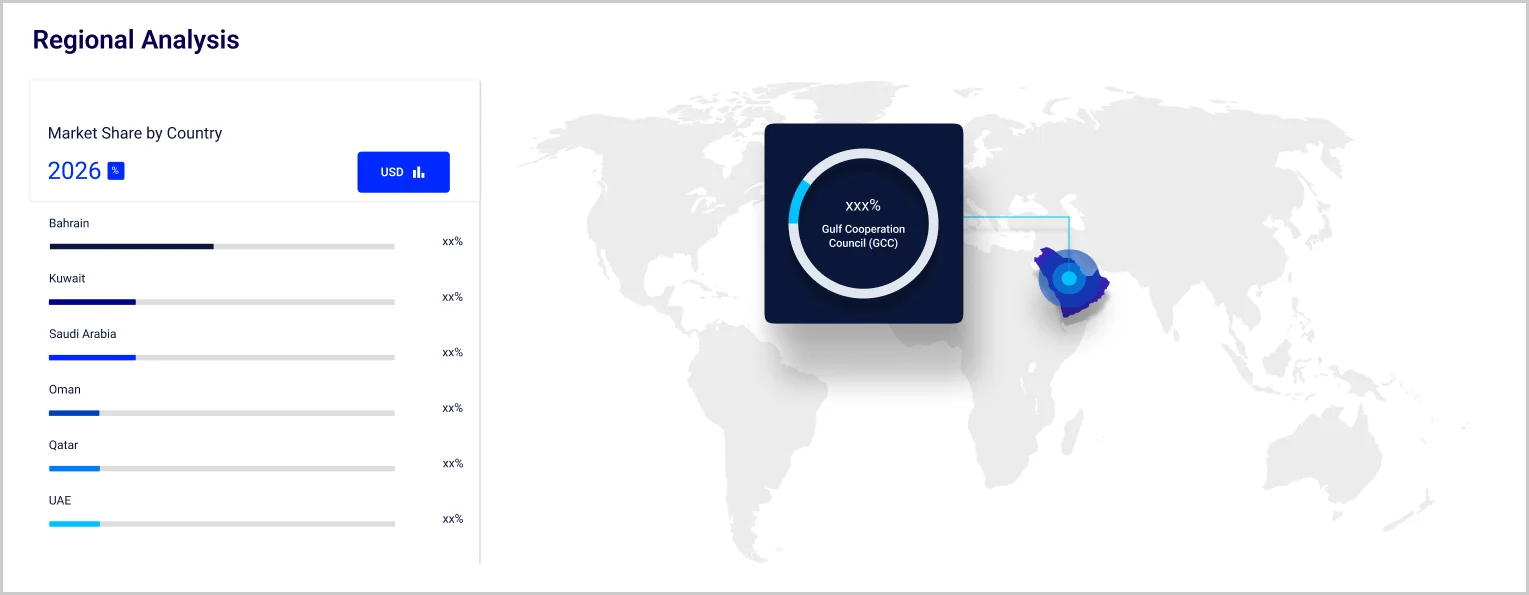
Market Breakup by Region
Key Insight: Saudi Arabia continues to be the dominant regional Gulf Cooperation Council activated carbon market due to deep refinery, water treatment dependence, and widespread industrial consumption. The United Arab Emirates (UAE) continues to experience rapid growth due to manufacturing diversification, energy sector developments, and filtration requirements for technical use. Kuwait promotes the use of activated carbon in its refineries, industry purification processes, and gas treatment operations. Other markets comprising Oman, Bahrain, and Qatar make their contribution through wastewater treatment, petrochemicals, and industrial filtration. Adoption in each nation is driven by factors like industrialization, infrastructure development, logistics, and purifying needs.
Read more about this report - REQUEST FREE SAMPLE COPY IN PDF
By product, granular activated carbon registers notable growth due to strong industrial filtration durability
Granular activated carbon dominates the overall Gulf Cooperation Council activated carbon market value owing to the superior strength of durability, reuse, and better consistency of adsorption in industrial filtration systems. Water purification plants, oil refinery operations, and gas purifying processes favor this segment for their lower pressure drop and higher service life expectancy. It operates well in fixed-bed filtration processes for purposes such as chlorine removal, organic compound adsorption, and vapor adsorption. In August 2025, ARQ achieved a major milestone by commissioning its first facility, expanding carbon-based material production capabilities.
Powdered activated carbon continues to observe fast-paced growth rate due to its versatility in liquid phase treatments and efficiency in adsorption performance. Wastewater purification plants, chemicals processing industries, and food purification systems frequently use powdered activated carbon for treating contamination and decolorizing. The powdered form provides better surface interaction, which facilitates its effectiveness in dosage treatment.
By application, liquid phase accounts for the leading market share owing to desalination and wastewater purification needs
Liquid phase applications continue to dominate the Gulf Cooperation Council activated carbon market owing to the significance of purification of water in desalination-oriented economies. There are various applications of activated carbon such as municipal water treatment, reuse of wastewater, beverage purification, and chemicals purification. In addition, activated carbon facilitates purification by removing organics in solution form, odor, chlorinated contaminants, and any process contaminants.
The gas phase records a faster rate of growth compared to other phases owing to rising demands for air purification, purification of industrial gases, and refinery-based gas purification. There are many applications of activated carbon in the gas phase segment like sulfur management, hydrocarbon adsorption, mercury removal, and VOCs reduction. In March 2025, Aramco launched Saudi Arabia’s first direct air capture test unit, advancing carbon removal and decarbonization.
By end use, the water treatment category secures the leading market position due to desalination and reuse of infrastructure reliance
The water treatment category largely contributes to the Gulf Cooperation Council activated carbon market revenue, as emerging economies increasingly depend on desalination, wastewater recycling, and water purification applications. Activated carbon is becoming critical in applications such as chlorine elimination, odor elimination, adsorption of organics, and filtration polishing. As municipal and industrial players continue to seek high-performance filtration systems, the segment continues to benefit from strong replacement demand and reliance on long-term infrastructure. High level of compatibility with liquid purification systems makes activated carbon significant in municipal utility and industrial water treatment processes.
The fastest-growing end-use application segment in the Gulf Cooperation Council activated carbon market is represented by the air purification category owing to an increasing need by industrial companies to ensure enclosed air quality and odors, and vapor phase contaminants. Activated carbon is deployed in applications including HVAC, scrubbing, and filtration systems. In industrial petrochemicals, medical settings, and manufacturing applications, there is a need to remove volatile organic compounds, chemicals, and odors. Buyers are deploying improved filtration equipment systems to improve plant safety and facilitate more efficient processing. For example, in April 2023, Acerpure debuted an eco-conscious air purifier made with PCR materials, supporting sustainability and improved indoor air quality.
Read more about this report - REQUEST FREE SAMPLE COPY IN PDF
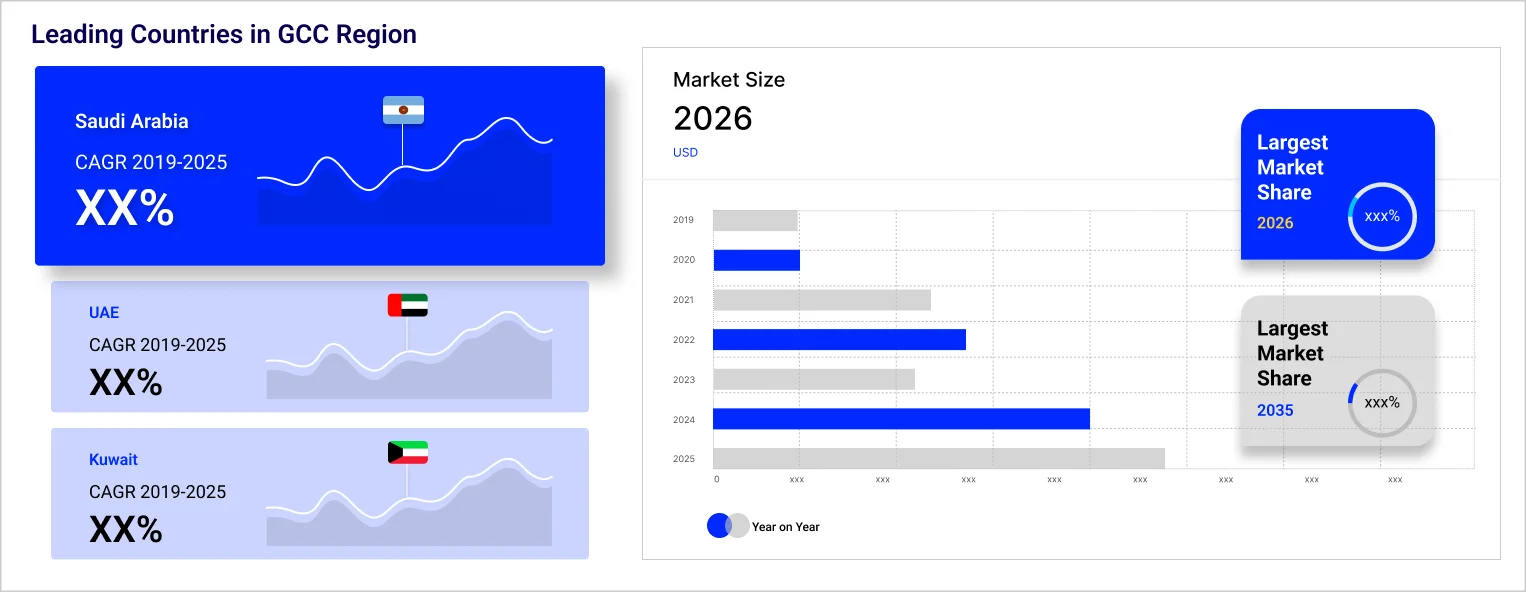
Saudi Arabia clocks in a substantial share of the market through refinery scale and water treatment intensity
Saudi Arabia is positioned at the center of the Gulf Cooperation Council activated carbon market because of the region’s well-developed refinery sector, reliance on desalination for drinking water purposes, wastewater treatment, and extensive industrial activities. There is high demand for activated carbon in the petrochemical industry, power generation and treatment, gas purification, and process filtration. Moreover, the widespread industrial operations in Saudi Arabia is resulting in a consistent demand for adsorption systems and regeneration-ready carbon products. In January 2026, Haycarb showcased sustainable water treatment solutions at IFAT Saudi Arabia 2026, strengthening activated carbon innovation and purification.
The UAE represents the fastest developing market among the GCC countries. The region is powered by the growth of industrial diversity, production of high-purity goods, and infrastructure development in terms of water purification and treatment. Currently, activated carbon is employed in the air purification system, wastewater recycling facilities, food-processing plants, and other specialized filtration units. Moreover, the country records growth through advanced logistics services, which contribute to the technical distribution of adsorption equipment and easy access to foreign-made carbon products.
The market is becoming more technology oriented as Gulf Cooperation Council activated carbon companies are concentrating more on filtration accuracy, regeneration effectiveness, and customized adsorption systems rather than basic bulk carbon supply. Major firms are focusing on refinery purification, water re-use systems, decontamination of gases, and odor elimination where long-lasting carbon is required.
A major opportunity for leading Gulf Cooperation Council activated carbon market players lies in the growing demand for specialized activated carbon used in desalination-based water purification, industrial air purification, and VOC management applications. An increased emphasis on enhancing impregnated and pelletized carbon offerings for sulfur and mercury removal at petrochemical sites is expected over the forecast period. Buyers are looking for suppliers who can offer reliable products as well as engineering expertise, technical consulting, and compatibility for regeneration purposes. Localized storage and faster distribution within Saudi Arabia and the UAE represent another significant opportunity.
Advanced Emissions Solutions, Inc was founded in 1997 in Colorado, United States, and specializes in offering activated carbon for the GCC market through its specialty adsorbents and emission-driven carbon technology. The company is renowned for its provision of services aimed at addressing industrial air purification as well as mercury reduction applications. Its focus on performance-based activated carbon enables it to serve utilities, industrial processors, and other emissions applications.
Founded in 2005 and headquartered in Gujarat, India, Boyce Carbon offers activated carbon from coconut shells while addressing water purification, gold recovery, and industrial purification purposes. The company focuses on providing granular, powdered, and pelletized carbon. Its ability to provide activated carbon in flexible forms enables the company to cater to a wide range of desalination-related applications.
Founded in 1882 and headquartered in Massachusetts, United States, Cabot Corporation is a leading player in the Gulf Cooperation Council activated carbon market. Its high-purity materials support air treatment, industrial adsorption, and various filtration processes. Additionally, its innovations in carbon materials enable controlled purification, vapor management, and advanced purification operations required across refineries and manufacturing facilities.
Founded in 1942 and headquartered in Pennsylvania, United States, Calgon Carbon Corporation provides activated carbon solutions for water purification, air purification, and industrial processing. Its activated carbon portfolio includes granular, powdered, and reactivated carbon products, along with regeneration and engineered adsorption solutions.
Other key players in the market include CarboTech AC GmbH, and CECA S.A, among others.
*Please note that this is only a partial list; the complete list of key players is available in the full report. Additionally, the list of key players can be customized to better suit your needs.*
Unlock the latest insights with our Gulf Cooperation Council activated carbon market trends 2026 report. Discover regional growth patterns, consumer preferences, and key industry players. Stay ahead of competition with trusted data and expert analysis. Download your free sample report today and drive informed decisions in the market.
Upto 15% Off
USD
$2499 $2249
$3999 $3599
$4999 $4249
$5999 $5099


*While we strive to always give you current and accurate information, the numbers depicted on the website are indicative and may differ from the actual numbers in the main report. At Expert Market Research, we aim to bring you the latest insights and trends in the market. Using our analyses and forecasts, stakeholders can understand the market dynamics, navigate challenges, and capitalize on opportunities to make data-driven strategic decisions.*
In 2025, the market reached an approximate value of USD 252.72 Million.
The market is expected to grow at a CAGR of 13.00% between 2026 and 2035.
The demand for activated carbon in the GCC region is driven by factors such as increasing industrialisation, strict environmental regulations, and growing awareness about water and air pollution.
Key trends influencing the growth of the activated carbon market globally include increasing demand for clean water, stringent environmental regulations, and growing industrialisation.
Different types of activated carbon products available include powdered activated carbon and granular activated carbon, among others.
The different applications are liquid phase and gas phase.
The key end-use industries driving the demand for activated carbon in the GCC region are water treatment, refinery, food and beverage processing, pharmaceuticals and medical, air purification, precious metal recovery, and sewage treatment, among others.
Regions considered in the market are Saudi Arabia, UAE, and Kuwait, among others.
Government and private organisations in the GCC countries are taking initiatives to control pollution using activated carbon, such as implementing strict emission standards, investing in renewable energy sources, and promoting the use of activated carbon in wastewater treatment plants.
GCC countries are investing in renewable energy sources like solar and wind power to mitigate climate change and reduce emissions, which is expected to impact the demand for activated carbon in the region.
Key players in the market are Advanced Emissions Solutions, Inc., Boyce Carbon, Cabot Corporation, Calgon Carbon Corporation [Kuraray], CarboTech AC GmbH, and CECA S.A., among others.
Explore our key highlights of the report and gain a concise overview of key findings, trends, and actionable insights that will empower your strategic decisions.
| REPORT FEATURES | DETAILS |
| Base Year | 2025 |
| Historical Period | 2019-2025 |
| Forecast Period | 2026-2035 |
| Scope of the Report |
Historical and Forecast Trends, Industry Drivers and Constraints, Historical and Forecast Market Analysis by Segment:
|
| Breakup by Product |
|
| Breakup by Application |
|
| Breakup by End Use |
|
| Breakup by Region |
|
| Market Dynamics |
|
| Competitive Landscape |
|
| Companies Covered |
|
| Report Price and Purchase Option | Explore our purchase options that are best suited to your resources and industry needs. |
| Delivery Format | Delivered as an attached PDF and Excel through email, with an option of receiving an editable PPT, according to the purchase option. |
Datasheet
One User
USD 2,499
USD 2,249
tax inclusive*
Single User License
One User
USD 3,999
USD 3,599
tax inclusive*
Five User License
Five User
USD 4,999
USD 4,249
tax inclusive*
Corporate License
Unlimited Users
USD 5,999
USD 5,099
tax inclusive*
*Please note that the prices mentioned below are starting prices for each bundle type. Kindly contact our team for further details.*
Flash Bundle
Small Business Bundle
Growth Bundle
Enterprise Bundle
*Please note that the prices mentioned below are starting prices for each bundle type. Kindly contact our team for further details.*
Flash Bundle
Number of Reports: 3
20%
tax inclusive*
Small Business Bundle
Number of Reports: 5
25%
tax inclusive*
Growth Bundle
Number of Reports: 8
30%
tax inclusive*
Enterprise Bundle
Number of Reports: 10
35%
tax inclusive*
How To Order

Select License Type
Choose the right license for your needs and access rights.

Click on ‘Buy Now’
Add the report to your cart with one click and proceed to register.

Select Mode of Payment
Choose a payment option for a secure checkout. You will be redirected accordingly.
Strategic Solutions for Informed Decision-Making
Gain insights to stay ahead and seize opportunities.

Get insights & trends for a competitive edge.

Track prices with detailed trend reports.

Analyse trade data for supply chain insights.

Leverage cost reports for smart savings

Enhance supply chain with partnerships.

Connect For More Information
Our expert team of analysts will offer full support and resolve any queries regarding the report, before and after the purchase.
Our expert team of analysts will offer full support and resolve any queries regarding the report, before and after the purchase.
We employ meticulous research methods, blending advanced analytics and expert insights to deliver accurate, actionable industry intelligence, staying ahead of competitors.
Our skilled analysts offer unparalleled competitive advantage with detailed insights on current and emerging markets, ensuring your strategic edge.
We offer an in-depth yet simplified presentation of industry insights and analysis to meet your specific requirements effectively.


