

Consumer Insights
Uncover trends and behaviors shaping consumer choices today
Procurement Insights
Optimize your sourcing strategy with key market data
Industry Stats
Stay ahead with the latest trends and market analysis.
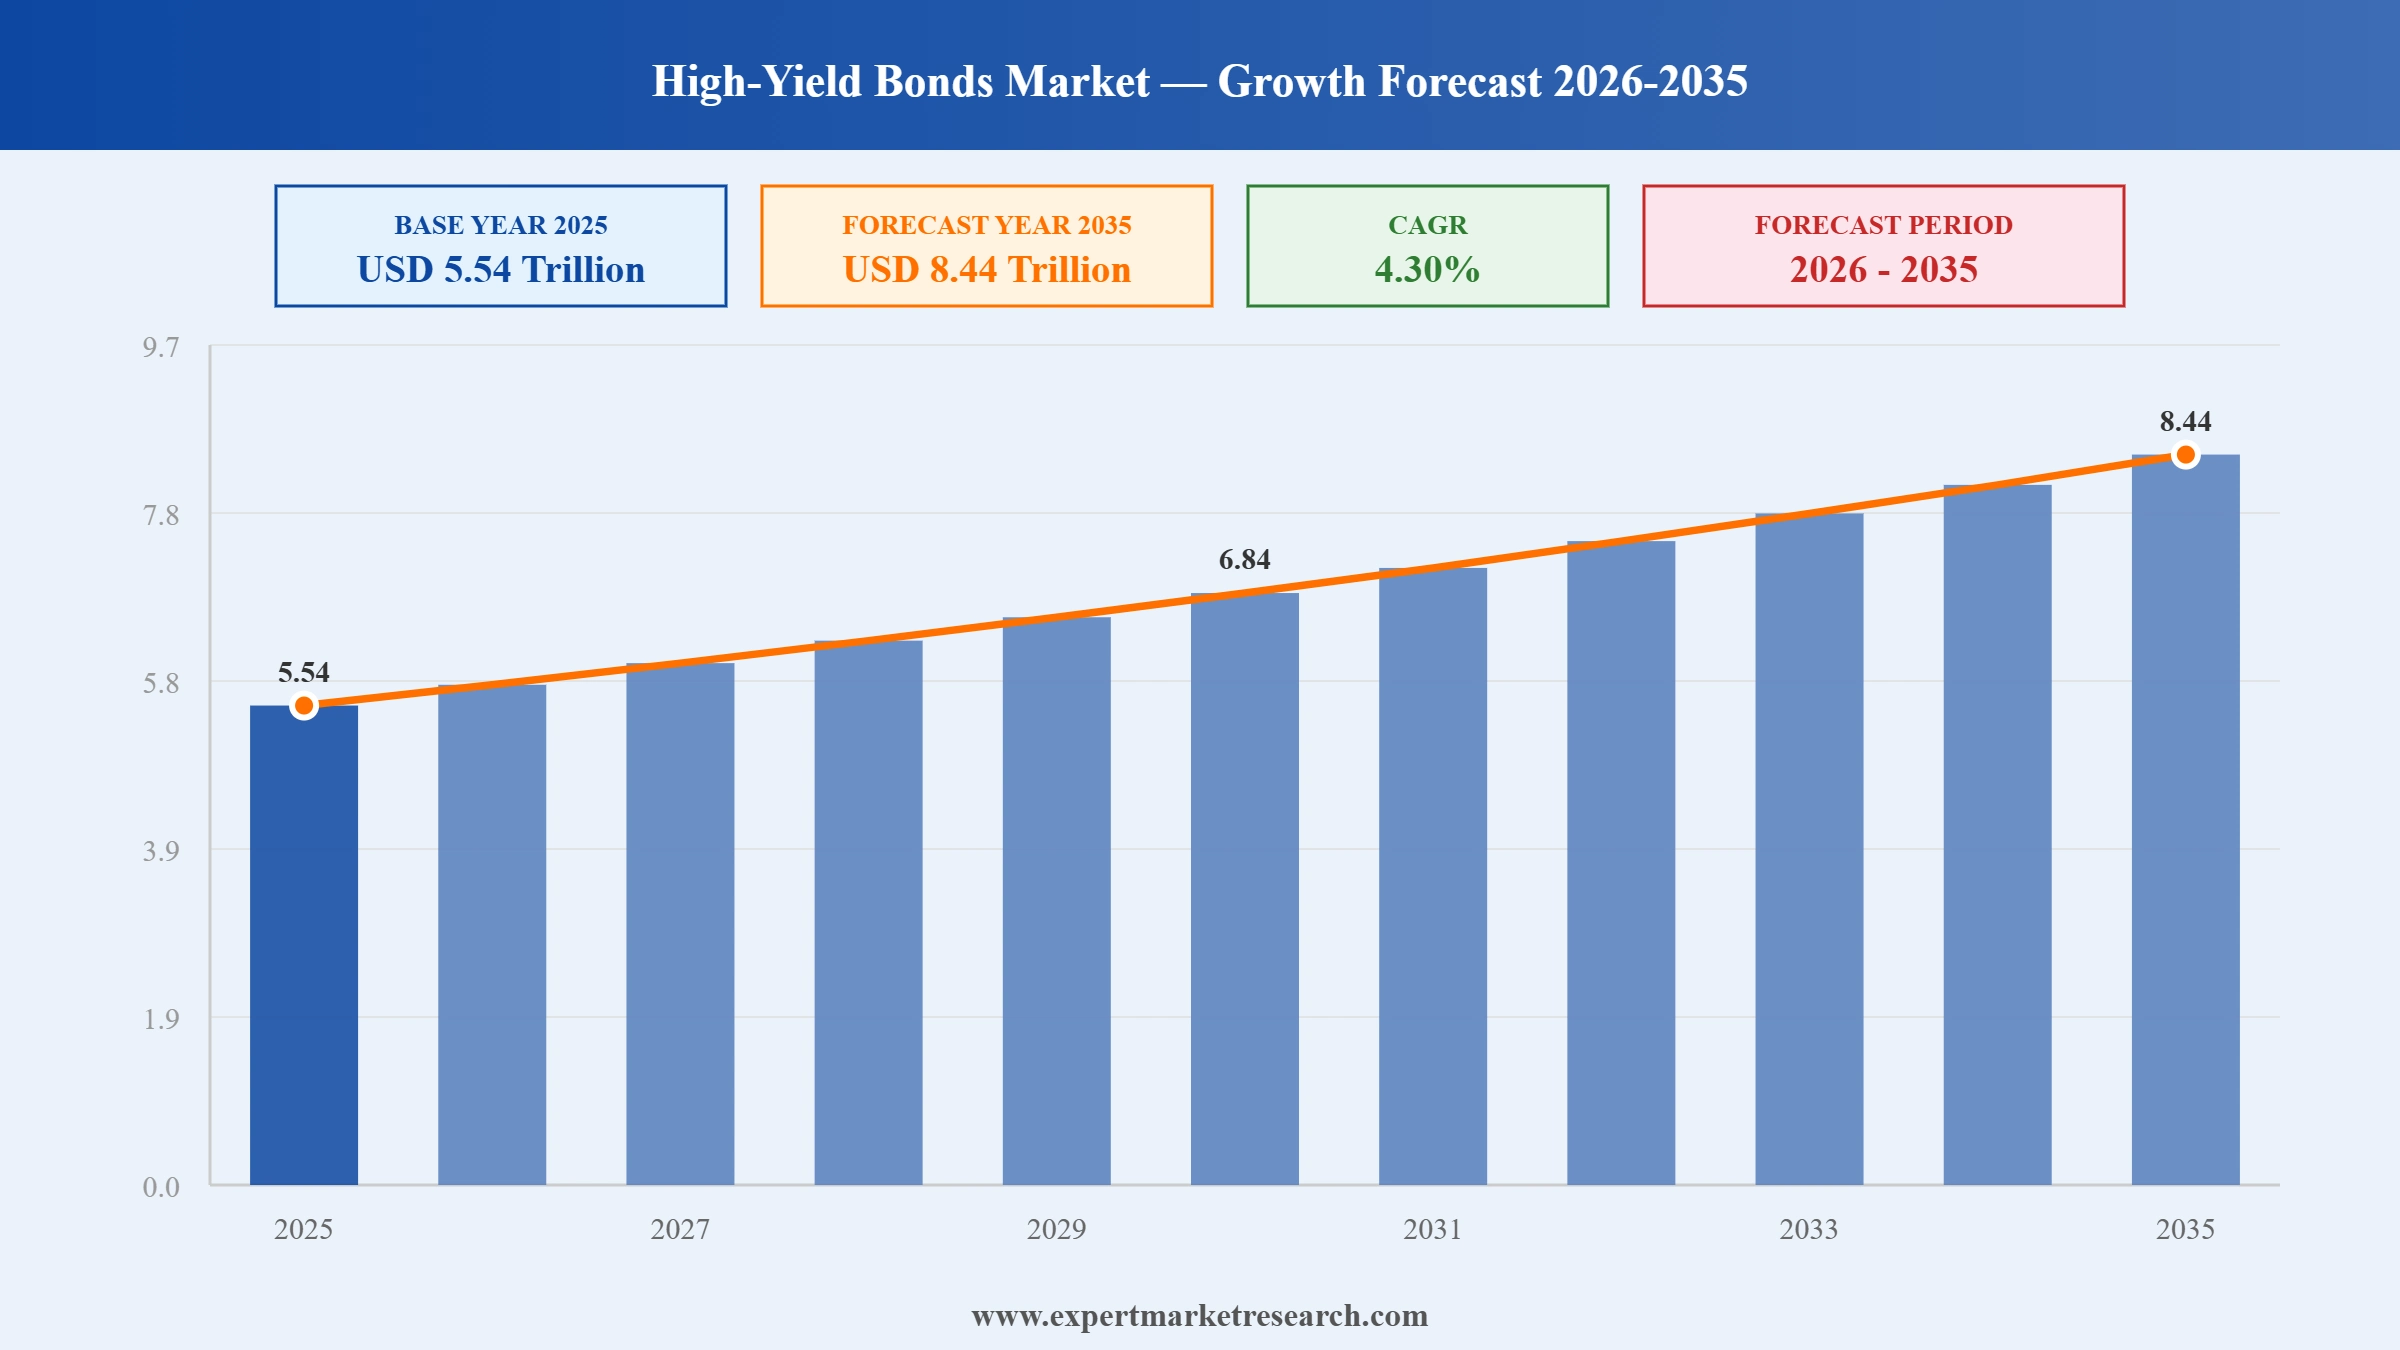
The global high-yield bonds market reached USD 5.54 Trillion in 2025 and is projected to grow at a compound annual growth rate CAGR of 4.30% during the forecast period of 2026 and 2035, reaching USD 8.44 Trillion by 2035, according to Expert Market Research. High-yield bonds debt securities rated below investment grade by major credit rating agencies including Moody's Investors Service, S&P Global Ratings, and Fitch Ratings offer investors above-benchmark income returns in exchange for accepting a higher level of credit and default risk relative to investment-grade corporate or sovereign bonds. The asset class is a fundamental component of global fixed income capital markets, serving as a critical financing mechanism for corporations, leveraged buyout transactions, project finance structures, and emerging market sovereign issuers seeking capital access at below-investment-grade credit profiles.
The high-yield bond market serves several economically important functions within the global capital markets ecosystem. It provides financing access to corporations, leveraged buyout vehicles, project finance structures, and sovereign borrowers that either cannot access investment-grade bond markets or choose covenant-light bond financing over more restrictive bank loan structures. It simultaneously enables institutional investors including pension funds, insurance companies, asset managers, hedge funds, and high-yield bond ETFs to access above-benchmark yield returns within a diversified fixed income allocation framework. The market is structured across primary issuance markets where new bonds are originated and syndicated, and secondary trading markets where existing bonds are bought and sold through electronic trading platforms and dealer intermediaries, with credit quality migration, corporate earnings trends, and macroeconomic conditions serving as the primary long-term pricing determinants across the global high-yield bond ecosystem.

Read more about this report - REQUEST FREE SAMPLE COPY IN PDF
The high-yield bonds market refers to the global ecosystem of debt securities rated below investment grade by established credit rating agencies below Baa3/BBB- by Moody's and S&P/Fitch respectively along with the institutional infrastructure of issuers, underwriters, investors, rating agencies, and trading platforms through which these securities are originated, distributed, traded, and managed. High-yield bonds, also commonly referred to as speculative-grade bonds or junk bonds, compensate investors for accepting elevated credit risk and default probability relative to investment-grade bonds through the payment of higher periodic coupon interest rates the yield spread above risk-free government bond benchmarks that represents the credit risk premium demanded by the market.
Bonds enter the high-yield universe through two primary pathways. Original issue high-yield bonds are sold directly into the speculative-grade market by issuers whose credit profile typically reflecting high leverage, limited operating history, or cyclical business risk does not qualify for investment-grade ratings at issuance. Fallen angels are bonds originally issued with investment-grade ratings that are subsequently downgraded into high-yield territory following credit deterioration, and which typically experience a distinct trading pattern as investment-grade-mandated holders are forced to sell, creating a temporary technical overhang that high-yield specialist investors can capitalise on. The reverse migration rising stars, where high-yield issuers are upgraded into investment-grade territory represents a positive credit event that typically generates strong price appreciation for existing bondholders ahead of the formal upgrade.
Read more about this report - REQUEST FREE SAMPLE COPY IN PDF
The Federal Reserve's rate-cutting cycle through 2025 followed by its hawkish pause in 2026 has created a yield environment where high-yield bonds offer all-in yields above 5% a level that continues to attract a broad institutional and retail income investor base seeking durable returns above the inflation rate. High-yield bonds' yield spread above US Treasuries, while near historically tight levels, continues to deliver a meaningful income premium that sustains robust demand from pension funds, insurance companies, and retail investors accessing high-yield income through bond ETF vehicles.
Corporate earnings growth across the key high-yield issuing sectors has kept default rates well below historical averages, with 2025 defaults closing at approximately 1.5% against a long-term average of 4.5%, and 2026 default expectations of approximately 2% concentrated almost entirely within the lowest-rated CCC tier. This fundamental resilience reflects disciplined capital allocation by high-yield issuers, improved interest coverage ratios, and extended average debt maturities that have collectively reduced near-term refinancing risk across the speculative-grade credit universe relative to prior credit cycle peaks.
The artificial intelligence infrastructure buildout of 2026 has created a powerful structural new supply dynamic in the global corporate bond market, with an estimated USD 1.81 trillion of US investment-grade issuance expected in 2026 alone, driven substantially by AI capital expenditure. While the majority of hyperscaler issuance is investment-grade, the AI capex theme is extending into high-yield, leveraged loans, and private credit markets through mid-tier technology companies, data centre operators, and power infrastructure suppliers whose credit profiles sit in the speculative-grade tier expanding the sectoral diversification of the high-yield bond market beyond its traditional energy, media, and consumer concentration.
Private equity firms' leveraged buyout activity drives a structurally important and recurring demand for high-yield bond financing, with refinancing needs and a rising appetite for mergers and buyouts expected to provide a supportive issuance backdrop in 2026. Private equity's record levels of uninvested committed capital represent substantial latent demand for high-yield financing as interest rate stabilisation improves transaction economics, with high-yield bond markets offering LBO financing flexibility through non-amortising structures and covenant-light terms aligned with private equity holding period requirements.
The progressive development of high-yield bond markets across Asia Pacific, Latin America, and the Middle East is providing structural growth in the global market's total outstanding debt base and geographic diversification of the investor opportunity set. Emerging market corporate and sovereign high-yield issuers offer yield premiums above developed market equivalents that reflect country, currency, and liquidity risk premiums that sophisticated investors can monetise through credit analysis and portfolio construction discipline, with India's developing corporate bond market and Southeast Asian economies representing medium-term market development opportunities.
Read more about this report - REQUEST FREE SAMPLE COPY IN PDF
The Federal Reserve's 2026 dot plot revision showing no rate cuts for the year has fundamentally shifted the interest rate assumptions underlying high-yield bond portfolio strategy. The asset class's structural short duration profile averaging approximately four years versus six to eight years for investment-grade corporates has become a source of relative competitive advantage in a higher-for-longer environment, with institutional managers emphasising income generation through high absolute yield levels, short-to-intermediate maturity positioning, and selectivity in lower-quality CCC credits where refinancing risk is most concentrated.
Fallen angel issuance bonds downgraded from investment-grade to high-yield status represents a closely watched structural theme for 2026, with several large issuers flagged as downgrade candidates following a pattern of high-profile migrations in recent years across media, energy, and industrial sectors. Fallen angels typically trade independently of the broader high-yield market and do not lead to major repricing of other issuers in the index, but have historically delivered outsized returns for dedicated high-yield investors, as the technical overhang created by forced selling from investment-grade-only mandates creates a temporary value opportunity before the bonds are fully re-absorbed into high-yield benchmark indices and specialist portfolios.
Artificial intelligence and machine learning applications are transforming the analytical infrastructure supporting high-yield bond credit assessment, trading, and portfolio management. AI-powered natural language processing systems are being deployed to analyse earnings call transcripts, SEC filings, and industry news in near-real-time to identify credit quality signals and early warning indicators of issuer financial stress, while machine learning credit models incorporating alternative data inputs are enabling more forward-looking and granular credit risk assessment that augments traditional financial ratio and capital structure analysis.
The convergence of traditional high-yield bond markets with private credit and business development company (BDC) structures is an increasingly significant structural trend, particularly following heightened scrutiny of underwriting standards across leveraged finance after a notable 2025 auto parts sector default. Credit rating agencies have maintained broadly stable outlooks for the BDC sector entering 2026, with only a small minority of BDC-held credits performing below expectations and an even smaller share showing genuine financial stress providing a reassuring signal for the broader leveraged credit ecosystem, though continued vigilance around underwriting discipline remains a key analytical focus for high-yield and private credit investors alike.
Environmental, social, and governance considerations are progressively being integrated into high-yield bond investment frameworks, with institutional investors applying ESG screening and thematic allocation overlays to speculative-grade credit portfolios. Green bond and sustainability-linked bond (SLB) instrument formats where coupon rates or issuance terms are linked to defined sustainability performance targets are expanding within the high-yield universe, providing issuers with access to ESG-oriented investor capital while enabling investors to express sustainability preferences within a high-income fixed income framework.
The global high-yield bonds market faces several significant macroeconomic and structural challenges that are testing issuer resilience and investor risk tolerance in 2026. The Federal Reserve's hawkish policy shift with the dot plot signalling potential rate hikes rather than the cuts markets had expected at the start of the year has materially increased the refinancing cost burden for high-yield issuers approaching bond maturity walls, raising default risk for lower-quality CCC-rated credits with inadequate interest coverage at current rate levels. Sticky core inflation, elevated oil prices, and persistent labour market tightness have created a stagflationary risk overlay that constrains the Federal Reserve's ability to provide policy relief to credit markets even as growth risks accumulate. High-yield spreads entering 2026 at historically tight levels mean investors are accepting below-historical-average risk premiums at a point in the cycle when underwriting standard scrutiny heightened following a notable 2025 leveraged finance default suggests continued vigilance is warranted.
Several structural dynamics constrain the pace and sustainability of high-yield bond market growth, particularly for lower-quality issuers and certain sector concentrations. High-yield bond markets experience significant cyclical sensitivity to economic growth expectations and corporate earnings momentum, with credit spreads widening sharply and primary market issuance volumes declining materially during periods of economic deterioration or recession fear. The concentration of high-yield outstanding debt in cyclically sensitive sectors energy, media and telecommunications, consumer retail, and hospitality creates sector-specific vulnerability to structural disruption risks that can crystallise at scale within the high-yield universe. Regulatory capital requirements for insurance companies and bank proprietary trading desks that hold high-yield bonds limit the balance sheet capacity available to provide market-making liquidity during periods of elevated volatility, creating liquidity risk that ETF secondary trading partially mitigates but cannot fully replace. Geopolitical uncertainty particularly oil price volatility linked to Middle East tensions introduces macro risk factors that the high-yield bond market cannot insulate against regardless of issuer-specific fundamental quality.
The global high-yield bonds market presents substantial and well-documented commercial opportunities for issuers, investors, and capital market intermediaries that support sustained above-GDP revenue growth through the 2026 to 2035 forecast period. The higher-for-longer rate environment, paradoxically, is creating an attractive opportunity for high-yield bond income investors, with all-in yields above 5% delivering historically attractive absolute returns for investors who can tolerate the asset class's credit and duration volatility. Emerging market high-yield bond development across India, Southeast Asia, Latin America, and the Middle East represents the largest geographic expansion opportunity, as deepening local capital markets and rising corporate credit awareness create new issuer populations in markets currently underrepresented in the global high-yield universe. The AI infrastructure buildout's bond issuance wave is adding a high-growth, technology-oriented issuer cohort to the high-yield market that historically had limited presence, while the 2026 fallen angels theme is expected to offer dedicated high-yield investors an additional source of differentiated, historically outsized returns. To access comprehensive opportunity sizing, issuer-level credit analysis, default rate forecasting, and investment strategy frameworks across all five regional geographies and major sector concentrations, explore Expert Market Research's complete High-Yield Bonds Market report.
Expert Market Research's High-Yield Bonds Market report provides comprehensive segmentation analysis across bond type, issuer sector, credit rating tier, and region, with market size, issuance volume, and yield data for each segment over the full 2026-2035 forecast period.
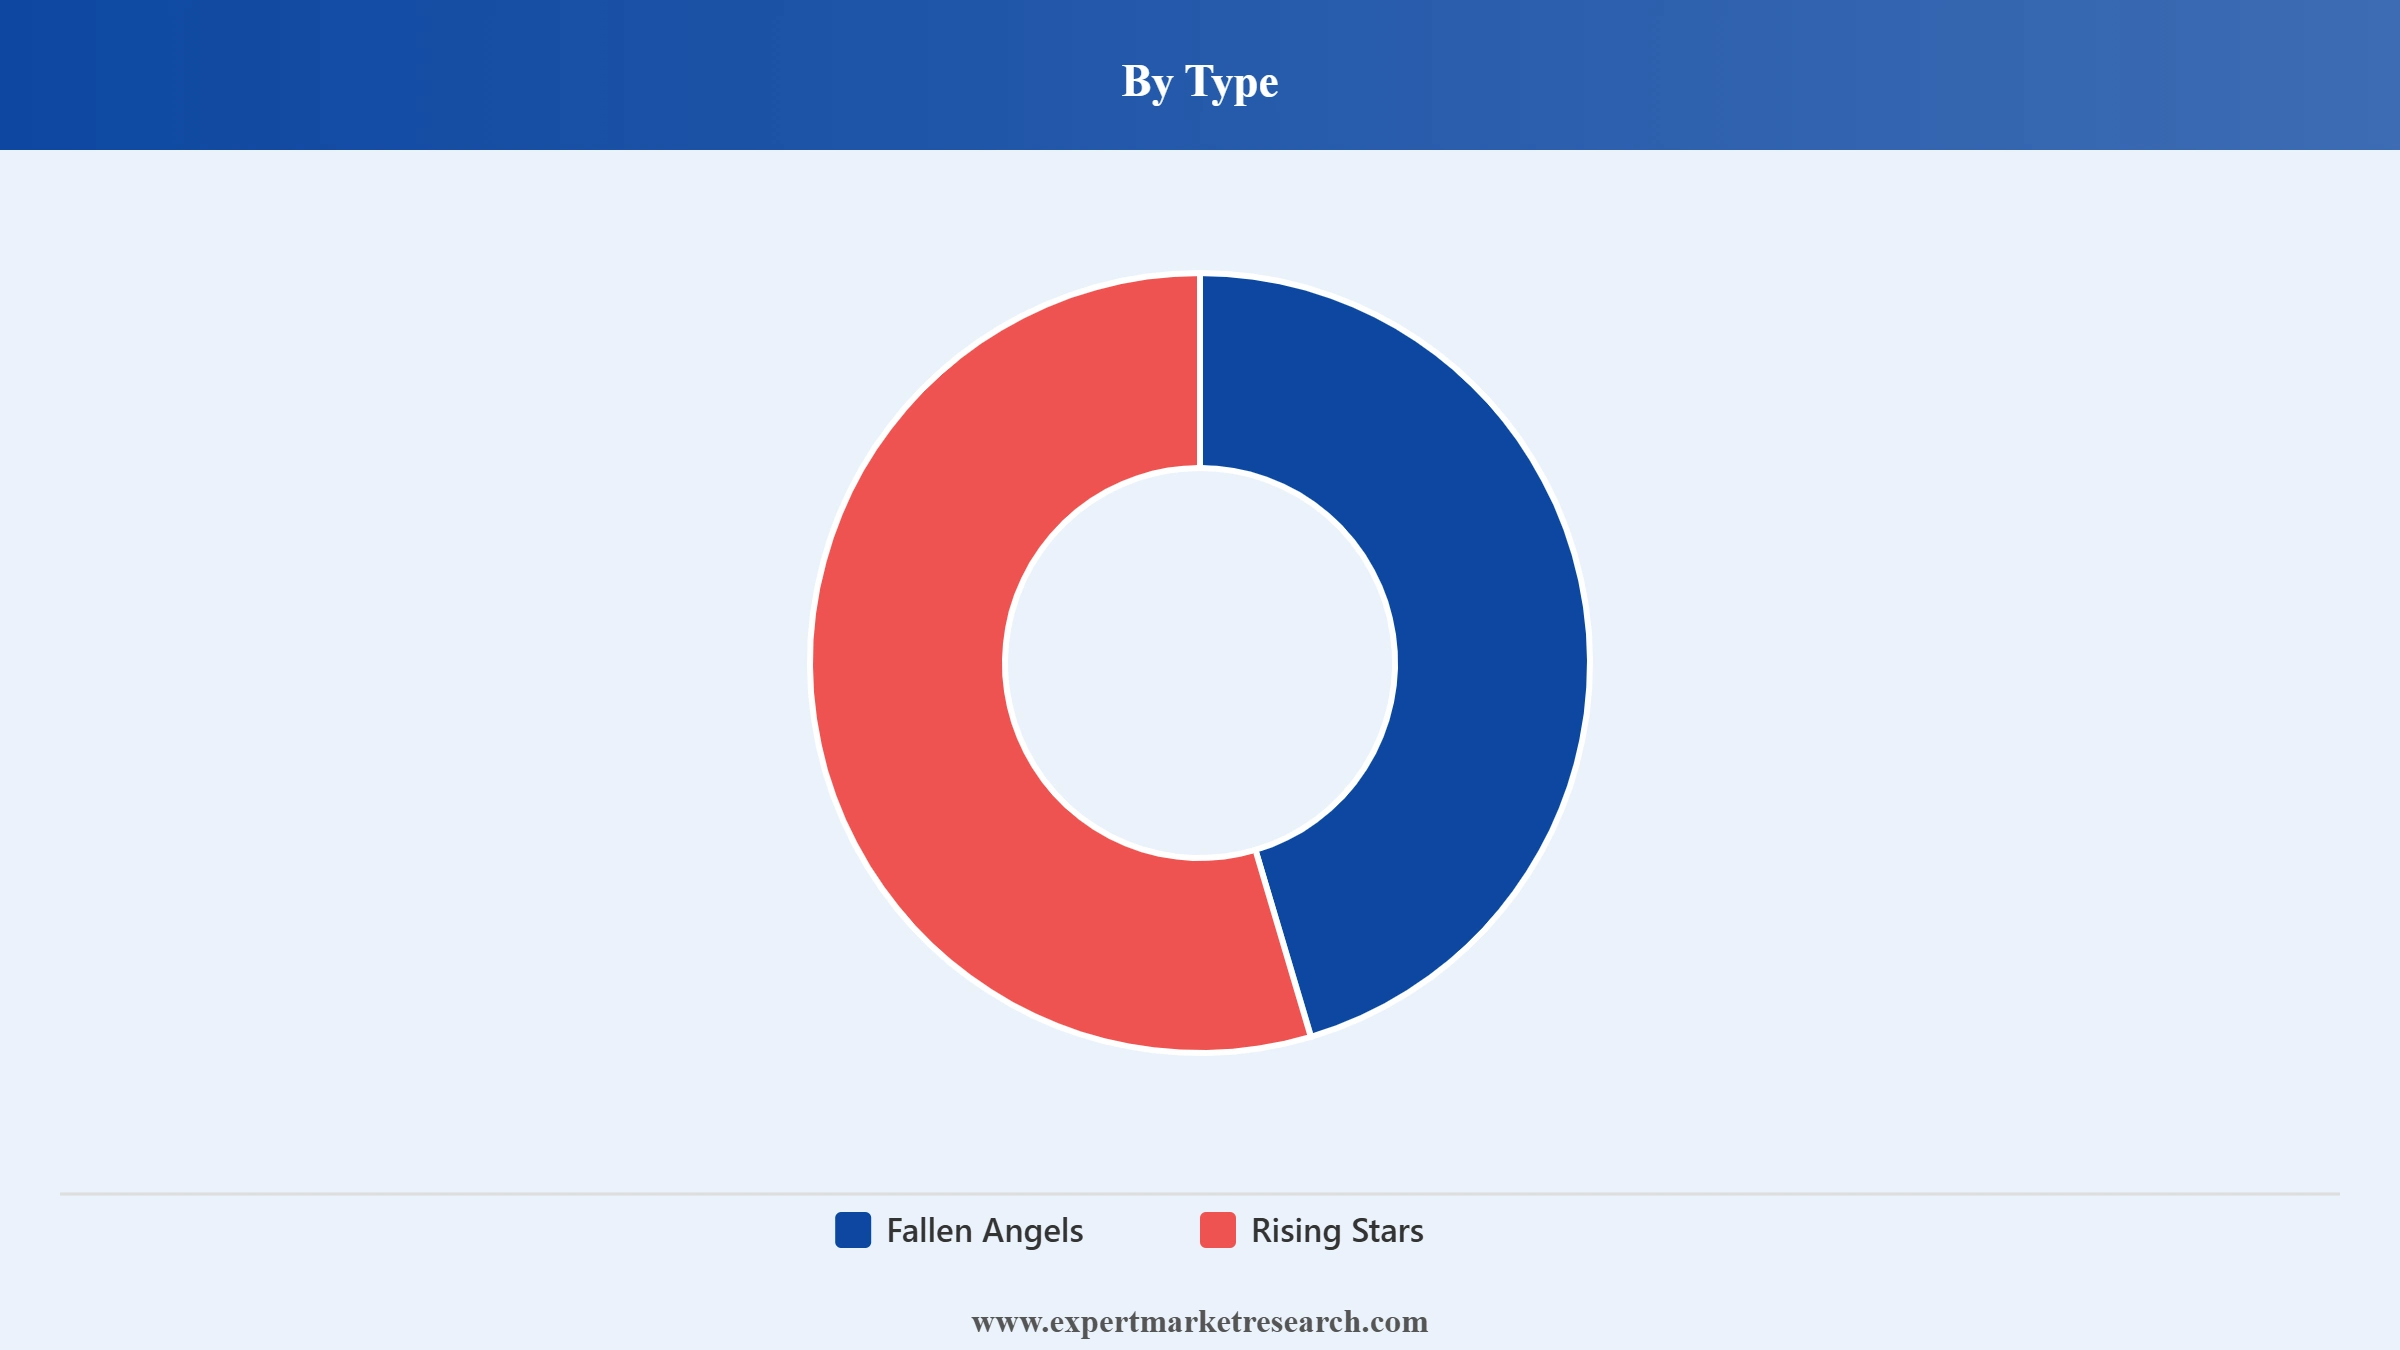
Market Breakup by Type
Key Insights: Fallen angels are bonds originally issued with investment-grade ratings that have been downgraded into high-yield territory following credit deterioration. This segment typically sees forced selling by investment-grade-only mandates at the point of downgrade, creating a temporary technical overhang that has historically delivered outsized returns for high-yield investors once the bonds are re-absorbed into dedicated high-yield portfolios. Several large issuers are expected to migrate into this segment during 2026, continuing a recent pattern across media, energy, and industrial sectors.
Rising stars represent the inverse high-yield issuers upgraded into investment-grade territory following successful deleveraging or improved credit quality. This segment typically generates strong price appreciation ahead of the formal upgrade, as the market prices in the anticipated rating change and investment-grade-focused buyers begin entering in anticipation of index inclusion.
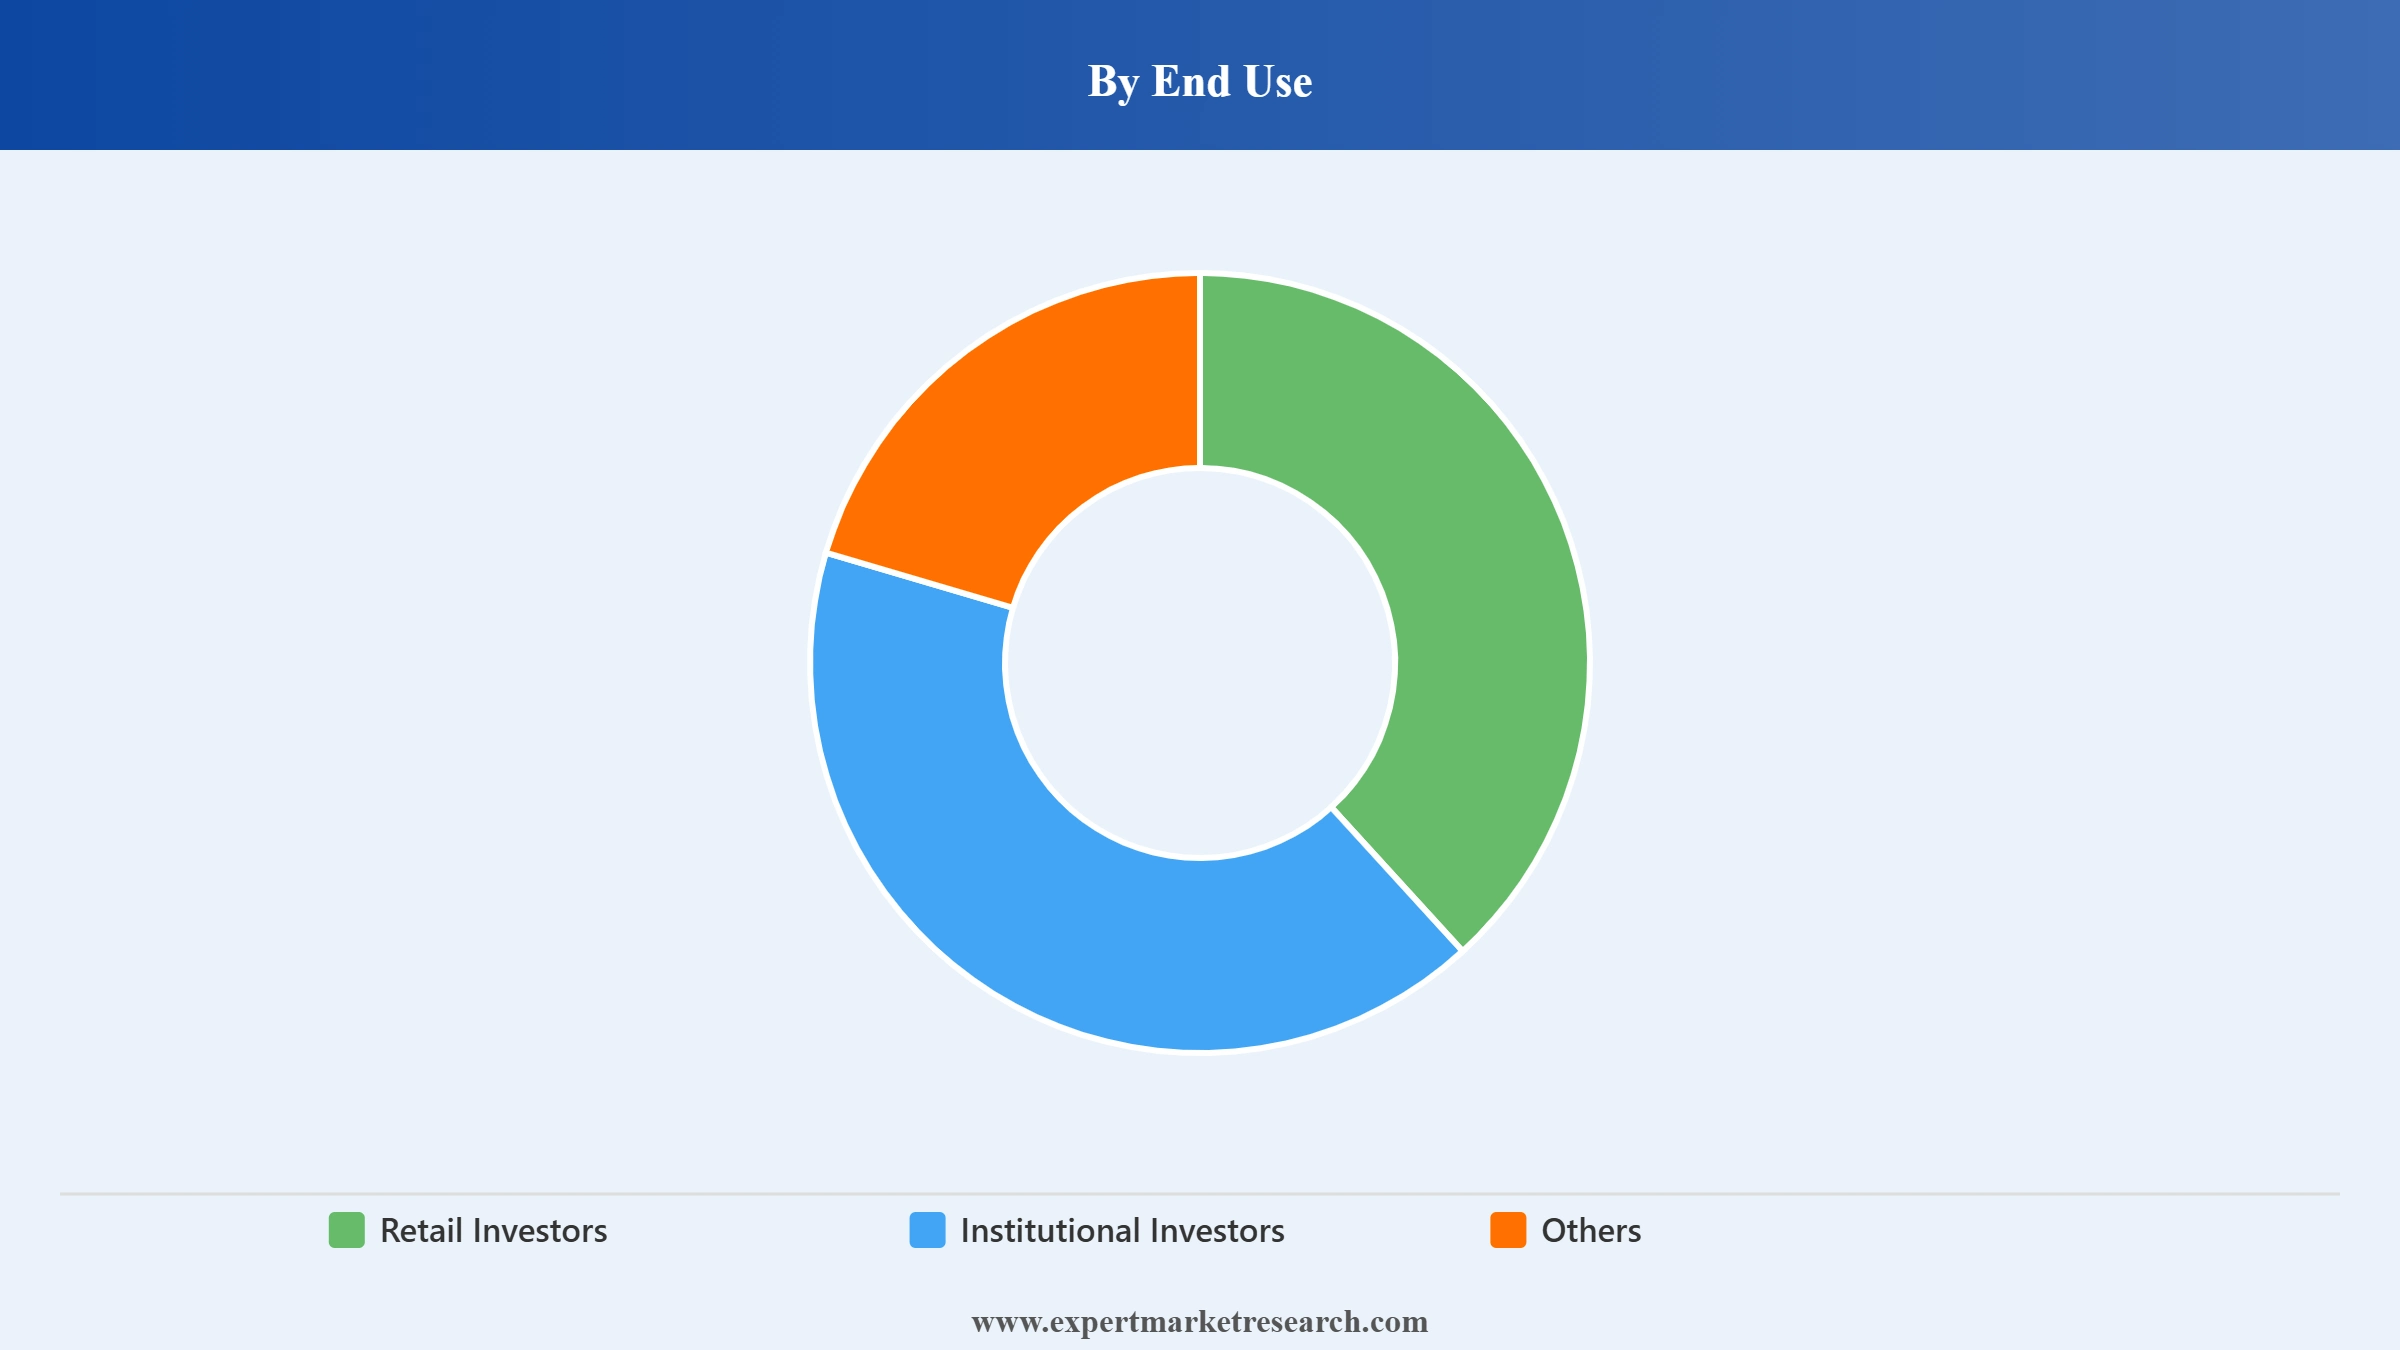
Market Breakup by End Use
Key Insights: Institutional Investors form the largest end-use segment, encompassing pension funds, insurance companies, asset managers, and hedge funds that allocate to high-yield credit through direct bond purchases, actively managed funds, and dedicated mandates. Structural buyers such as insurance companies and pension funds provide a stable demand base that supports issuance capacity even during periods of broader market volatility.
Retail Investors access the market predominantly through high-yield bond ETFs and mutual funds rather than direct purchases, given the high minimum denominations and credit analysis complexity of individual issues. ETF proliferation has significantly democratised retail access to the asset class, though retail flows tend to react more sharply to macroeconomic headlines than institutional demand. Others includes corporate treasuries, family offices, and proprietary trading desks accessing the market for yield enhancement or tactical trading purposes.
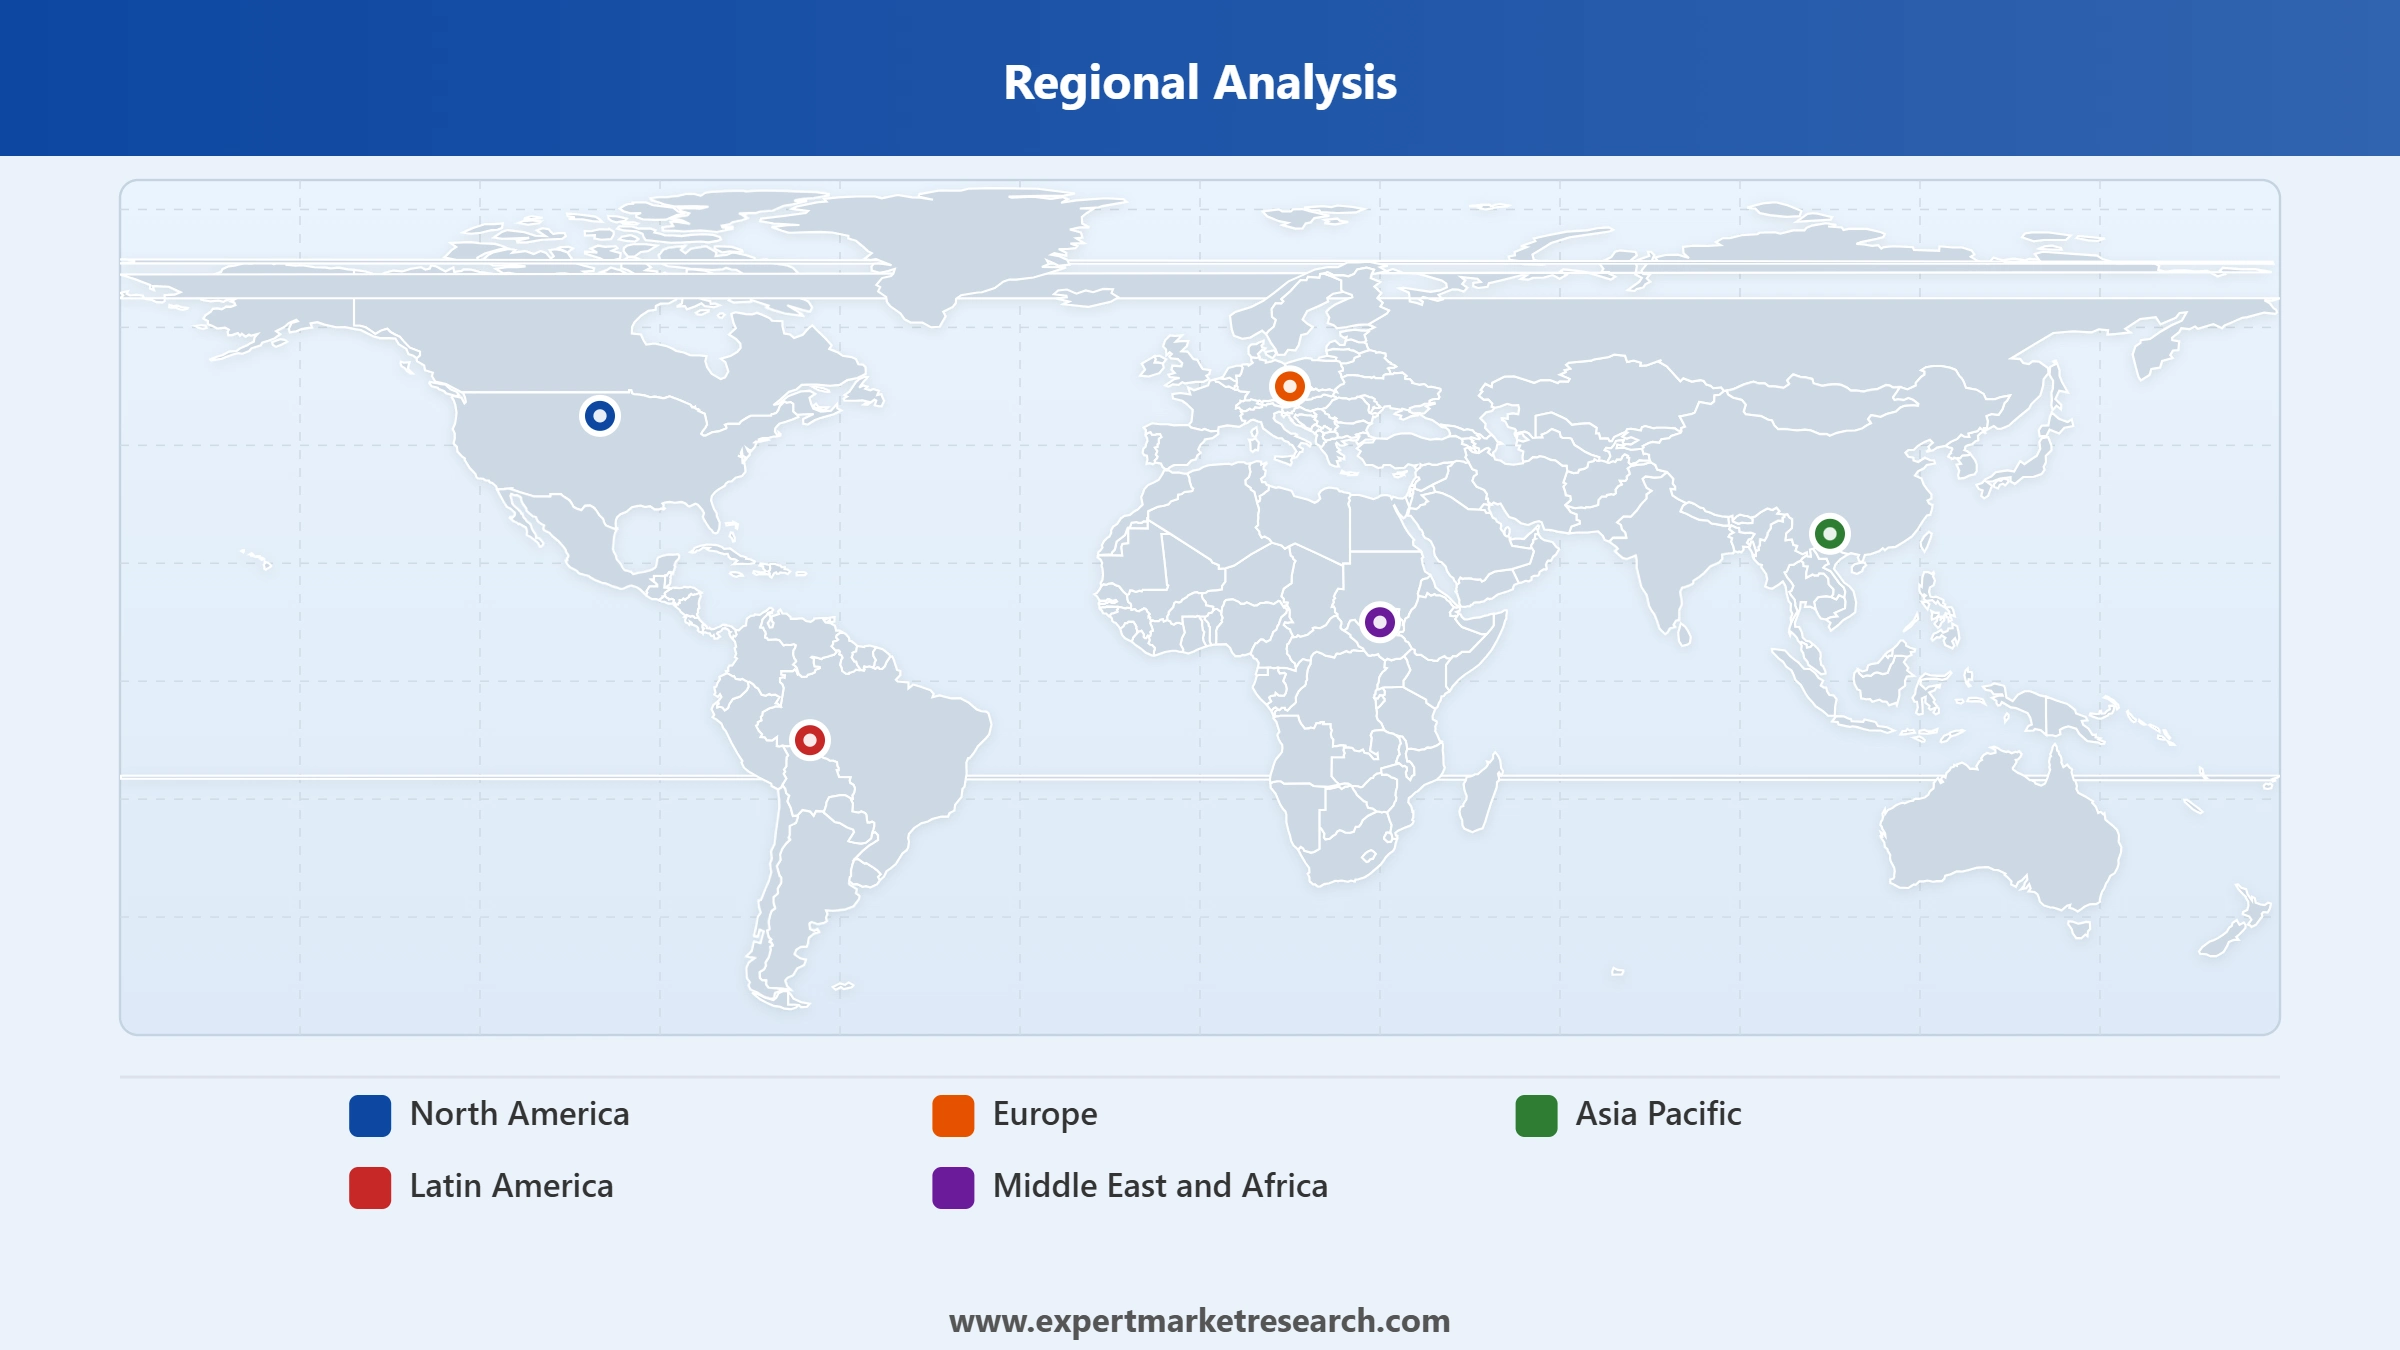
Market Breakup by Region


Read more about this report - REQUEST FREE SAMPLE COPY IN PDF
North America led overwhelmingly by the United States is the world's largest high-yield bond market, accounting for the dominant share of global high-yield outstanding debt and new annual issuance. The region's high-yield market is the most liquid, deeply traded, and institutionally sophisticated globally, supported by the world's largest pool of institutional fixed income investors and the most active leveraged buyout and private equity ecosystem.
United States High-Yield Bonds Market
The United States is the single largest national high-yield bond market in the world, with the Federal Reserve's interest rate policy serving as the most important macroeconomic driver of US high-yield spread levels, issuance volumes, and total return performance. The US high-yield market is comprehensively tracked through the ICE BofA US High Yield Index and the Bloomberg US Corporate High-Yield Bond Index, both capturing US dollar-denominated below-investment-grade corporate debt with established minimum size and maturity criteria. The 2026 hawkish shift under Fed Chair Warsh has created near-term spread volatility while preserving the elevated absolute yield levels that have sustained strong domestic and international investor demand for US high-yield paper. US high-yield issuers span the full spectrum of domestic industrial, technology, energy, healthcare, and media sectors, with the market's depth and liquidity making it the global pricing benchmark for speculative-grade corporate credit.
Canada High-Yield Bonds Market
Canada represents a significant secondary North American high-yield bond market, with resource sector, financial services, and real estate issuers providing geographic and sector diversification from the US-dominated regional market structure. Canadian high-yield issuance is closely correlated with US market conditions given the integrated nature of North American capital markets and the US dollar-denominated nature of much cross-border Canadian corporate debt issuance.
Europe has the world's second-largest high-yield bond market, centred on the United Kingdom, Germany, France, and Luxembourg as primary issuance and investor jurisdictions, with Euro-denominated and sterling-denominated high-yield markets operating with distinct currency-specific dynamics. The European high-yield market has historically traded at wider credit spreads than US equivalents of similar credit quality, reflecting lower average credit market liquidity and greater regulatory capital constraints on European bank market makers. The European Central Bank's monetary policy cycle which has historically diverged from US Federal Reserve policy during periods of economic decoupling creates currency-hedged yield differentials that drive cross-border capital flows between US and European high-yield markets for institutional investors managing global fixed income mandates.
Read more about this report - REQUEST FREE SAMPLE COPY IN PDF
Asia Pacific is the fastest-growing regional high-yield bond market, driven by the development of China's domestic and offshore corporate bond market, India's progressively deepening capital market infrastructure, and Southeast Asian corporate bond market expansion across Indonesia, Malaysia, Thailand, and the Philippines. The Chinese offshore US dollar-denominated high-yield bond market historically dominated by property developers has undergone significant restructuring since 2021, with multiple large-scale bond defaults reshaping the market's risk profile and investor base. Japan and South Korea are mature and deep domestic bond markets but with limited high-yield bond development given local banking systems' primary role in corporate credit provision.
The Middle East and Africa region represents a growing and strategically important component of the global high-yield bond market, characterised by the Gulf Cooperation Council's significant sovereign and quasi-sovereign bond issuance, the progressive development of sukuk (Islamic bond) markets offering structurally distinct high-yield instruments, and Sub-Saharan Africa's emerging sovereign Eurobond market. GCC sovereign and quasi-sovereign issuers access global bond markets across the investment-grade and high-yield spectrum to finance economic diversification programmes and infrastructure investment, while Sub-Saharan African sovereign high-yield Eurobonds have faced significant spread widening and debt sustainability pressure following the post-pandemic rise in global interest rates.
Latin America's high-yield bond market is centred on Brazil, Mexico, Colombia, and Chile, with sovereign and corporate borrowers accessing both US dollar-denominated international bond markets and increasingly developed local currency bond markets. Brazilian corporate and sovereign borrowers are the largest source of Latin American high-yield issuance, supported by the country's large and diversified economy and deep domestic capital markets across energy, agribusiness, mining, retail, and telecommunications sectors. The US interest rate environment is a critical external driver of Latin American high-yield spread performance, as higher US rates reduce relative yield attraction and increase the refinancing cost burden for US dollar-denominated sovereign and corporate issuers.
The comprehensive EMR report provides an in-depth assessment of the market based on Porter's five forces model along with giving a SWOT analysis. The report gives a detailed analysis of the following key players in the global high-yield bonds market, covering their competitive landscape and the latest developments like mergers, acquisitions, investments, and expansion plans.
BlackRock, Inc. is one of the largest known global investment management corporations operating with its headquarters located in the United States of America. Established in 1988, it has become one of the largest and most influential asset management firms in the world. The corporation’s expertise lies in investment management and provides a wide range of financial products and services to institutional and individual investors.
Morgan Stanley is a worldwide financial services corporation with its main office in New York City, USA, that was established in 1935. Since then, it has evolved into one of the preeminent and largest investment banks on a global scale. The company's operations encompass a broad spectrum, ranging from investment banking and asset management to wealth management and trading.
M&G plc Group is a British multinational investment company headquartered in London, the United Kingdom. It has a long history dating back to 1931 and is one of the United Kingdom’s largest and oldest investment management companies. It is primarily engaged in investment management, offering a wide range of products and services to individuals, institutions, and financial intermediaries.
*Please note that this is only a partial list; the complete list of key players is available in the full report. Additionally, the list of key players can be customized to better suit your needs.*
Other global high-yield bonds market players include Alcentra Limited, The Vanguard Group, Inc., Aegon Group, Northern Trust Corporation, The Charles Schwab Corporation, T. Rowe Price International Ltd, and Nomura Asset Management Group, among others.
Upto 15% Off
USD
$2499 $2249
$3999 $3599
$4999 $4249
$5999 $5099


*While we strive to always give you current and accurate information, the numbers depicted on the website are indicative and may differ from the actual numbers in the main report. At Expert Market Research, we aim to bring you the latest insights and trends in the market. Using our analyses and forecasts, stakeholders can understand the market dynamics, navigate challenges, and capitalize on opportunities to make data-driven strategic decisions.*
In 2025, the market reached an approximate value of USD 5.54 Trillion.
The market is projected to grow at a CAGR of 4.30% between 2026 and 2035.
The market is estimated to witness healthy growth in the forecast period of 2026-2035 to reach a value of around USD 8.44 Trillion by 2035.
The market is driven by the increasing globalisation of high-yield bonds and the rising interest from different issuers of various regions to enter the market.
The increasing regulatory policies and changes in the market and the steady rise in the issuance volume are the major factors guiding the market.
The major regional markets are North America, Europe, the Asia Pacific, Latin America, and the Middle East and Africa.
The different end uses of high-yield bonds are retail investors and institutional investors, among others.
The key players in the market include BlackRock, Inc., Morgan Stanley, M&G plc Group, Alcentra Limited, The Vanguard Group, Inc., Aegon Group, Northern Trust Corporation, The Charles Schwab Corporation, T. Rowe Price International Ltd, and Nomura Asset Management Group, among others.
Explore our key highlights of the report and gain a concise overview of key findings, trends, and actionable insights that will empower your strategic decisions.
| REPORT FEATURES | DETAILS |
| Base Year | 2025 |
| Historical Period | 2019-2025 |
| Forecast Period | 2026-2035 |
| Scope of the Report |
Historical and Forecast Trends, Industry Drivers and Constraints, Historical and Forecast Market Analysis by Segment:
|
| Breakup by Type |
|
| Breakup by End Use |
|
| Breakup by Region |
|
| Market Dynamics |
|
| Competitive Landscape |
|
| Companies Covered |
|
Datasheet
One User
USD 2,499
USD 2,249
tax inclusive*
Single User License
One User
USD 3,999
USD 3,599
tax inclusive*
Five User License
Five User
USD 4,999
USD 4,249
tax inclusive*
Corporate License
Unlimited Users
USD 5,999
USD 5,099
tax inclusive*
*Please note that the prices mentioned below are starting prices for each bundle type. Kindly contact our team for further details.*
Flash Bundle
Small Business Bundle
Growth Bundle
Enterprise Bundle
*Please note that the prices mentioned below are starting prices for each bundle type. Kindly contact our team for further details.*
Flash Bundle
Number of Reports: 3
20%
tax inclusive*
Small Business Bundle
Number of Reports: 5
25%
tax inclusive*
Growth Bundle
Number of Reports: 8
30%
tax inclusive*
Enterprise Bundle
Number of Reports: 10
35%
tax inclusive*
How To Order

Select License Type
Choose the right license for your needs and access rights.

Click on ‘Buy Now’
Add the report to your cart with one click and proceed to register.

Select Mode of Payment
Choose a payment option for a secure checkout. You will be redirected accordingly.
Strategic Solutions for Informed Decision-Making
Gain insights to stay ahead and seize opportunities.

Get insights & trends for a competitive edge.

Track prices with detailed trend reports.

Analyse trade data for supply chain insights.

Leverage cost reports for smart savings

Enhance supply chain with partnerships.

Connect For More Information
Our expert team of analysts will offer full support and resolve any queries regarding the report, before and after the purchase.
Our expert team of analysts will offer full support and resolve any queries regarding the report, before and after the purchase.
We employ meticulous research methods, blending advanced analytics and expert insights to deliver accurate, actionable industry intelligence, staying ahead of competitors.
Our skilled analysts offer unparalleled competitive advantage with detailed insights on current and emerging markets, ensuring your strategic edge.
We offer an in-depth yet simplified presentation of industry insights and analysis to meet your specific requirements effectively.


