

Consumer Insights
Uncover trends and behaviors shaping consumer choices today
Procurement Insights
Optimize your sourcing strategy with key market data
Industry Stats
Stay ahead with the latest trends and market analysis.
The hypophosphorous acid market size reached around USD 762.12 Million in 2025. The market is projected to grow at a CAGR of 5.00% between 2026 and 2035 to reach nearly USD 1241.41 Million by 2035.
Compound Annual Growth Rate
5%
Value in USD Million
2026-2035
One of the chief applications of hypophosphorous acid is in the production of electroless nickel-phosphorous plating. This material is used extensively in the electronics industry in the making of printed circuit boards and hard-disk drives. It is also commonly used to provide a corrosion-resistant or smoothening coat over metal surfaces. Another factor that may boost the growth of the global hypophosphorous acid market is its use as a reducing agent in the pharmaceutical industry, which is currently facing a surge due to the COVID-19 pandemic. Hence, the market for hypophosphorous acid is expected to grow at a healthy pace during the forecast period of 2026-2035.
While Europe and North America continue to hold a significant market share, with respect to hypophosphorous acid consumption, the Asia Pacific region is expected to witness a robust growth in the coming years, mostly attributed to the increased utilisation of the acid in paints, inks, and coatings, as well as pharmaceuticals industries. The pharmaceuticals sector is expected to grow significantly in this region during the forecast period.
Read more about this report - REQUEST FREE SAMPLE COPY IN PDF
Hypophosphorous acid (H¬3PO3), sometimes referred to as HPA, is a strong reducing agent obtained from hypophosphite salts like sodium hypophosphite. It is a clear, colourless liquid that can be stored under normal conditions. It is obtained from its salt form (such as sodium hypophosphite) and thus shares applications with this state. It is used to reduce a wide variety of chemicals in industrial production reactions. The acid is often shipped by suppliers as ‘pharmaceutical grade’, which indicates higher purity materials better suited for use in this industry. The product’s applications as a catalyst, neutralising agent, and discolouring agent, especially in the synthesis of polymers and plastics, have led to the growth driven by the increased production of these materials. This is due to the increase in consumption of plastic and polymer-based products in recent years, a trend that is expected to continue in the future.
The major types of hypophosphorous acid are:
The market can be broadly categorised on the basis of its grade into:
The market can be classified by application into:
The EMR report looks into the regional markets of hypophosphorous acid like:


Hypophosphorous acid is commonly used as a reducing agent in the plastics and polymers industry and is typically supplied in 50% aqueous solution, but it also available in 80% when stronger reducing action is required. Besides reduction, the acid is also used as a neutralising agent, catalyst, wetting agent, and for bleaching in the polymers and plastics industry.
The large increase in the value of the pharmaceuticals industry as a result of the COVID-19 pandemic is expected to result in the increased demand for hypophosphorous acid, which is commonly used as a reducing agent (and various other applications) in the formulation of pharmaceutical products. It is expected that demand for pharma-grade HPA will continue to grow during the period 2026-2035.
The report presents a detailed analysis of the following key players in the global hypophosphorous acid market, looking into their capacity, market shares, and latest developments like capacity expansions, plant turnarounds, and mergers and acquisitions:
The comprehensive report looks into the macro and micro aspects of the industry. The EMR report gives an in-depth insight into the market by providing a SWOT analysis, as well as an analysis of Porter’s Five Forces model.
Upto 15% Off
USD
$2499 $2249
$3999 $3599
$4999 $4249
$5999 $5099


*While we strive to always give you current and accurate information, the numbers depicted on the website are indicative and may differ from the actual numbers in the main report. At Expert Market Research, we aim to bring you the latest insights and trends in the market. Using our analyses and forecasts, stakeholders can understand the market dynamics, navigate challenges, and capitalize on opportunities to make data-driven strategic decisions.*
In 2025, the market reached an approximate value of USD 762.12 Million.
The market is projected to grow at a CAGR of 5.00% between 2026 and 2035.
The market is estimated to witness healthy growth in the forecast period of 2026-2035 to reach a value of around USD 1241.41 Million by 2035.
The major drivers of the industry, such as rising disposable incomes, growing electronics market, and increasing applications in polymers and plastics production, are expected to aid the market growth.
The key trends expected to drive the growth of the market are the advancements in the pharmaceutical industry and the increased R&D activities in this sector.
The major regions in the market are North America, Europe, the Asia Pacific, Latin America, and the Middle East and Africa.
The major types of hypophosphorous acid available for purchase are hypophosphorous acid 50% and hypophosphorous acid 80%.
Hypophosphorous acid as a product is classified into technical and pharmaceutical grade.
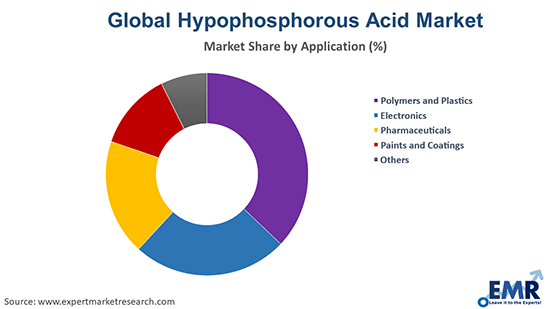
The leading applications of hypophosphorous acid include polymers and plastics, electronics, pharmaceuticals, and paints and coatings, among others.
The major companies involved in production and supply of hypohosphorous acid are Arkema Group, Richman Chemical Inc., Hubei Lianxing Chemical Co., Ltd., Varsal Inc., and Jiangsu Kangxiang Industrial Group Co., Ltd., among others.
Explore our key highlights of the report and gain a concise overview of key findings, trends, and actionable insights that will empower your strategic decisions.
| REPORT FEATURES | DETAILS |
| Base Year | 2025 |
| Historical Period | 2019-2025 |
| Forecast Period | 2026-2035 |
| Scope of the Report |
Historical and Forecast Trends, Industry Drivers and Constraints, Historical and Forecast Market Analysis by Segment:
|
| Breakup by Type |
|
| Breakup by Grade |
|
| Breakup by Application |
|
| Breakup by Region |
|
| Market Dynamics |
|
| Competitive Landscape |
|
| Companies Covered |
|
| Report Price and Purchase Option | Explore our purchase options that are best suited to your resources and industry needs. |
| Delivery Format | Delivered as an attached PDF and Excel through email, with an option of receiving an editable PPT, according to the purchase option. |
Datasheet
One User
USD 2,499
USD 2,249
tax inclusive*
Single User License
One User
USD 3,999
USD 3,599
tax inclusive*
Five User License
Five User
USD 4,999
USD 4,249
tax inclusive*
Corporate License
Unlimited Users
USD 5,999
USD 5,099
tax inclusive*
*Please note that the prices mentioned below are starting prices for each bundle type. Kindly contact our team for further details.*
Flash Bundle
Small Business Bundle
Growth Bundle
Enterprise Bundle
*Please note that the prices mentioned below are starting prices for each bundle type. Kindly contact our team for further details.*
Flash Bundle
Number of Reports: 3
20%
tax inclusive*
Small Business Bundle
Number of Reports: 5
25%
tax inclusive*
Growth Bundle
Number of Reports: 8
30%
tax inclusive*
Enterprise Bundle
Number of Reports: 10
35%
tax inclusive*
How To Order

Select License Type
Choose the right license for your needs and access rights.

Click on ‘Buy Now’
Add the report to your cart with one click and proceed to register.

Select Mode of Payment
Choose a payment option for a secure checkout. You will be redirected accordingly.
Strategic Solutions for Informed Decision-Making
Gain insights to stay ahead and seize opportunities.

Get insights & trends for a competitive edge.

Track prices with detailed trend reports.

Analyse trade data for supply chain insights.

Leverage cost reports for smart savings

Enhance supply chain with partnerships.

Connect For More Information
Our expert team of analysts will offer full support and resolve any queries regarding the report, before and after the purchase.
Our expert team of analysts will offer full support and resolve any queries regarding the report, before and after the purchase.
We employ meticulous research methods, blending advanced analytics and expert insights to deliver accurate, actionable industry intelligence, staying ahead of competitors.
Our skilled analysts offer unparalleled competitive advantage with detailed insights on current and emerging markets, ensuring your strategic edge.
We offer an in-depth yet simplified presentation of industry insights and analysis to meet your specific requirements effectively.


