

Consumer Insights
Uncover trends and behaviors shaping consumer choices today
Procurement Insights
Optimize your sourcing strategy with key market data
Industry Stats
Stay ahead with the latest trends and market analysis.

The India activated carbon market was valued at USD 251.89 Million in 2025. The market is expected to grow at a CAGR of 4.50% during the forecast period of 2026-2035. The increasing demand for clean water and clean air has drastically propelled the market growth. The growing public concern over waterborne diseases, increased consumption of bottled water, and demand for safe drinking water in urban areas have been key motivators of the growth, alongside the establishment of industrial wastewater treatment plants and stricter environmental pollution control regulations. In turn, all these factors have resulted in the market attaining a valuation of USD 391.18 Million by 2035.
The India activated carbon market is witnessing significant growth, driven by rising imports and increasing demand for coal-based activated carbon. In 2023, India imported approximately 21,000 tons of activated carbon, marking a 2.1% year-on-year increase. The total import value rose by 14.2% to reach USD 73 million, reflecting strong price and volume momentum. China and the United States continue to be the top suppliers, indicating increasing requirements in water treatment, air purification, and gold recovery segments, thus bolstering the India activated carbon demand.
One of the significant trends in the India activated carbon industry is the growing use of biochar production from agricultural residues. In January 2025, Google signed a deal with Indian supplier Varaha to buy carbon credits sourced from biochar which is made by pyrolysing agricultural waste to produce charcoal. This not only sequesters carbon dioxide but gives farmers an alternative to conventional fertilizers, helping smallholder farmers in India. Varaha intends to acquire waste from many small-scale farms and turn it into biochar, hoping to sequester considerable quantities of CO₂ every year.
Base Year
Historical Period
Forecast Period
Compound Annual Growth Rate
4.5%
Value in USD Million
2026-2035
*this image is indicative*
| India Activated Carbon Market Report Summary |
Description |
Value |
|
Base Year |
USD Million |
2025 |
|
Historical Period |
USD Million |
2019-2025 |
|
Forecast Period |
USD Million |
2026-2035 |
|
Market Size 2025 |
USD Million |
251.89 |
|
Market Size 2035 |
USD Million |
391.18 |
|
CAGR 2019-2025 |
Percentage |
XX% |
|
CAGR 2026-2035 |
Percentage |
4.50% |
|
CAGR 2026-2035 - Market by Region |
South India |
5.0% |
|
CAGR 2026-2035 - Market by Region |
East India |
4.3% |
|
CAGR 2026-2035 - Market by Type |
Powdered Activated Carbons |
4.9% |
|
CAGR 2026-2035 - Market by End Users |
Water Treatment |
5.2% |
|
2025 Market Share by Region |
South India |
31.7% |
Growing industrialization and environmental regulations are reshaping India's activated carbon market, especially in sectors like pharmaceuticals and specialty chemicals. In March 2024, MICBAC India commissioned a new facility in West Bengal focused on coal-based activated carbon tailored for effluent treatment in pharma clusters. Similarly, CG Carbon has been actively involved in the gold mining sector by providing high-quality coconut shell-based granular activated carbon, which is essential for processes like Carbon-in-Leach (CIL), Carbon-in-Pulp (CIP), and Carbon-in-Column (CIC) used in gold extraction. These strategic moves reflect a shift toward application-specific carbon grades to comply with stricter CPCB discharge norms and export standards.
Integration of activated carbon in India’s municipal water treatment is accelerating due to the 2023 CPCB mandate requiring 85% removal of total organic carbon (TOC) from effluents by major urban centers. Leading plants in Maharashtra and Tamil Nadu upgraded filtration systems with granular activated carbon (GAC) units, boosting contaminant adsorption efficiency by over 30%. Additionally, industrial sectors like pharmaceuticals in Hyderabad have adopted activated carbon-based tertiary treatment to meet stricter discharge norms, directly addressing urban water pollution challenges.
Activated carbon is used in the mining industry to extract gold from ore using a carbon-in-pulp process. Due to increasing gold prices and mining activities, its market is expanding significantly. In November 2024, India's gold imports experienced a significant surge, reaching approximately $14.9 billion, marking a 331% year-over-year increase, and surpassing crude oil as the country's top import, driving the India activated carbon market growth. This surge is attributed to reduced import duties and increased demand during the festive season. Consequently, gold mining operations have intensified, driving up the demand for granular activated carbon (GAC), a critical component in gold recovery processes such as Carbon-in-Pulp (CIP) and Carbon-in-Leach (CIL). Companies like Kalpaka Chemicals have been supplying high-quality activated carbon tailored for these applications, ensuring efficient gold adsorption and recovery.
In January 2025, India-based Jacobi Carbons launched a new grade of coconut shell-based activated carbon, especially for high-flow municipal water treatment systems. The product employs waste coconut biomass under India's Green Credit Programme launched in 2023. The company cited a 27% surge in demand from Tier-1 cities as more enforcement of Jal Jeevan Mission's water quality directives unfolded, signaling unequivocally towards renewable-sourced, high-performance carbon filters in public utility.
In November 2024, Kalpaka Chemicals upgraded Kerala's steam activation line to include an AI-based system for temperature and humidity monitoring, enhancing yield uniformity and adsorption capacity by 18%. This transition complies with pharmaceutical clients' technical adsorption standards for VOC elimination, thus bolstering the India activated carbon market dynamics and trends. These production technologies, which are precision-controlled, enable manufacturers to design pore structures to exact specifications, serving high-volume market segments such as API production and electronics wastewater treatment, where purity and consistency are mission-critical.
The EMR’s report titled “India Activated Carbon Market Report and Forecast 2026-2035” offers a detailed analysis of the market based on the following segments:
Market Breakup by Product Type
Key Insight: Granular Activated Carbon (GAC) is gaining the most traction, particularly after the launch of GAC-01 by Organic Recycling Systems in May 2024, derived from coconut shell biomass for advanced water treatment. Pelletized carbon is growing in air filtration in car and pharmaceutical cleanrooms with low dust levels. PAC demand is increasing in the food processing industry for decolorization, particularly in sugar mills in Uttar Pradesh, whose production grew by 4.5% during 2023–2024, according to the Ministry of Consumer Affairs.
Market Breakup by Application
Key Insight: Water purification dominant application growth, particularly under Jal Jeevan Mission, which plans to supply tap water to 192 million households by 2026. Activated carbon is utilized for the elimination of organic matter and pesticides in rural drinking water. In gas purification, pelletized carbon is increasingly being utilized in VOC recovery systems in Gujarat's petrochemical belts, thus boosting the India activated carbon industry revenue. Extraction of metals is growing with Hindustan Zinc bringing in activated carbon in their gold recovery units. Activated charcoal capsules are increasing in usage in medicine, especially in OTC gastrointestinal treatments.
Market Breakup by End Use
Key Insight: Water treatment remains dominant, bolstered by rising investments in municipal treatment plants in Tamil Nadu and Karnataka. Food and beverages industry is witnessing demand from drink manufacturers such as Parle Agro and PepsiCo for use of PAC in stabilizing colors and flavors. Medical expansion is propelled by wound dressings and activated carbon masks with a 6.3% YoY increase in domestic sales, according to NPPA. The transportation industry is incorporating pelletized carbon into cabin filters for emission management, particularly after the implementation of BS-VI norms in 2020. Industrial processing applications are increasing in Maharashtra's textile centers for dye effluent treatment.
Market Breakup by Region
Key Insight: South India dominates due to the availability of coconut shells in Tamil Nadu and Kerala. Tamil Nadu-based Velcarbon raised exports by 12% YoY in FY24, aided by new biomass carbonization facilities. West India, particularly Gujarat, enjoys the advantage of export port proximity and a high output of chemicals, accounting for 46.16% of chemical exports in FY25, thus augmenting the India activated carbon regional growth. North India is growing considerably, with more installations of industrial water purifiers in NCR manufacturing units. East India experiences moderate but increasing demand due to coal-based carbon usage in Jharkhand and West Bengal, supported by raw material proximity and thermal power stations.
|
CAGR 2026-2035 - Market by |
Region |
| South India |
5.0% |
| East India |
4.3% |
| West India |
XX% |
| North India |
XX% |
By Product Type, Granular Activated Carbon (GAC) Secures the Largest Market Share
Granular Activated Carbon is the most popular product that has significantly added to the India activated carbon market value. This product is extensively used in water and air purification applications. It has a large surface area and a pore volume which makes it effective in adsorbing many contaminants. GAC is preferred because it can be reused, making it a cost-effective option for usage in large-scale operations. For example, In May 2024, Organic Recycling Systems Ltd launched GAC-01, a biomass-derived granular activated carbon from coconut shells, designed for water treatment, enhancing adsorption efficiency and promoting eco-friendly waste utilization.
Extruded or Pelletized Activated Carbon is the fastest-growing subsegment that has gained major momentum in terms of India activated carbon market development because of its high mechanical strength and homogeneous particle size. These features make it very suitable for gas phase applications, including air purification and industrial gas treatment. The increase in the demand for pelletized activated carbon is lifted from the industrial hazard in searching for efficient means of gas filtration.
By Application, Water Purification Leads in Terms of the Market Revenue
In India, activated carbon is increasingly used for advanced water purification, particularly in removing emerging contaminants like PFOS and PFOA from municipal supplies. Companies such as Clean Carbon and AllCarbon produce specialized grades for industrial effluent treatment in pharmaceutical and textile sectors. Its use in point-of-use home filters has surged in urban areas to eliminate VOCs and chlorine. Moreover, under the Jal Jeevan Mission, activated carbon supports rural water safety, enhancing treatment capacity and regulatory compliance across sectors, thereby bolstering the India activated carbon market revenues.
The application segment that has been growing the fastest in the India activated carbon market is air purification, given the rising pollution levels in urban atmospheres. Activated carbon finds applications as an adsorbent in air filters, combined with expectorants and gas masks for harmful gases and odours. The increasing awareness about the air quality and health implications clearly indicates that the activated carbon is set to fuel demand in air purification systems. Recent developments include the integration of activated carbon in HVAC systems for commercial buildings, enhancing indoor air quality by trapping VOCs and airborne pollutants more efficiently.
By End Use, Water Treatment Dominates the Market Expansion
The water treatment segment accounts for the largest share in the India activated carbon market. The market experiences an increasing number of people and industries demand clean water. Catering to this surge in demand can be achieved through impurity-free treatment with activated carbon in both municipal and industrial uses. Activated carbon removal processes ensure water cleanup and comply with environmental standards.
The food and beverage industry has reportedly become the fastest-growing segment. Decolorizing, purifying, and removing impurities have all been done with activated carbon in sugar, juices, and alcoholic beverages. With an increasing number of processed and packaged food products, the developments in this sector are expected to expand the scope of activated carbon.
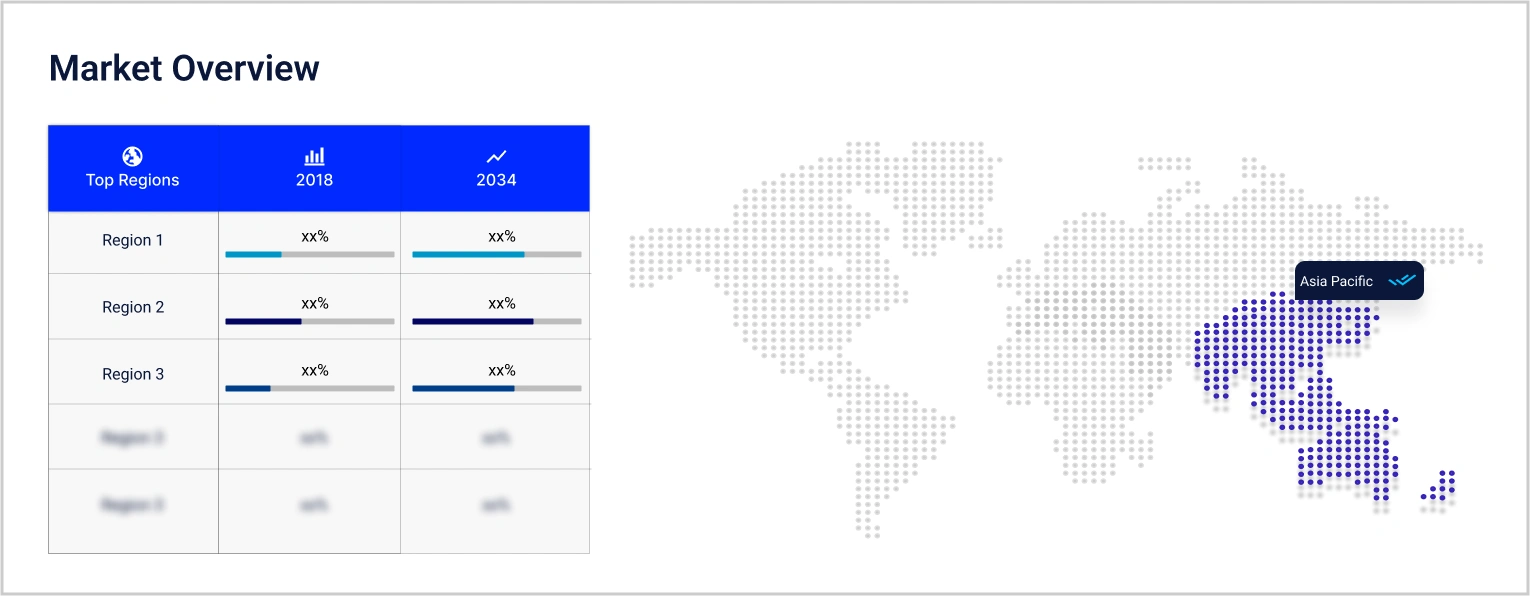
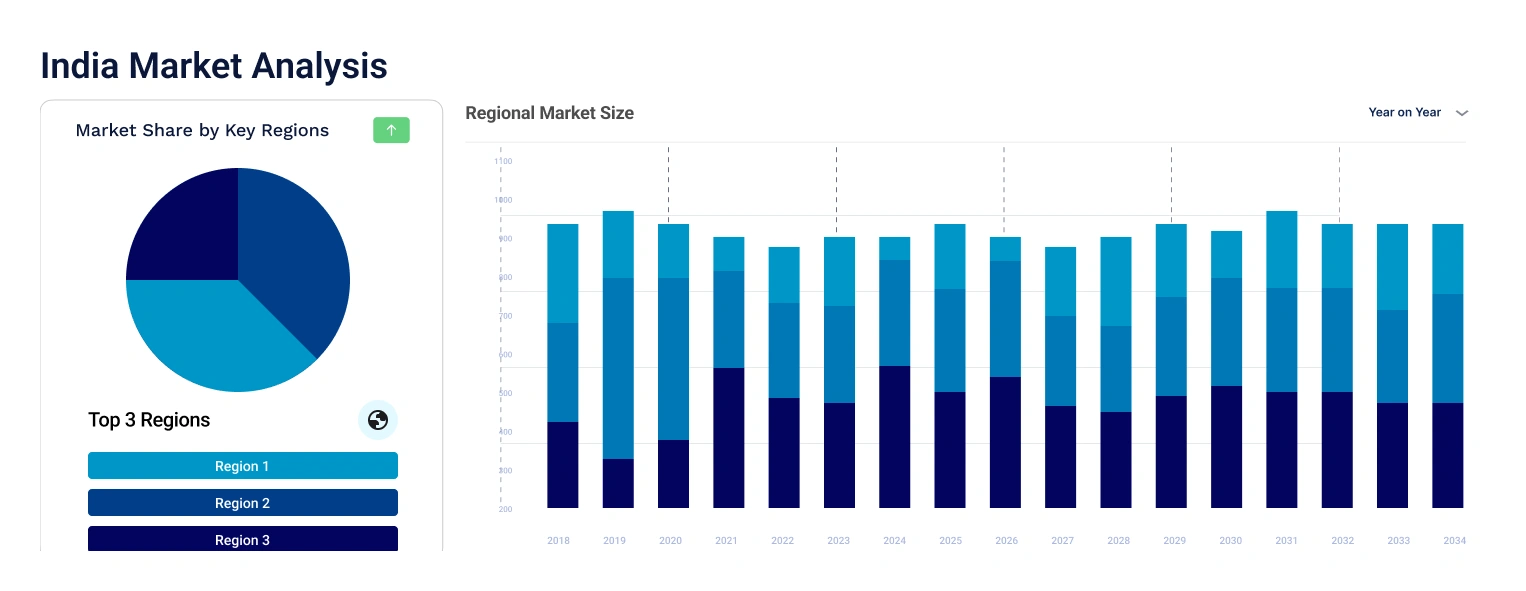
By Region, South India Accounts for the Dominant Share in the Market
South India, especially Tamil Nadu and Kerala, maintains a dominant position in India's activated carbon industry, mainly because of its abundant supply of coconut shells, which is one of the raw materials. Tamil Nadu's Velcarbon, for example, deals exclusively in coconut shell-based pelletized steam-activated carbon for both domestic and overseas markets. In 2023, India shipped about 141,861 tonnes of activated carbon worth $242 million, with much of this coming from southern states. Problems like the shortage of coconut shells due to climate change and heightened local consumption have increased production costs by 30%, affecting the region's competitiveness in exports and bolstering the India activated carbon market development.
Conversely, Western India, particularly Gujarat and Maharashtra, has seen the demand for activated carbon increase, buoyed by their strong chemical and pharma industries. Gujarat alone contributed 46.16% of the total chemical exports of India in FY 2024-25 worth $12,885 million. The well-developed chemical clusters of Dahej, Padra, and Ankleshwar in the state not only catalyze domestic absorption but also exports, due to access to ports. This industrial demand, combined with effective logistics, makes Western India a developing center for activated carbon consumption and distribution.
The India activated carbon market players continue to focus on sourcing raw materials like coconut shells and wood waste, with an emphasis on sustainability. Most of the India activated carbon companies are developing environmentally friendly high-performance products for the water treatment, food processing sectors that require high adsorption capacity. Key players in India's activated carbon market are increasingly focusing on innovative technologies to enhance sustainability and efficiency. For instance, Indcarb Activated Carbon Private Limited launched coconut shell-based inline water filters in May 2024, aiming to improve adsorption efficiency and cater to the growing demand for eco-friendly water purification solutions. Additionally, Takachar, co-founded by Vidyut Mohan, is transforming agricultural waste into activated carbon, providing a sustainable alternative to traditional methods and reducing air pollution caused by crop residue burning.
Founded in 1996 and based out of Tamil Nadu, India, Kalpaka Chemicals manufactures and exports activated carbon products. The company's area of focus is sustainable production methods. They provide a huge variety of activated carbon products for diverse applications.
CG Carbon is one of the leading manufacturers of activated carbons that was founded in 2020 in India. The core principles of the company are innovation and quality control that ensure the maximum fulfilment of varied customer needs from different industries.
Started in 2000, MICBAC India produces activated carbon products. The company has invested in research and development to optimize their products' performance to meet the changing market.
Carbon Activated Corporation, which started in 1993 in the Unites States, is a global supplier of activated carbon. The company has a strong base in India where it supplies a full line of activated carbon products to serve a number of applications.
*Please note that this is only a partial list; the complete list of key players is available in the full report. Additionally, the list of key players can be customized to better suit your needs.*
Other players in the India activated carbon market include Western Carbon & Chemicals, Raj Carbon, and Boyce Carbon, among others.
Download your free sample of the India Activated Carbon Market Report 2026-2035 to explore evolving trends, sustainable innovations, and market potential. Stay informed with in-depth forecasts, precise segmentation, and expert company profiles—only from Expert Market Research.


Upto 15% Off
USD
$2499 $2249
$3999 $3599
$4999 $4249
$5999 $5099


*While we strive to always give you current and accurate information, the numbers depicted on the website are indicative and may differ from the actual numbers in the main report. At Expert Market Research, we aim to bring you the latest insights and trends in the market. Using our analyses and forecasts, stakeholders can understand the market dynamics, navigate challenges, and capitalize on opportunities to make data-driven strategic decisions.*
Get in touch with us for a customized solution tailored to your unique requirements and save upto 35%!
In 2025, the India activated carbon market reached an approximate value of USD 251.89 Million.
The market is projected to grow at a CAGR of 4.50% between 2026 and 2035.
The key players in the market include Kalpaka Chemicals Private Limited, CG Carbon, MICBAC India, Carbon Activated Corporation, Western Carbon & Chemicals, Raj Carbon, and Boyce Carbon, among others.
Key strategies driving the market include concentrating on expanding production capacities, investing in R&D, and executing sustainable practices to meet the growing demand for activated carbon in India.
The major product types considered in the market report are Powdered Activated Carbons (PAC), Granular Activated Carbons (GAC), and Extruded or Pelletized Activated Carbon.
Explore our key highlights of the report and gain a concise overview of key findings, trends, and actionable insights that will empower your strategic decisions.
| REPORT FEATURES | DETAILS |
| Base Year | 2025 |
| Historical Period | 2019-2025 |
| Forecast Period | 2026-2035 |
| Scope of the Report |
Historical and Forecast Trends, Industry Drivers and Constraints, Historical and Forecast Market Analysis by Segment:
|
| Breakup by Product Type |
|
| Breakup by Application |
|
| Breakup by End Use |
|
| Breakup by Region |
|
| Market Dynamics |
|
| Competitive Landscape |
|
| Companies Covered |
|
Datasheet
One User
USD 2,499
USD 2,249
tax inclusive*
Single User License
One User
USD 3,999
USD 3,599
tax inclusive*
Five User License
Five User
USD 4,999
USD 4,249
tax inclusive*
Corporate License
Unlimited Users
USD 5,999
USD 5,099
tax inclusive*
*Please note that the prices mentioned below are starting prices for each bundle type. Kindly contact our team for further details.*
Flash Bundle
Small Business Bundle
Growth Bundle
Enterprise Bundle
*Please note that the prices mentioned below are starting prices for each bundle type. Kindly contact our team for further details.*
Flash Bundle
Number of Reports: 3
20%
tax inclusive*
Small Business Bundle
Number of Reports: 5
25%
tax inclusive*
Growth Bundle
Number of Reports: 8
30%
tax inclusive*
Enterprise Bundle
Number of Reports: 10
35%
tax inclusive*
How To Order

Select License Type
Choose the right license for your needs and access rights.

Click on ‘Buy Now’
Add the report to your cart with one click and proceed to register.

Select Mode of Payment
Choose a payment option for a secure checkout. You will be redirected accordingly.
Gain insights to stay ahead and seize opportunities.

Get insights & trends for a competitive edge.

Track prices with detailed trend reports.

Analyse trade data for supply chain insights.

Leverage cost reports for smart savings

Enhance supply chain with partnerships.

Connect For More Information
Our expert team of analysts will offer full support and resolve any queries regarding the report, before and after the purchase.
Our expert team of analysts will offer full support and resolve any queries regarding the report, before and after the purchase.
We employ meticulous research methods, blending advanced analytics and expert insights to deliver accurate, actionable industry intelligence, staying ahead of competitors.
Our skilled analysts offer unparalleled competitive advantage with detailed insights on current and emerging markets, ensuring your strategic edge.
We offer an in-depth yet simplified presentation of industry insights and analysis to meet your specific requirements effectively.


Share