

Consumer Insights
Uncover trends and behaviors shaping consumer choices today
Procurement Insights
Optimize your sourcing strategy with key market data
Industry Stats
Stay ahead with the latest trends and market analysis.
The global integrated quantum optical circuits market size attained a value of USD 1070.53 Million in 2025. The market is further expected to grow at a CAGR of 14.10% between 2026 and 2035, reaching a value of USD 4003.64 Million by 2035.
Compound Annual Growth Rate
14.1%
Value in USD Million
2026-2035
An integrated quantum optical circuit refers to a piece of equipment which combines multiple optical devices to form one photonic circuit. This type of technology works on the concept of light utilisation to facilitate signal processing and computing operations, making it useful for numerous quantum mechanics applications.
Read more about this report - REQUEST FREE SAMPLE COPY IN PDF
Read more about this report - REQUEST FREE SAMPLE COPY IN PDF
The EMR’s report titled “Integrated Quantum Optical Circuits Market Report and Forecast 2026-2035” offers a detailed analysis of the market based on the following segments:
Market Breakup by Material
Market Breakup by Application
Market Breakup by Region
The optical fibre communication segment, based on application, accounts for a healthy share of the integrated quantum optical circuits market. This can be attributed to the increasing applications of optical fibre communication technology across telecommunication companies to transmit telephone signals and internet communications. In addition, optical fibre communication has a vast range of applications across industries which include medical, defence, broadcasting, and lighting and decoration, among other fields, which is further invigorating the segment’s growth.


At a regional level, North America occupies a sizable share of the market for integrated quantum optical circuit, supported by the rising adoption of photonic integrated products (PIC)-based products as well as the widespread usage of optical fiber communication. The heightened collaborations and efforts by academic institutions and leading market players to un-circumscribe the boundaries of quantum technologies in the region is offering lucrative opportunities to the integrated quantum optical circuits market. Meanwhile, the Asia Pacific region is likely to be a fast-growing region in the forecast period, due to the advancements in IT infrastructure across emerging economies such as India and China.
The comprehensive EMR report provides an in-depth assessment of the market based on the Porter's five forces model along with giving a SWOT analysis. The report gives a detailed analysis of the key players in the global integrated quantum optical circuits market, covering their competitive landscape and latest developments like mergers, acquisitions, investments and expansion plans.
Ciena Corporation is a leading telecommunications company which provides routing systems, networking equipment, and software services. Founded in 1992, the company is currently headquartered in Maryland in the United States.
Coherent Corp. is a prominent semiconductor manufacturing company, the product portfolio of which contains networking devices and electronic materials catering to the demands of the industrial sector. The company was established in 1971 and is headquartered in Pennsylvania, United States.
Intel Corporation is a multinational corporation and technology company creating world-changing technology since 1968. Headquartered in California, United States, this company is a leading provider of artificial intelligence and internet networking services.
*Please note that this is only a partial list; the complete list of key players is available in the full report. Additionally, the list of key players can be customized to better suit your needs.*
Other market players include Infinera Corporation, TE Connectivity Ltd., Emcore Corporation, Lumentum Operations LLC, and Cisco Systems, Inc., among others.
Upto 15% Off
USD
$2499 $2249
$3999 $3599
$4999 $4249
$5999 $5099


*While we strive to always give you current and accurate information, the numbers depicted on the website are indicative and may differ from the actual numbers in the main report. At Expert Market Research, we aim to bring you the latest insights and trends in the market. Using our analyses and forecasts, stakeholders can understand the market dynamics, navigate challenges, and capitalize on opportunities to make data-driven strategic decisions.*
The market reached a value of USD 1070.53 Million in 2025.
The market is expected to grow at a CAGR of 14.10% between 2026 and 2035.
The market is estimated to witness a healthy growth between the forecast period of 2026-2035, reaching a value of USD 4003.64 Million by 2035.
The rapid development of data centres, growing demand for advanced and effective photonics, rising application of interconnected devices across various end use sectors, and lower transmission and greater efficiency offered by integrated quantum optical circuits, are the major drivers of the market.
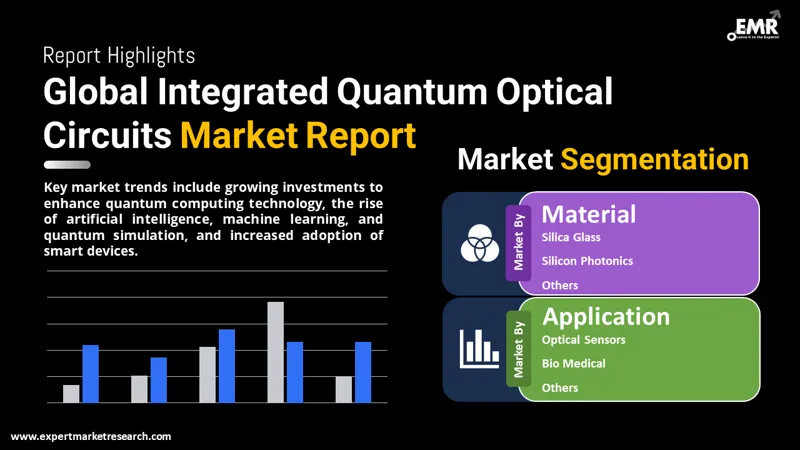
The key trends in the market include the increasing investments by market players to improve quantum computing technology, emergence of artificial intelligence, machine learning, and quantum simulation, and heightening adoption of smart devices.
Silica glass, silicon photonics, lithium niobate, indium phosphide, and gallium arsenide are the different materials of integrated quantum optical circuits in the market.
Optical fibre communication, quantum computing, optical sensors, and bio medical, among others, are the major applications of integrated quantum optical circuits.
Ciena Corporation, Coherent Corp., Intel Corporation, Infinera Corporation, TE Connectivity Ltd., Emcore Corporation, Lumentum Operations LLC, and Cisco Systems, Inc., among others, are the key players in the integrated quantum optical circuits market, according to the report.
Explore our key highlights of the report and gain a concise overview of key findings, trends, and actionable insights that will empower your strategic decisions.
| REPORT FEATURES | DETAILS |
| Base Year | 2025 |
| Historical Period | 2019-2025 |
| Forecast Period | 2026-2035 |
| Scope of the Report |
Historical and Forecast Trends, Industry Drivers and Constraints, Historical and Forecast Market Analysis by Segment:
|
| Breakup by Material |
|
| Breakup by Application |
|
| Breakup by Region |
|
| Market Dynamics |
|
| Competitive Landscape |
|
| Companies Covered |
|
Datasheet
One User
USD 2,499
USD 2,249
tax inclusive*
Single User License
One User
USD 3,999
USD 3,599
tax inclusive*
Five User License
Five User
USD 4,999
USD 4,249
tax inclusive*
Corporate License
Unlimited Users
USD 5,999
USD 5,099
tax inclusive*
*Please note that the prices mentioned below are starting prices for each bundle type. Kindly contact our team for further details.*
Flash Bundle
Small Business Bundle
Growth Bundle
Enterprise Bundle
*Please note that the prices mentioned below are starting prices for each bundle type. Kindly contact our team for further details.*
Flash Bundle
Number of Reports: 3
20%
tax inclusive*
Small Business Bundle
Number of Reports: 5
25%
tax inclusive*
Growth Bundle
Number of Reports: 8
30%
tax inclusive*
Enterprise Bundle
Number of Reports: 10
35%
tax inclusive*
How To Order

Select License Type
Choose the right license for your needs and access rights.

Click on ‘Buy Now’
Add the report to your cart with one click and proceed to register.

Select Mode of Payment
Choose a payment option for a secure checkout. You will be redirected accordingly.
Strategic Solutions for Informed Decision-Making
Gain insights to stay ahead and seize opportunities.

Get insights & trends for a competitive edge.

Track prices with detailed trend reports.

Analyse trade data for supply chain insights.

Leverage cost reports for smart savings

Enhance supply chain with partnerships.

Connect For More Information
Our expert team of analysts will offer full support and resolve any queries regarding the report, before and after the purchase.
Our expert team of analysts will offer full support and resolve any queries regarding the report, before and after the purchase.
We employ meticulous research methods, blending advanced analytics and expert insights to deliver accurate, actionable industry intelligence, staying ahead of competitors.
Our skilled analysts offer unparalleled competitive advantage with detailed insights on current and emerging markets, ensuring your strategic edge.
We offer an in-depth yet simplified presentation of industry insights and analysis to meet your specific requirements effectively.


