

Consumer Insights
Uncover trends and behaviors shaping consumer choices today
Procurement Insights
Optimize your sourcing strategy with key market data
Industry Stats
Stay ahead with the latest trends and market analysis.

The global logistics market size was valued at USD 11.97 Trillion in 2025. The industry is expected to grow at a CAGR of 6.30% during the forecast period of 2026-2035 to reach a valuation of USD 22.05 Trillion by 2035.
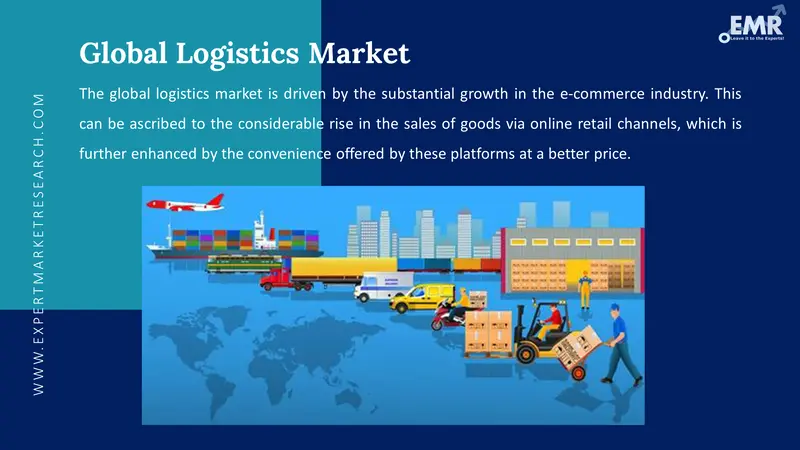
The global logistics market is a backbone of international trade and commerce, facilitating the movement of goods across countries and continents. Its significance lies in enabling supply chain efficiency, reducing delivery times, and lowering operational costs for businesses. As per the data by World Trade Organization (WTO), global merchandise trade volume grew 2.6% in 2024 and is expected to grow 3.3% in 2025. With globalisation and e-commerce growth, logistics has become essential for meeting consumer expectations of fast, reliable, and cost-effective delivery. This sector supports multiple industries, from manufacturing to retail, and directly influences economic development and competitiveness worldwide.
Read more about this report - REQUEST FREE SAMPLE COPY IN PDF
Additionally, investments in roads, railways, aviation, shipping, and inland waterways play a crucial role in boosting the demand of logistics market. In May 2025, in Africa, Ivory Coast's port operator is investing over €60 million to develop inland logistics hubs in regions like Ferkessedougou, Bouaké, and San Pedro. This initiative seeks to decentralize logistics operations, alleviate congestion at the Abidjan port, and strengthen the country's role as a regional transport hub for landlocked nations.
Governments all throughout the world are starting to impose emission limits, carbon taxes, and incentives for the adoption of environmentally friendly technologies. The Carbon Border Adjustment Mechanism (CBAM), which levies a carbon tax on imported commodities based on their carbon intensity, was put into place by the European Union in 2023. Other factors that are predicted to positively influence the logistics market revenue include constant technological advancements, the integration of biometrics, increasing international trade agreements, Bluetooth, driverless vehicle, GPS, and drone delivery.
Base Year
Historical Period
Forecast Period
Compound Annual Growth Rate
6.3%
Value in USD Trillion
2026-2035
*this image is indicative*
Automation and artificial intelligence are supporting the growth of logistics industry by streamlining operations, enhancing efficiency, reducing costs, and meeting the demands of an increasingly complex global supply chain, and boosting the logistics market growth. Companies like Amazon are utilising AI-powered robots in their warehouses, which not only improves operational efficiency but also enhances the overall customer experience through faster and more accurate delivery. By 2025, warehouse automation and robotics will increase productivity by 25% to 70% and reduce operating costs by 20% to 40%.
A prime example of AI integration in logistics is UPS's ORION system, which optimises delivery routes for its fleet. The system processes around 250 million address data point every day, optimizing routes and saving the company up to 10 million gallons of fuel annually. This not only cuts costs but also reduces emissions, aligning with sustainability goals.
Companies like UPS are investing in electric vehicles and renewable energy sources to reduce their carbon footprint. The adoption of sustainable logistics practices not only contributes to a greener environment but also enhances a company's reputation and competitive edge, thus impacting the logistics demand forecast.
One of the most notable examples is Maersk, the world’s largest shipping company, which has committed to achieving net-zero carbon emissions by 2040. As part of this initiative, Maersk ordered 18 carbon-neutral methanol-powered ships in 2023. This initiative alone is expected to reduce 1 million tonnes of CO2 emissions annually. Additionally, the company has committed to using sustainable biofuels and plans to further invest in renewable energy projects.
Data analytics is revolutionising logistics management by enabling companies to optimise routes, predict demand, and enhance overall efficiency, thus increase the logistics market share. FedEx uses predictive analytics to forecast package volumes during peak seasons, allowing them to allocate resources effectively.
Predictive analytics is used by Amazon, for example, to improve inventory control throughout its extensive worldwide network of fulfillment centers. Amazon uses machine learning algorithms to estimate product demand with great accuracy, allowing for the maintenance of ideal stock levels. With its Prime Now service, which guarantees delivery in less than two hours, Amazon has been able to lower warehouse costs and increase delivery times due to this technique.
Last-mile delivery, the final step of a product's journey to the customer, is undergoing significant innovations. As per logistics industry analysis, companies like Nuro and Waymo are pioneering autonomous delivery services, offering contactless delivery for goods. Nuro, for example, has been granted permission by the US Department of Transportation in February 2022 to operate autonomous delivery vehicles, a breakthrough for the logistics market.
Urban deliveries are changing because of AI-powered delivery bots, such as those employed by FedEx Roxo and Starship Technologies. These autonomously navigating robots can deliver things to customers' doorsteps around cities. The scalability of this technology was demonstrated in 2023 when Starship's delivery robots achieved a milestone of 5 million autonomous deliveries worldwide.
E-commerce growth continues to be a major force driving the logistics market worldwide. As online shopping surges, logistics providers face rising demand for fast, reliable delivery services, especially last-mile delivery, which is often the most complex and costly part of the supply chain.
The impact of e-commerce on the logistics market is also evident in the strategies of major players. For instance, Sea Limited, a Singapore-based e-commerce company operating Shopee, has seen its stock rise by over 34% in 2025. The company has invested in its in-house logistics service, SPX Express, to improve delivery efficiency. Nearly 50% of SPX Express orders are now delivered within two days of order placement, reflecting the company's commitment to enhancing its logistics capabilities in response to the growing e-commerce market.

Read more about this report - REQUEST FREE SAMPLE COPY IN PDF
The Expert Market Research’s report titled “Logistics Market Report and Forecast 2026-2035” offers a detailed analysis of the market based on the following segments:
Market Breakup by Model Type
Key Insight: 1PL refers to companies that manage their own logistics operations without outsourcing. This model is common among large manufacturers and retailers, such as Coca-Cola, which operates its own fleet and distribution centers to control the supply chain effectively. By handling logistics internally, these companies can streamline operations and reduce costs.
Market Breakup by Transportation Mode`
Key Insight: Roadways, with their extensive reach and cost-effective nature, hold a significant share in the logistics market. FedEx and UPS rely heavily on road transportation for their last-mile delivery services, ensuring efficient and timely delivery of packages to customers' doorsteps. The flexibility and accessibility of roadways make them a preferred choice for transporting goods.
Market Breakup by End User
Key Insight: In the food and beverages sector, efficient and timely transportation is crucial due to the perishable nature of goods. Temperature-controlled transportation ensures that products like fruits, dairy, and meat remain within required temperature ranges, preserving quality and safety. For instance, in May 2025, the Centre for Perishable Cargo at Ahmedabad Airport resumed operations after two years, providing dedicated facilities for temperature-sensitive exports like mangoes and dairy.
Market Breakup by Region
Key Insight: North America dominates the logistics market share as it boasts a robust economy, extensive manufacturing activities, and a thriving e-commerce sector. The United States, a key player in the region, benefits from well-developed transportation infrastructure, including advanced road networks, efficient rail systems, and modern air and maritime ports. This infrastructure supports the seamless movement of goods and services, contributing to the region's dominance. North American companies are leaders in integrating automation and AI into logistics. UPS, FedEx, and Amazon have invested heavily in AI and automation to optimise supply chains. UPS's ORION system helps optimise delivery routes, saving 10 million gallons of fuel annually.
3PL providers occupy a significant share in the market
3PL providers have the highest share in logistics market as they offer comprehensive logistics solutions, including transportation, warehousing, and inventory management. For example, DHL Supply Chain and XPO Logistics provide end-to-end supply chain services, allowing businesses to outsource their logistics functions. This model is increasingly popular as companies seek to enhance efficiency and focus on core business activities.
2PL involves transportation service providers that do not handle warehousing or inventory management. Companies like FedEx and UPS exemplify this model by offering freight and shipping services for goods. They focus on the transportation aspect, allowing businesses to rely on specialised carriers for efficient delivery without managing the entire supply chain.
Seaways mode driven by expanding trade routes and efficiency
Seaways, characterised by their ability to transport large volumes of goods over long distances, are experiencing notable growth in the logistics market. The expansion of trade routes, such as the Panama Canal, has facilitated faster and more cost-effective transportation of goods between continents. In the fiscal year 2024, the canal facilitated 9,944 transits, handling 423 million tons of cargo. Container ships, chemical tankers, and bulk carriers constituted the majority of these transits, reflecting the canal's capacity to support diverse shipping needs.
Meanwhile, while air transportation is costlier than other modes, its ability to reduce transit times significantly makes it indispensable for industries requiring expedited logistics services. DHL Express and FedEx Express leverage air transportation to deliver time-sensitive, high-value, and urgent shipments worldwide within tight deadlines.
Healthcare Industry Dependence on Efficient Logistics
As per logistics market analysis, the healthcare industry relies heavily on efficient logistics for the transportation of pharmaceuticals, medical devices, and equipment. Companies such as UPS Healthcare, DHL Life Sciences, and Kuehne + Nagel specialise in healthcare logistics, providing services like cold chain management and regulatory compliance to ensure the safe and timely delivery of critical medical supplies.
In the chemicals sector, logistics providers like CMA CGM, CEVA Logistics, and DHL Chemicals offer expertise in handling hazardous materials, ensuring compliance with international regulations and safety standards. Effective risk management strategies, including proper labeling, packaging, and handling protocols, are essential to mitigate potential hazards and ensure the safe transportation of chemicals.


Asia Pacific Logistics Market Accelerates with Infrastructure Growth and E-Commerce Expansion
The Asia Pacific region emerges as a rapidly growing market in the global logistics landscape. China, with its vast manufacturing base and booming e-commerce industry, stands out as a key player in the logistics market in Asia Pacific. The region's focus on enhancing transportation infrastructure, such as high-speed rail networks and modern port facilities, further propels its logistics sector forward. China's logistics industry reached a record-breaking USD 49.42 trillion in 2024, with the establishment of 151 national logistics hubs and over 2,500 overseas warehouses. Markets like Japan, India, and Southeast Asian countries are also witnessing increased trade activities, creating a surge in demand for logistics services.
The strict laws and growing consumer demand for sustainability have made Europe a global leader in green logistics and support the logistics market value. By pushing logistics firms to embrace green practices, the European Union's Green Deal seeks to achieve climate neutrality by 2050. In 2023, DHL increased the number of electric delivery cars in its fleet, in line with its commitment to reduce carbon emissions to zero by the year 2050. In 2023, the region demonstrated its commitment to sustainability and lowering emissions from international logistics operations with the adoption of the EU's Carbon Border Adjustment Mechanism (CBAM).
The global logistics market is highly competitive, with leading companies like DHL, UPS, and FedEx continually innovating to maintain their edge. These firms leverage technology, such as automation and AI-driven solutions, to enhance operational efficiency. For instance, FedEx has integrated advanced tracking systems to improve delivery accuracy. Additionally, companies are enhancing sustainability practices by adopting green logistics initiatives, like DHL's commitment to achieving zero emissions by 2050. Expanding global reach is another focus, as seen in partnerships like Evri and JD.com, which aim to facilitate cross-border e-commerce. Investments in data-driven solutions further enable these companies to adapt to evolving customer demands.
CMA CGM Group (CEVA Logistics AG) was founded in 2005 and is based in Cournon-d'Auvergne, France. It offers comprehensive supply chain management, logistics, and freight forwarding services. CEVA is recognised for its expertise in optimising supply chains for businesses across various industries.
Deutsche Post AG was founded in 1995 and has its headquarters in Bonn, Germany. It is a prominent player in the postal services, logistics, and parcel delivery sectors. The company's extensive network and focus on technological advancements have positioned it as a leader in the global logistics industry.
Kuehne + Nagel International AG was established in 1890 and is headquartered in Switzerland, United Kingdom. Specialising in logistics, supply chain management, and freight forwarding services, company is renowned for its commitment to sustainability and providing customer-specific tailored solutions.
FedEx Corporation, founded in 1973 and headquartered in the United States is a global leader in shipping, transportation, and e-commerce services, connects people and possibilities worldwide through its integrated business applications. Renowned for exceptional service, FedEx Express, the world's largest cargo airline, serves over 220 countries with time-definite air-ground services.
*Please note that this is only a partial list; the complete list of key players is available in the full report. Additionally, the list of key players can be customized to better suit your needs.*
Other key players in the global logistics market include Evri Limited, Schenker AG, C.H. Robinson Worldwide Inc., Nippon Express Co., Ltd., Kintetsu World Express Inc., TSI Group Inc., XPO, Inc., United Parcel Service, Inc., A.P. Møller – Mærsk A/S, Expeditors International of Washington Inc., GXO Logistics, Inc., and DSV A/S, among others.
Discover key trends driving the Global Logistics Market 2026 and beyond. Download a free sample or contact us today to explore detailed insights and strategic opportunities to enhance your supply chain and logistics operations.
Middle East and Africa Logistics Market
North America Logistics Market


Upto 15% Off
USD
$4399 $3959
$2999 $2699
$5599 $4759
$6659 $5660


*While we strive to always give you current and accurate information, the numbers depicted on the website are indicative and may differ from the actual numbers in the main report. At Expert Market Research, we aim to bring you the latest insights and trends in the market. Using our analyses and forecasts, stakeholders can understand the market dynamics, navigate challenges, and capitalize on opportunities to make data-driven strategic decisions.*
Get in touch with us for a customized solution tailored to your unique requirements and save upto 35%!
In 2025, the market reached an approximate value of USD 11.97 Trillion.
The market is assessed to grow at a CAGR of 6.30% between 2026 and 2035.
The market is estimated to witness healthy growth in the forecast period of 2026-2035 to reach a value of around USD 22.05 Trillion by 2035.
The growing retail sector, particularly e-commerce, rising disposable incomes, rapid urbanisation, and growing technological advancements are factors expected to aid the market growth.
Key trends aiding market expansion include the increased deployment of automated material handling equipment, growing preference for green logistics solutions, and the rising popularity of drone delivery within the industry.
Regions considered in the market are North America, Europe, the Asia Pacific, Latin America, and the Middle East and Africa.
2 PL is the leading model type in the industry.
The transportation mode segment is led by roadways.
The various end users are manufacturing, consumer goods and retail, food and beverages, IT hardware and telecom, healthcare, chemicals, construction, automotive, oil and gas, among others.
Key players in the market are CMA CGM Group (CEVA Logistics AG), Deutsche Post AG, Kuehne + Nagel International AG, FedEx Corporation, Schenker AG, C.H. Robinson Worldwide Inc., Nippon Express Co., Ltd., Kintetsu World Express Inc., TSI Group Inc., XPO, Inc., United Parcel Service, Inc., A.P. Møller – Mærsk A/S, Expeditors International of Washington Inc., GXO Logistics, Inc., Evri and DSV A/S, among others.
Explore our key highlights of the report and gain a concise overview of key findings, trends, and actionable insights that will empower your strategic decisions.
| REPORT FEATURES | DETAILS |
| Base Year | 2025 |
| Historical Period | 2019-2025 |
| Forecast Period | 2026-2035 |
| Scope of the Report |
Historical and Forecast Trends, Industry Drivers and Constraints, Historical and Forecast Market Analysis by Segment:
|
| Breakup by Model Type |
|
| Breakup by Transportation Mode |
|
| Breakup by End User |
|
| Breakup by Region |
|
| Market Dynamics |
|
| Competitive Landscape |
|
| Companies Covered |
|
Single User License
One User
USD 4,399
USD 3,959
tax inclusive*
Datasheet
One User
USD 2,999
USD 2,699
tax inclusive*
Five User License
Five User
USD 5,599
USD 4,759
tax inclusive*
Corporate License
Unlimited Users
USD 6,659
USD 5,660
tax inclusive*
*Please note that the prices mentioned below are starting prices for each bundle type. Kindly contact our team for further details.*
Flash Bundle
Small Business Bundle
Growth Bundle
Enterprise Bundle
*Please note that the prices mentioned below are starting prices for each bundle type. Kindly contact our team for further details.*
Flash Bundle
Number of Reports: 3
20%
tax inclusive*
Small Business Bundle
Number of Reports: 5
25%
tax inclusive*
Growth Bundle
Number of Reports: 8
30%
tax inclusive*
Enterprise Bundle
Number of Reports: 10
35%
tax inclusive*
How To Order

Select License Type
Choose the right license for your needs and access rights.

Click on ‘Buy Now’
Add the report to your cart with one click and proceed to register.

Select Mode of Payment
Choose a payment option for a secure checkout. You will be redirected accordingly.
Gain insights to stay ahead and seize opportunities.

Get insights & trends for a competitive edge.

Track prices with detailed trend reports.

Analyse trade data for supply chain insights.

Leverage cost reports for smart savings

Enhance supply chain with partnerships.

Connect For More Information
Our expert team of analysts will offer full support and resolve any queries regarding the report, before and after the purchase.
Our expert team of analysts will offer full support and resolve any queries regarding the report, before and after the purchase.
We employ meticulous research methods, blending advanced analytics and expert insights to deliver accurate, actionable industry intelligence, staying ahead of competitors.
Our skilled analysts offer unparalleled competitive advantage with detailed insights on current and emerging markets, ensuring your strategic edge.
We offer an in-depth yet simplified presentation of industry insights and analysis to meet your specific requirements effectively.


Share