Explore Our Diverse Range Of Offerings
From detailed reports to experts services offered in 15+ Industry Domains
Report
Press Release
Blogs
Industry Statistics
Add 2 More Reports For 20% off

Middle East and Africa Mobile Payment Market Report Overview

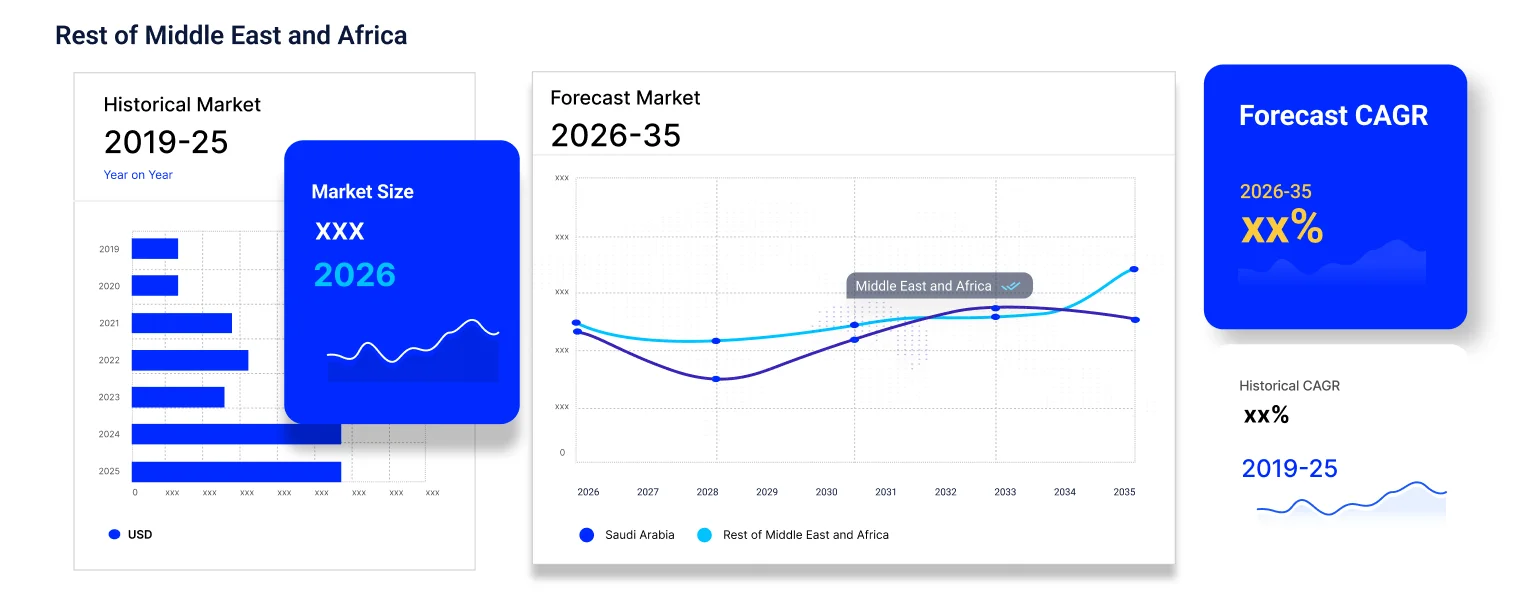
The Middle East and Africa mobile payment market size is projected to grow at a CAGR of 27.80% between 2026 and 2035. The market is being driven by the rising focus of organisations to digitalise their financial operations.

Q1 2026 Market Updates

Geopolitical Impact of Iran, US, and Israel War on the Middle East and Africa Mobile Payment Market

United States: The Middle East and Africa Mobile Payment Market, a key segment of the global economy, is experiencing a complex operating environment in Q1 2026 as a direct consequence of the US-Israel-Iran war. The active conflict zone has seen Brent crude surge above USD 120 per barrel, the Strait of Hormuz effectively closed since March 4, Qatar LNG halted, Saudi Aramco's Ras Tanura refinery struck, and FDI inflows to Saudi Arabia down 60-70% in Q1 2026. Saudi Arabia's Vision 2030 projects are facing near-term disruption with NEOM contracts cancelled and FDI inflows down 60-70% in Q1 2026. However, the conflict simultaneously reinforces the strategic urgency of diversification away from petroleum dependence. The GCC is experiencing a grocery supply emergency with 70% of food imports disrupted. Retailers like Lulu are airlifting staples. The broader GCC economic model is under severe stress. Near-term project disruptions are severe, but the conflict simultaneously reinforces Saudi Arabia's long-term Vision 2030 investment case for diversification away from petroleum dependence.

Iran: Iran's direct role in the conflict makes its domestic market entirely non-functional. Beyond the destruction of the two largest steel plants (Khuzestan Steel and Mobarakeh) and extensive power infrastructure damage, Iran's attempt to internationalise the cost of war through the Strait of Hormuz blockade has caused over USD 1 trillion in annualised global economic losses. The Iranian rial has collapsed and domestic inflation, already above 40% pre-war, is accelerating sharply. All commercial activity in the Middle East and Africa Mobile Payment sector has ceased.

Israel: Israel's Middle East and Africa Mobile Payment sector is operating under a declared state of emergency with 70,000 additional reservists called up and the Israeli Air Force conducting sustained operations. Consumer and commercial activity has contracted sharply. The post-conflict reconstruction cycle - encompassing damaged civilian infrastructure, industrial facilities, and residential buildings - will generate significant recovery demand across multiple sectors once hostilities cease. Key Israeli technology and innovation hubs continue to operate in modified forms, maintaining the country's long-term competitive capabilities.

Key Takeaways

Government

  • Saudi financial regulators should monitor systemic risk from conflict-driven commodity and energy price inflation, assessing whether elevated oil and gas prices are creating financial stability risks in sectors with high leverage and fuel cost exposure.
  • Central banks should communicate clearly on monetary policy trajectories given the competing pressures of conflict-driven inflation and recession risk, providing forward guidance that reduces financial market uncertainty.
  • Insurance regulators should monitor war-risk premium escalation in the Gulf region, ensuring that the doubling and tripling of marine and aviation war-risk premiums does not create coverage gaps for legitimate commercial operations.

Market

  • Conflict-driven commodity and energy inflation is complicating monetary policy across all major central banks, with the Fed, ECB, and Bank of Japan facing a policy dilemma between fighting inflation and preventing recession.
  • The doubling and tripling of war-risk insurance premiums in Gulf waters is creating financial service demand from energy companies, shipping firms, and traders seeking coverage for disrupted Middle Eastern operations.
  • The conflict is creating a wealth transfer from energy-importing to energy-exporting nations, with significant implications for capital flows, investment returns, and credit quality across global financial markets.

Procurement

  • Financial services procurement teams should review vendor contracts that include Middle Eastern service delivery components, ensuring business continuity plans are activated for services provided from Gulf-region operations centres.
  • Insurance buyers should review war-risk coverage across all business lines with Gulf-region exposure, assessing whether policy triggers and coverage limits are adequate for the current elevated risk environment.
  • Treasury and risk management teams should update financial risk models to incorporate sustained elevated energy prices, elevated inflation, and reduced global trade volumes as baseline scenarios for 2026 financial planning.
2025

Base Year

2019-2025

Historical Period

2026-2035

Forecast Period

  • 94% of Kenya’s population uses mobile money to make payments.

  • Retailers offering cashless payment systems report higher profit margins in the region.

  • The number of mobile money users in Africa recorded a y-o-y surge of 12%, reaching 562 million in 2020.

Compound Annual Growth Rate

27.8%

2026-2035


*this image is indicative*

Many Middle Eastern nations are focusing on digitalising their financial infrastructure and banking services. For instance, in October 2023, Al Etihad Payments, an organisation operating under the Central Bank of UAE, launched an instant payment platform called Aani. It facilitates cashless transactions through people’s phone numbers, digital cheques, e-debit authorisation, and QR codes. Various licensed financial institutions, such as the Emirates NBD and Mashreq Bank are a part of this scheme. This is expected to contribute to the Middle East and Africa mobile payment market expansion.

Moreover, the adoption of digital wallets for making payments on e-commerce websites witnessed a surge of 1% in 2022 in the UAE, reaching a value of 24%. This is expected to drive the market growth over the forecast period.

Telecommunication companies are playing a key role in the adoption of digital wallets in Africa, where a 15% year-on-year increase in the number of virtual wallet transactions was recorded in 2020. Besides, the total value of digital wallet transactions amounted to $495 billion in 2020, recording a year-on-year increase of 23%. This is expected to fuel the Middle East and Africa mobile payment market growth.

According to the World Bank, 6% of the Moroccan population uses mobile money. With the increasing preference for cashless transactions, which guarantee safety and consumer hygiene, the market is expected to witness significant growth  in the forecast period.

Market Segmentation

Middle East and Africa Mobile Payment Market Report and Forecast 2026-2035 offers a detailed analysis of the market based on the following segments:

Market Breakup by Technology

  • Direct Mobile Billing
  • Near Field Communication
  • Mobile Web Payment
  • SMS
  • Mobile Application
  • Others

Market Breakup by Payment Type

  • B2B
  • B2C
  • B2G

Market Breakup by Location

  • Remote Payment
  • Proximity Payment

Market Breakup by End Use

  • BFSI
  • Healthcare
  • IT and Telecom
  • Media and Entertainment
  • Retail and E-Commerce
  • Transportation
  • Others

Market Breakup by Country

  • Saudi Arabia
  • United Arab Emirates
  • Nigeria
  • South Africa
  • Others

Competitive Landscape

  • Orange S.A.
  • Uber Technologies Inc. (CareemPay)
  • HyperPay INC
  • PalmPay Limited
  • Fawry for Banking Technology and Electronic Payments S.A.E (MyFawry)
  • MTN Group Ltd. (MoMoPay)
  • SADAD
  • Payit
  • Saudi Digital Payment Company
  • Klip
  • Others

*While we strive to always give you current and accurate information, the numbers depicted on the website are indicative and may differ from the actual numbers in the main report. At Expert Market Research, we aim to bring you the latest insights and trends in the market. Using our analyses and forecasts, stakeholders can understand the market dynamics, navigate challenges, and capitalize on opportunities to make data-driven strategic decisions.*

Looking for specific insights?

Get in touch with us for a customized solution tailored to your unique requirements and save upto 35%!

Key Questions Answered in the Report

The market is projected to grow at a CAGR of 27.80% between 2026 and 2035.

The different technologies used for mobile payment include direct mobile billing, near field communication, mobile web payment, SMS, and mobile application, among others.

The different payment types in the market include B2B, B2C, and B2G.

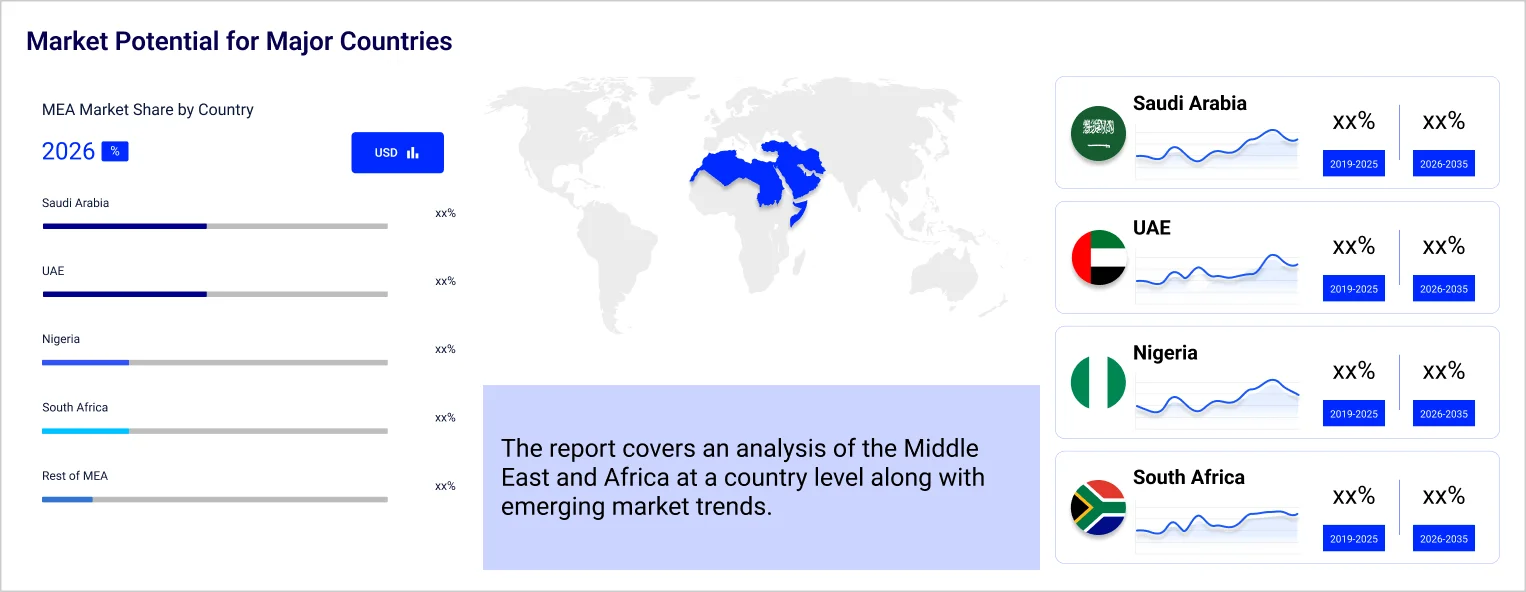
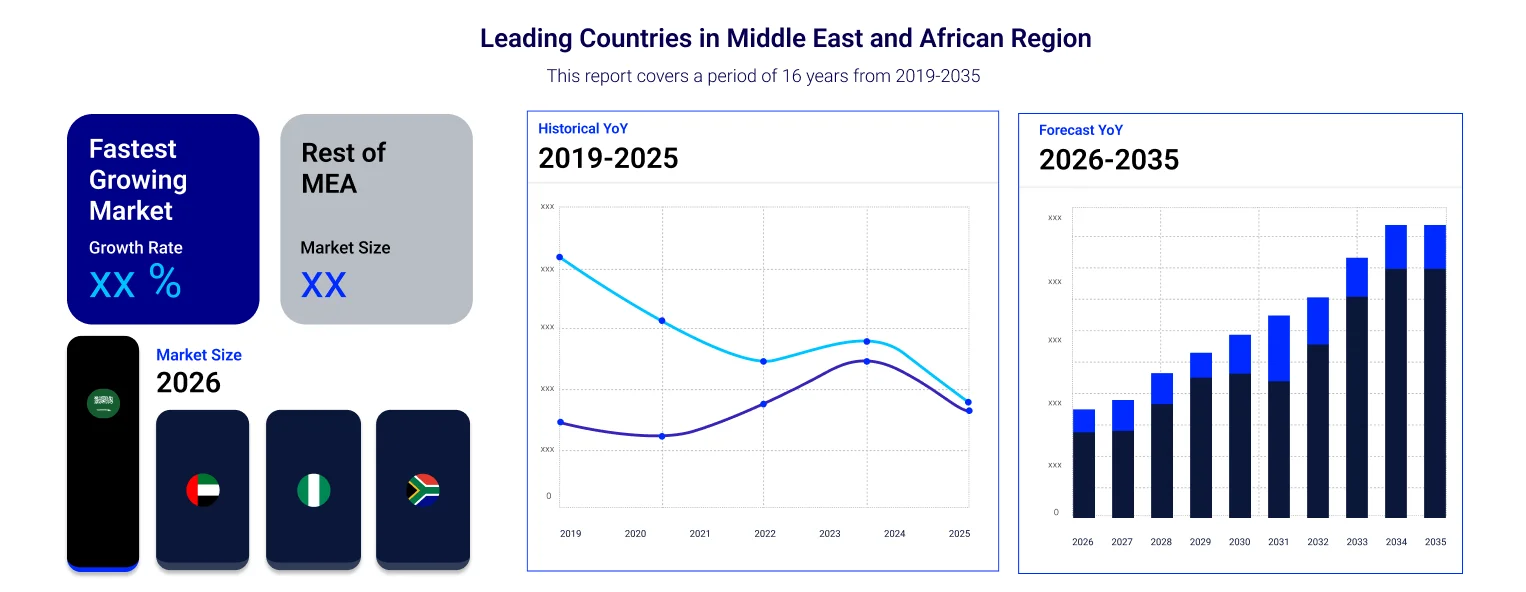
The major countries in the market include Saudi Arabia, the United Arab Emirates, Nigeria, and South Africa, among others.

The key market players are Orange S.A., Uber Technologies Inc. (CareemPay), HyperPay INC, PalmPay Limited, Fawry for Banking Technology and Electronic Payments S.A.E (MyFawry), MTN Group Ltd. (MoMoPay), SADAD, Payit, Saudi Digital Payment Company, and Klip, among others.

Report Summary

Explore our key highlights of the report and gain a concise overview of key findings, trends, and actionable insights that will empower your strategic decisions.

Key Highlights of the Report

Please note that the figures mentioned in the description serve as estimates and may vary from the actual figures presented in the final report.

REPORT FEATURES DETAILS
Base Year 2025
Historical Period 2019-2025
Forecast Period 2026-2035
Scope of the Report

Historical and Forecast Trends, Industry Drivers and Constraints, Historical and Forecast Market Analysis by Segment:

  • Technology
  • Payment Type
  • Location
  • End Use
  • Region
Breakup by Technology
  • Direct Mobile Billing
  • Near Field Communication
  • Mobile Web Payment
  • SMS
  • Mobile Application
  • Others
Breakup by Payment Type
  • B2B
  • B2C
  • B2G
Breakup by Location
  • Remote Payment
  • Proximity Payment
Breakup by End Use
  • BFSI
  • Healthcare
  • IT and Telecom
  • Media and Entertainment
  • Retail and E-Commerce
  • Transportation
  • Others
Breakup by Region
  • Saudi Arabia
  • United Arab Emirates
  • Nigeria
  • South Africa
  • Others
Market Dynamics
  • SWOT Analysis
  • Porter's Five Forces Analysis
  • Key Indicators for Demand
  • Key Indicators for Price
Competitive Landscape
  • Market Structure
  • Company Profiles
    • Company Overview
    • Product Portfolio
    • Demographic Reach and Achievements
    • Certifications
Companies Covered
  • Orange S.A.
  • Uber Technologies Inc. (CareemPay)
  • HyperPay INC
  • PalmPay Limited
  • Fawry for Banking Technology and Electronic Payments S.A.E (MyFawry)
  • MTN Group Ltd. (MoMoPay)
  • SADAD
  • Payit
  • Saudi Digital Payment Company
  • Klip
  • Others

Datasheet

10 % Off

USD

2,499

2,249

Single User License

10 % Off

USD

3,999

3,599

Five User License

15 % Off

USD

4,999

4,249

Corporate License

15 % Off

USD

5,999

5,099

Datasheet

One User

USD 2,499

USD 2,249

tax inclusive*

  • Selected Segments
  • Printing Restrictions
  • Excel Spreadsheet Delivered via Email
  • Full Report
  • Periodic Updates
  • Post Sales Analysts Support
  • Unlimited Prints

Single User License

One User

USD 3,999

USD 3,599

tax inclusive*

  • All Segments
  • Printing Restrictions
  • PDF Delivered via Email
  • Custom Report Layout
  • Post Sales Analysts Support
  • Periodic Updates
  • Unlimited Prints

Five User License

Five User

USD 4,999

USD 4,249

tax inclusive*

  • All Segments
  • Five Prints Available
  • PDF Delivered via Email
  • Limited Free Customization
  • Post Sales Analyst Support
  • Custom Report Layout
  • Periodic Updates
  • Unlimited Prints

Corporate License

Unlimited Users

USD 5,999

USD 5,099

tax inclusive*

  • All Segments
  • Unlimited Prints Available
  • PDF & Excel Delivery via Email
  • Limited Free Customization
  • Post Sales Analysts Support
  • Discount On Next Update
  • Custom Report Layout

*Please note that the prices mentioned below are starting prices for each bundle type. Kindly contact our team for further details.*

Bundle Type

Flash Bundle

20% OFF Number of Reports: 3

Small Business Bundle

25% OFF Number of Reports: 5

Growth Bundle

30% OFF Number of Reports: 8

Enterprise Bundle

35% OFF Number of Reports: 10
Overview
  • Life Time Access
  • Analyst Support Related to Report
  • PDF Version of the Report
  • Complimentary Excel Data Set
  • Free Analyst Hours
  • Complimentary Free 1 Month Subscription to Trade Data Base
  • Complimentary One Month Subscription to Price Database (Chemicals only)
  • Complimentary PPT Version of the Report
  • Complimentary License Upgrade
  • Complimentary Power BI Dashboards
  • Life Time Access
  • Analyst Support Related to Report
  • PDF Version of the Report
  • Complimentary Excel Data Set
  • Free Analyst Hours - 50 Hours
  • Complimentary Free 1 Month Subscription to Trade Data Base
  • Complimentary One Month Subscription to Price Database (Chemicals only)
  • Complimentary PPT Version of the Report
  • Complimentary License Upgrade
  • Complimentary Power BI Dashboards
  • Life Time Access
  • Analyst Support Related to Report
  • PDF Version of the Report
  • Complimentary Excel Data Set
  • Free Analyst Hours - 80 Hours
  • Complimentary Free 1 Month Subscription to Trade Data Base
  • Complimentary One Month Subscription to Price Database (Chemicals only)
  • Complimentary PPT Version of the Report
  • Complimentary License Upgrade
  • Complimentary Power BI Dashboards
  • Life Time Access
  • Analyst Support Related to Report
  • PDF Version of the Report
  • Complimentary Excel Data Set
  • Free Analyst Hours - 100 Hours
  • Complimentary Free 1 Month Subscription to Trade Data Base
  • Complimentary One Month Subscription to Price Database (Chemicals only)
  • Complimentary PPT Version of the Report
  • Complimentary License Upgrade
  • Complimentary Power BI Dashboards

*Please note that the prices mentioned below are starting prices for each bundle type. Kindly contact our team for further details.*

Flash Bundle

Number of Reports: 3

20%

tax inclusive*

  • 3 Reports Included
  • Life Time Acess
  • Analyst Support Related to Report
  • PDF Version of the Report
  • Free 1 Month Subscription to Trade Data Base
  • 1 Month Subscription to Price Database (Chemicals only)
  • Complimentary Excel Data Set
  • PPT Version of the Report
  • Power BI Dashboards
  • License Upgrade
  • Free Analyst Hours

Small Business Bundle

Number of Reports: 5

25%

tax inclusive*

  • 5 Reports Included
  • Life Time Acess
  • Analyst Support Related to Report
  • PDF Version of the Report
  • Complimentary Excel Data Set
  • Free Analyst Hours - 50 Hours
  • Free 1 Month Subscription to Trade Data Base
  • 1 Month Subscription to Price Database (Chemicals only)
  • Complimentary Excel Data Set
  • PPT Version of the Report
  • Power BI Dashboards
  • License Upgrade

Growth Bundle

Number of Reports: 8

30%

tax inclusive*

  • 8 Reports Included
  • Life Time Acess
  • Analyst Support Related to Report
  • PDF Version of the Report
  • Complimentary Excel Data Set
  • Free Analyst Hours - 50 Hours
  • Free 1 Month Subscription to Trade Data Base
  • 1 Month Subscription to Price Database (Chemicals only)
  • License Upgrade
  • Free Analyst Hours - 80 Hours
  • Power BI Dashboards

Enterprise Bundle

Number of Reports: 10

35%

tax inclusive*

  • 10 Reports Included
  • Life Time Acess
  • Analyst Support Related to Report
  • PDF Version of the Report
  • Complimentary Excel Data Set
  • Free Analyst Hours - 50 Hours
  • Free 1 Month Subscription to Trade Data Base
  • 1 Month Subscription to Price Database (Chemicals only)
  • License Upgrade
  • Power BI Dashboards
  • Free Analyst Hours - 100 Hours

How To Order

This is a collaborative report by Jaideep Kumar, Vikas Jha and Vishal Ranjan reflecting perspectives and research-driven insights from Expert Market Research.

Our step-by-step guide will help you select, purchase, and access your reports swiftly, ensuring you get the information that drives your decisions, right when you need it.

License Type

Select License Type

Choose the right license for your needs and access rights.

shopping cart

Click on ‘Buy Now’

Add the report to your cart with one click and proceed to register.

Bookmark Icon

Select Mode of Payment

Choose a payment option for a secure checkout. You will be redirected accordingly.

Strategic Solutions for Informed Decision-Making

Connect For More Information

Our expert team of analysts will offer full support and resolve any queries regarding the report, before and after the purchase.

Our expert team of analysts will offer full support and resolve any queries regarding the report, before and after the purchase.

We employ meticulous research methods, blending advanced analytics and expert insights to deliver accurate, actionable industry intelligence, staying ahead of competitors.

Our skilled analysts offer unparalleled competitive advantage with detailed insights on current and emerging markets, ensuring your strategic edge.

We offer an in-depth yet simplified presentation of industry insights and analysis to meet your specific requirements effectively.

We’re here to help answer any questions about our products and services.

Contact us