

Consumer Insights
Uncover trends and behaviors shaping consumer choices today
Procurement Insights
Optimize your sourcing strategy with key market data
Industry Stats
Stay ahead with the latest trends and market analysis.
The global nanocomposites market attained a value of USD 8.39 Billion in 2025 and is projected to expand at a CAGR of 16.20% through 2035. The market is further expected to achieve USD 37.66 Billion by 2035. With the increase in the need for durable and heat-resistant nanomaterials for battery cases in electric vehicles and aerospace parts, nanocomposites continue to grow popular as companies focus on designing products that require these properties.
One of the key driving factors of the nanocomposites market growth involves regulation concerning emissions in automobiles and the subsequent need for material substitution, in which nanocomposites come in handy due to their light weight. The second driving factor involves breakthroughs in the dispersal technologies of nanomaterials, which was one of the barriers to commercialization.
The nanocomposites market further witnesses a massive shift towards higher-performing light-weight nanocomposites in applications like electric mobility and advanced electronics. For instance, in May 2025, Arkema unveiled gel electrolyte battery materials, enhancing safety, performance, and scalability while enabling semi-solid battery development and supporting sustainable, cost-efficient manufacturing processes. Such trends reflect how material suppliers are now strategically positioning themselves within mobility value chains.
Product development and multifunctional approaches are now becoming the core pillars driving the overall growth in the nanocomposites market. OEMs within aerospace and automotive industries are utilizing carbon nanotubes in composite polymers as an alternative to traditional metals, with conductive and strength properties. For example, in September 2025, Korean researchers developed new carbon nanotube-based nanocomposites, optimized specifically for vat photopolymerization type 3D printing. Leading chemical firms are embracing scalable dispersion techniques, allowing for consistent nanoparticle incorporation without sacrificing manufacturing processes.
Compound Annual Growth Rate
16.2%
Value in USD Billion
2026-2035
Gas-sensing nanocomposite materials were produced by an Indian company based out of Bangalore. These were capable of increasing gas detection accuracy while at the same time enhancing industry safety, thus providing new avenues for companies to explore their investment in sensor nanocomposites.
Flexible piezoelectric nanocomposites were invented by CeNS that allowed energy harvesting and increased sensor efficiency as well as enabled innovations in the field of biomedical and wearables technology. This presents an opportunity for companies in the nanocomposites market to invest in these materials with special focus on developing energy-saving smart wearable devices.
The NIMTE scientists created biopolyester nanocomposites, which increased the durability, sustainability, and performance of materials, thus paving the way for eco-friendly packaging materials and construction materials. Company can therefore benefit from such developments by innovating in the area of nanocomposites that are environmentally friendly and meet global standards.
Scientists from TNAU created patented slow-release nano fertilizer nanocomposites that helped enhance efficiency while minimizing any adverse effects on the environment. This shows how companies in the nanocomposites market can create agri-nanocomposites and improve agricultural production using innovative technologies.
The development of nanocomposites for batteries is resulting in more uptake among manufacturers who are interested in improving the thermal conductance and mechanical properties of EV battery cases. For example, LG Chem and Panasonic are testing the use of polymers containing carbon nanotubes to lower overheating possibilities. Meanwhile, the United States Department of Energy is supporting several research initiatives aimed at developing light battery materials under its Vehicle Technologies Office. Such evolutions require close coordination between Tier-1 suppliers and material innovators considering shifting performance expectations, boosting the nanocomposites market value. For example, in January 2026, ARCI developed high-voltage supercapacitor boosting energy density, enhancing EV range and acceleration, while improving stability.
The aerospace industry is emphasizing the incorporation of nanocomposites in parts where weight and strength matter significantly. Boeing and Airbus suppliers are testing the use of graphene-enhanced polymers in fuselage parts. The European Union Aviation Safety Agency is also exploring the certification processes for such composite materials. This nanocomposites market trend is crucial since it helps lower any challenges associated with commercialization. Manufacturers that meet aviation safety regulations are expected to secure long-term engagements. In August 2024, Goodman Technologies partnered with research institutions to scale AI-driven 3D printing of nanocomposites, enhancing spacecraft thermal protection systems and addressing production challenges.
Nanocomposites are being employed by semiconductor manufacturers for better thermal management and miniaturization. Suppliers of the Taiwan Semiconductor Manufacturing Company are now using these materials in their advanced packaging products. In addition, material innovation is being encouraged via government-led semiconductor programs in the United States and South Korea. These materials assist in handling the thermal management issues in highly dense chips, which are crucial in applications that include AI and data centers. This nanocomposites market development is subtly transforming the ecosystem of suppliers, where material science firms are becoming strategically important. Aligning with this trend, in March 2026, India inaugurated Micron’s semiconductor ATMP facility in Gujarat, strengthening domestic chip manufacturing and boosting global supply chain integration.
Innovations in products are being affected by sustainability considerations, as evidenced by the adoption of bio-based nanocomposites created from cellulose nanofibers. Firms like Stora Enso are increasing their capacity to produce such products and are focusing on their use in packaging and automotive interior applications. Policies in the European Commission's Green Deal are also boosting financial support for biodegradable material development. This trend in the nanocomposites market is attracting packaging companies interested in sustainable packaging options instead of plastic materials. In February 2026, Brenntag announced a new partnership with Nanum, a Brazilian company specializing in industrial-scale nanomaterials.
There is increasing interest among builders in utilizing nanocomposites for improving durability while minimizing maintenance expenses. The development of concrete and coatings with silica nanoparticles are being initiated by manufacturers, which increases their resistance to cracking and longevity. Nanomaterials have also found indirect support from the Indian Government’s National Infrastructure Pipeline program, which is funding major infrastructure construction projects. As companies now start analyzing the lifecycle costs of such materials, opportunities arise for nanocomposites market players. In March 2025, Chinese researchers developed advanced nanowire structures improving performance, stability, and enabling efficient next generation nanoelectronic and energy applications.
Read more about this report - REQUEST FREE SAMPLE COPY IN PDF
The EMR’s report titled “Global Nanocomposites Market Report and Forecast 2026-2035” offers a detailed analysis of the market based on the following segments:
Market Breakup by Material Type
Key Insight: The segmentation of materials in the nanocomposites market stems from the need to optimize performance, as well as the difficulties of scaling production processes. Carbon nanotubes are dominant because of superior conductivity, whereas graphene is expanding its market share owing to its multipurpose nature. Metal oxides are also being used for coatings and catalysts, whereas nanoclay becomes an affordable means to reinforce packaging materials. Meanwhile, nanofibers are finding their niche applications across filtration and medical industries, whereas others serve special industrial needs.
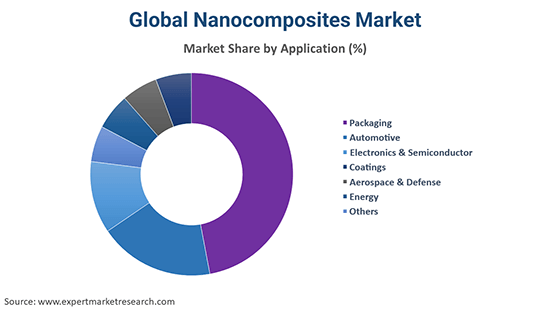
Market Breakup by Application
Key Insight: The automobile industry holds the leading position in the nanocomposites market due to the need for vehicle lightening and strength, whereas the electronics sector and semiconductor industry are growing their share at an accelerated rate due to thermal management concerns. Nanocomposites are enhancing packaging through improved barrier properties and coatings, while also supporting aerospace applications with high strength and lightweight characteristics.
Market Breakup by Region
Key Insight: Regional trends in the nanocomposites market reflect a balance between large-scale production and ongoing innovation. The Asia Pacific region takes precedence owing to its production capabilities and economic efficiency, whereas the North American region witnesses rapid growth owing to its innovative and commercialized approach. The European region continues to be dominant with respect to sustainable materials, while the Latin American region exhibits a steady adoption of nanocomposites in industrial applications. The Middle Eastern and African regions are exploring opportunities within the infrastructure and energy industries.
By material type, carbon nanotubes dominate the market due to superior conductivity integration demand
Carbon nanotubes remain the key driving factor boosting the nanocomposites industry development owing to its unique electrical conductivity and tensile strength. Companies are increasing their production capacity for nanocomposite’s use as battery enhancers in EV batteries. There is an increased emphasis by companies on dispersion technology that facilitates easy incorporation of the material in thermoplastics, improving the quality of high-performance parts. The material finds increasing relevance as automotive OEMs look to incorporate carbon nanotubes into a new vehicle design that requires weight saving and conductivity.
Graphene products are expanding their share in the nanocomposites market due to the need to develop versatile materials with strength, flexibility, and electrical and heat conductivity. This is prompting a shift from manufacturing of graphene to producing application-specific grades of the material that can be optimized for use in specific end-use markets such as flexible electronics, energy storage, and coatings. Companies are also getting involved in collaborations and joint ventures aimed at facilitating the development and commercialization of graphene applications, especially in Asia where electronics manufacturing is intensive. For example, in February 2023, OCSiAl announced it had expanded its portfolio of products for reinforcing and adding conductivity to rubbers with new graphene nanotube technologies for NBR rubber.
By application, the automotive segment accounts for the largest share of the market due to lightweighting and structural integration requirements globally
The automotive industry continues to be the largest application segment, spurred by the growing necessity for lighter materials to increase fuel efficiency and optimize EV performance. Nanocomposites are being incorporated into structural parts, battery casings, and interior features to lighten the load and improve resistance levels of vehicles. OEMs continue to work in close collaboration with material providers to jointly develop nanocomposites that would satisfy the emerging needs of the automotive industry.
Electronic and semiconductor applications are also contributing to the nanocomposites market revenue due to the requirements of efficient thermal management and smaller devices. Nanocomposites are widely incorporated into semiconductors, packaging of electronics, and even circuit boards to optimize the heat resistance of these elements. Prominent players in the semiconductor market are partnering with nanomaterials providers to design new composite materials that would provide higher resistance levels in more powerful chips. Similarly, in April 2026, scientists solved a century-old mystery explaining how carbon black reinforces rubber, enabling stronger, durable nanocomposites and guiding next-generation material design across industrial and energy applications.


Asia Pacific leads the market growth due to strong manufacturing ecosystems expansion
The Asia Pacific region holds the dominant position as far as the nanocomposites industry revenue dynamics are considered, owing to its well-established manufacturing infrastructure and its participation in sectors like electronics, automotive, and chemical. Countries such as China, Japan, and South Korea are pouring massive investments into the manufacture of advanced materials, encouraged by government-initiated innovative programs. Their emphasis on increasing production capacity without compromising costs gives them an edge in the global value chain. In November 2025, CeNS developed flexible piezoelectric nanocomposites enabling self-powered wearable sensors, enhancing energy harvesting, real-time health monitoring, and advancing biomedical and smart textile applications.
North America is set to be the fastest-growing regional nanocomposites market due to its high R&D potential and early adoption of advanced materials. Increased collaboration between research institutes and chemical corporations within the region helps in promoting advanced materials. Various efforts by the government towards developing clean energy solutions indirectly drive the market forward. Major end-user industries include aerospace, military, and new-generation electronics.
The market is rapidly evolving into a highly strategic one, wherein firms are now prioritizing premium applications. Leading nanocomposites market players are now actively engaged in developing better dispersion methods that allow nanoparticles to be dispersed homogeneously throughout the polymer medium. There is also an increasing trend toward customized formulations for specialized applications such as electric vehicle batteries, semiconductor packaging, and aerospace paints.
The market observes a growing number of collaborations between nanocomposite companies and original equipment manufacturers, usually through product development partnerships. Several organizations are also developing nanomaterial formulations that would give them control over the end-performance metrics of their products in various markets.
Mineral Technologies Inc., founded in 1944 and based in New York, United States, is working on engineered mineral-based nanocomposites in the field of paper, packaging, and construction. Mineral Technologies Inc. is optimizing its nano-calcium carbonate products to increase resistance and toughness to enable packaging companies to use less material without compromising their standards.
DuPont de Nemours, Inc, founded in 1802 and located in Delaware, United States, is working extensively on nanocomposites in the electronics and automobile industries. DuPont is concentrating on creating polymer-based nanocomposites for semiconductor packaging and automobile components due to its robust research and development network and collaboration with OEMs.
Zyvex Technologies Inc., founded in 1997 and based in Ohio, United States, specializes in carbon nanotube reinforced composites for use in aerospace and defense industries. Zyvex Technologies is concentrating on nanomaterial reinforced composites which enhance the strength of the material without increasing its weight, especially those for military applications.
Arkema Inc., founded in 2004 and headquartered in Paris, France, is developing its range of graphene and specialty polymers-based nanocomposites. It focuses on electric mobility and coatings through its diverse nanocomposites portfolio.
*Please note that this is only a partial list; the complete list of key players is available in the full report. Additionally, the list of key players can be customized to better suit your needs.*
Other key players in the market include Powdermet Inc., and RTP Company, among others.
Unlock the latest insights with our nanocomposites market trends 2026 report. Discover regional growth patterns, consumer preferences, and key industry players. Stay ahead of competition with trusted data and expert analysis. Download your free sample report today and drive informed decisions in the market.
Upto 15% Off
USD
$2499 $2249
$3999 $3599
$4999 $4249
$5999 $5099


*While we strive to always give you current and accurate information, the numbers depicted on the website are indicative and may differ from the actual numbers in the main report. At Expert Market Research, we aim to bring you the latest insights and trends in the market. Using our analyses and forecasts, stakeholders can understand the market dynamics, navigate challenges, and capitalize on opportunities to make data-driven strategic decisions.*
In 2025, the market reached an approximate value of USD 8.39 Billion.
The market is projected to grow at a CAGR of 16.20% between 2026 and 2035.
Focusing on co-developing applications with OEMs, investing in scalable dispersion technologies, targeting high-growth sectors like EVs, optimizing supply chains, and building proprietary nanomaterial platforms for competitive differentiation.
The growing research and development activities and rising demand for lightweight materials in aerospace and defence sector are the key trends guiding the growth of the nanocomposites market.
The major regions in the market are North America, Latin America, the Middle East and Africa, Europe, and the Asia Pacific.
Carbon nanotubes, metal oxides, nanoclay, nanofibre, and graphene, among others, are the leading material types of nanocomposites in the market.
The significant applications of the product include packaging, automotive, electronics and semiconductors, coatings, aerospace and defence, and energy, among others.
The key players in the market include Mineral Technologies Inc., DuPont de Nemours, Inc, Zyvex Technologies Inc., Arkema Inc., Powdermet Inc., and RTP Company, among others.
Scaling nanomaterial dispersion consistently, managing high production costs, addressing regulatory uncertainties, and ensuring material standardization across industries remain key challenges, slightly slowing broader commercialization despite strong demand momentum.
Explore our key highlights of the report and gain a concise overview of key findings, trends, and actionable insights that will empower your strategic decisions.
| REPORT FEATURES | DETAILS |
| Base Year | 2025 |
| Historical Period | 2019-2025 |
| Forecast Period | 2026-2035 |
| Scope of the Report |
Historical and Forecast Trends, Industry Drivers and Constraints, Historical and Forecast Market Analysis by Segment:
|
| Breakup by Material Type |
|
| Breakup by Application |
|
| Breakup by Region |
|
| Market Dynamics |
|
| Competitive Landscape |
|
| Companies Covered |
|
| Report Price and Purchase Option | Explore our purchase options that are best suited to your resources and industry needs. |
| Delivery Format | Delivered as an attached PDF and Excel through email, with an option of receiving an editable PPT, according to the purchase option. |
Datasheet
One User
USD 2,499
USD 2,249
tax inclusive*
Single User License
One User
USD 3,999
USD 3,599
tax inclusive*
Five User License
Five User
USD 4,999
USD 4,249
tax inclusive*
Corporate License
Unlimited Users
USD 5,999
USD 5,099
tax inclusive*
*Please note that the prices mentioned below are starting prices for each bundle type. Kindly contact our team for further details.*
Flash Bundle
Small Business Bundle
Growth Bundle
Enterprise Bundle
*Please note that the prices mentioned below are starting prices for each bundle type. Kindly contact our team for further details.*
Flash Bundle
Number of Reports: 3
20%
tax inclusive*
Small Business Bundle
Number of Reports: 5
25%
tax inclusive*
Growth Bundle
Number of Reports: 8
30%
tax inclusive*
Enterprise Bundle
Number of Reports: 10
35%
tax inclusive*
How To Order

Select License Type
Choose the right license for your needs and access rights.

Click on ‘Buy Now’
Add the report to your cart with one click and proceed to register.

Select Mode of Payment
Choose a payment option for a secure checkout. You will be redirected accordingly.
Strategic Solutions for Informed Decision-Making
Gain insights to stay ahead and seize opportunities.

Get insights & trends for a competitive edge.

Track prices with detailed trend reports.

Analyse trade data for supply chain insights.

Leverage cost reports for smart savings

Enhance supply chain with partnerships.

Connect For More Information
Our expert team of analysts will offer full support and resolve any queries regarding the report, before and after the purchase.
Our expert team of analysts will offer full support and resolve any queries regarding the report, before and after the purchase.
We employ meticulous research methods, blending advanced analytics and expert insights to deliver accurate, actionable industry intelligence, staying ahead of competitors.
Our skilled analysts offer unparalleled competitive advantage with detailed insights on current and emerging markets, ensuring your strategic edge.
We offer an in-depth yet simplified presentation of industry insights and analysis to meet your specific requirements effectively.


