

Consumer Insights
Uncover trends and behaviors shaping consumer choices today
Procurement Insights
Optimize your sourcing strategy with key market data
Industry Stats
Stay ahead with the latest trends and market analysis.
The global non-conductive inks market attained a value of USD 542.94 Million in 2025 and is projected to expand at a CAGR of 6.80% through 2035. The market is further expected to achieve USD 1048.25 Million by 2035. Increased usage of printable medical diagnostic kits and wearables is contributing to the growth in demand for non-conductive inks of precision and higher accuracy. These offer improved stability, biocompatibility, while creating thinner insulating layers for use in the next generation of healthcare products.
Curing techniques are improving significantly, helping to achieve fast process speeds without compromising substrate quality. This is coupled with more investments made for developing smart packaging and labeling technology using the Internet of Things (IoT), accelerating demand in the non-conductive inks market. Companies are taking advantage of these innovations by formulating inks with better printability and durability characteristics.
In June 2025, Sun Chemical launched its new UV-curable non-conductive ink platform that is intended for the production of advanced flexible electronics and circuits used for automotive interior applications, offering excellent low dielectric constant performance and high adhesion properties on polymer substrates. In addition, Sun's new product launch comes amid rising interest in printing technology for electronics, boosting the non-conductive inks market value. This is indicative of how suppliers are positioning themselves in terms of providing high-reliability insulating ink materials for multi-layer printed circuit boards used in smart surfaces and interfaces.
The non-conductive inks market is seeing a fundamental change in the way suppliers develop their products to meet demand arising from applications such as printing sensors, RFID tags, and miniaturized consumer devices. As circuit boards get thinner, denser, and more flexible, manufacturers are developing new types of non-conductive inks with improved dielectric strength and fast curing processes to be integrated in various substrates, including plastics, glass, and even textiles. In March 2026, Reelables launched “Anywhere” smart label enabling real-time global cargo tracking via Bluetooth and cellular networks, offering low-cost, printable, infrastructure-free supply chain visibility. Furthermore, this trend is spurring new collaborations between ink producers and OEMs in order to lower energy consumption during curing and enhance throughput.
Compound Annual Growth Rate
6.8%
Value in USD Million
2026-2035
The launch of the FlexiC RFID products by Tageos allowed for the manufacture of flexible and chip-integrated smart packaging tags, making them more scalable, durable, and environmentally friendly. Innovations like these indicate possibilities for non-conductive inks market companies to produce flexible inks that would be suitable for developing flexible RFID chips.
NXP introduced the UCODE X chip, which was equipped with an extended memory, increased security, and an enhanced read range to support its use in high volume retail, logistics, and industrial IoT applications. This is an indication of the possibilities for companies to produce highly accurate insulating inks suitable for such chips.
Henkel provided advanced functional materials alongside sustainability-focused concepts, centered on printed electronics, flexible hybrid technologies, and collaborative ecosystems, to accelerate electronics manufacturing solutions in the non-conductive inks market. Such innovations present possibilities for manufacturers to produce eco-friendly and high-performance non-conductive inks, in compliance with flexible electronics and sustainability-driven manufacturing ecosystems.
Electroninks produced copper MOD ink for fine-line semiconductor packaging, which is a cost-effective version compared to silver ink, providing good conductivity and processibility. It brings an opportunity for manufacturing firms to develop suitable non-conductive inks capable of performing as insulators along with conductive inks in advanced semiconductor packaging.
Printed electronics are increasingly being used by automotive OEMs in dashboard controls, steering wheels, and other areas in interior ambient lighting panels, thus increasing the need for non-conductive inks that are durable and highly resistant to heat. Some European companies are working on applications of capacitive touch in their automobiles, where special inks are required as insulation materials, thereby boosting the non-conductive inks market penetration. The regulatory push towards weight-reducing automobile manufacturing technology means more printed electronics will be utilized due to their efficiency, making it necessary to develop inks for polycarbonate and PET substrates. In May 2025, Rodman Media announced Printed Electronics Now returning to Ink World platform, enhancing global coverage of printed electronics innovations, industry news, and emerging application developments.
Governments in different countries are increasingly becoming involved in projects promoting smart packaging that increases visibility and prevents counterfeit goods from entering supply chains. Countries such as Japan and Germany are offering support to programs aimed at integrating RFID packaging technologies which involve use of non-conductive ink as part of insulation material for printed electronics. Public-private partnerships in Europe are facilitating funding for intelligent pharmaceutical packaging solutions based on printed electronics, reshaping the non-conductive inks market trends and dynamics. Following this trend, in April 2026, hubergroup launched NewV tin LED MGA ink series for food packaging, enabling energy-efficient LED curing, regulatory compliance, and high-performance metal decoration applications.
With the increasing popularity of wearable sensors and disposable diagnostic patches in the health care market, there is now an increased demand for non-conductive ink that is biocompatible. For these patches, it is essential to use inks that maintain their insulating properties even under repeated bending, thereby stimulating the non-conductive inks market value. Additionally, regulatory compliance for wearable devices in the health care industry is becoming increasingly important in terms of product development since manufactures have to ensure that the devices are safe. In September 2024, Electroninks launched copper MOD ink replacing plating processes, enabling faster semiconductor packaging, lower energy use, and reduced manufacturing costs.
Due to stringent environmental regulations that are encouraging the adoption of green manufacturing techniques by producers, ink manufacturers are introducing non-conductive ink formulations that are water-based and are low-VOC in nature. Increasing safety concerns regarding chemicals in Europe and stringent chemical legislation in the continent are encouraging suppliers to introduce safer formulations, accelerating demand in the non-conductive inks market. As a result, producers are offering non-conductive inks that are sustainable and highly efficient. For instance, in April 2026, Boston Industrial Solutions launched Natron UVPZ matte UV ink enhancing adhesion, durability, and multi-substrate compatibility using AI-driven formulation advancements for industrial printing applications.
The introduction of inkjet and screen printing is revolutionizing the use of conductive ink within various industries, propelling the non-conductive inks market penetration. In situations where fast printing is involved, it is necessary that the ink offer good viscosity management and quick cure characteristics. A number of equipment manufacturers are releasing highly advanced inkjet printers that could accommodate functional inks used in electronics. In January 2026, Epson launched SureColor G9000 DTFilm printer offering high-speed, reliable textile transfer printing with automated maintenance and integrated system design for efficient production workflows.
Read more about this report - REQUEST FREE SAMPLE COPY IN PDF
The EMR’s report titled “Global Non-Conductive Inks Market Report and Forecast 2026-2035” offers a detailed analysis of the market based on the following segments:
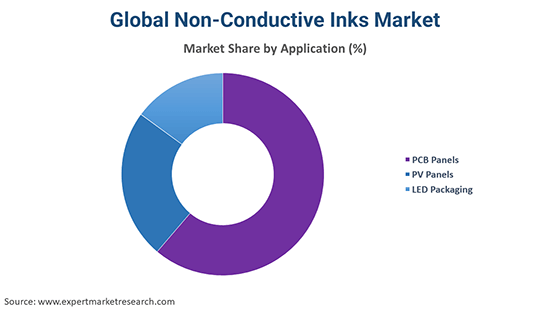
Market Breakup by Application
Key Insight: As per the non-conductive inks market report, PCB panels, PV panels, and LED packaging together form the application space for non-conductive inks, each molded according to specific needs. PCB panels focus on dielectric accuracy and suitability for multilayers, due to modern electronics fabrication. PV panels need ink that maintains insulative strength in extended environmental conditions, aiding solar module integrity. In October 2024, Praevar introduced E Ink-based ePoster signage offering battery-powered operation, ultra-low energy consumption, and dynamic content updates, replacing traditional paper posters in retail environments. LED packaging requires ink that withstands high temperatures and is small-scale oriented, keeping pace with lighting technology evolution. Overall, there is an increasing emphasis on ink formulation according to substrate specifications and curing speed.
Market Breakup by Region
Key Insight: North America, Europe, Asia Pacific, Latin America, and Middle East & Africa all play important roles in driving the overall non-conductive inks market growth. Asia Pacific holds a prominent position due to its high-volume electronics manufacturing and robust supply chains. North America concentrates on innovation-based applications, especially in the health care and aerospace industries. Europe takes sustainability into account while complying with regulations, which affects environmentally friendly ink formulation. Latin America slowly integrates printed electronics technology in industry and packaging sectors, presenting new possibilities for market growth.
By form, PCB panels dominate the market due to rising multilayer electronics manufacturing demand
In the PCB sector, panels continue to retain their dominance within the non-conductive inks market scope amid the increasing drive towards denser electronic circuits and multiple layers on boards. There is a growing development of inks with improved dielectric performance, aimed at designing smaller electronics devices like smartphones, automotive ECU boards, and industrial controllers. Many firms are now focusing on the development of inks that are meant for high-frequency circuits, especially those used in developing 5G boards. New supplier approaches are centered on the development of low-loss dielectric formulations that prevent interference. For example, in December 2024, Elephantech introduced multilayer printed circuit boards using inkjet printing, reducing copper usage by up to 70% while enabling scalable, low-emission electronics manufacturing.
There is increasing activity in the LED package category as players come up with mini and micro-LEDs technology solutions. There is an important role played by non-conductive inks in insulating LEDs and enhancing their thermal and electrical stability. Many manufacturers are investing in developing inks that are capable of working in extreme temperatures while maintaining optical clarity, accelerating the non-conductive inks market value. Many Asian LED manufacturers are also using precision inkjet application, leading to a greater need for inks with specific viscosity and fast curing capacity.


Asia Pacific secures the leading market share due to strong electronics manufacturing ecosystems
Asia Pacific continues to be the leading non-conductive inks market because of the significant presence of electronic manufacturing units along with comprehensive supply chain operations. Nations like China, South Korea, and Japan are actively producing consumer electronics, semiconductors, and LED products, resulting in steady demand for non-conductive inks. The players from the region are keen to scale up their production capabilities without compromising on cost-effectiveness. The ink manufacturers are also setting up regional research and development centers to work closely with OEMs and contract manufacturers. In February 2026, Toyo Ink India inaugurated aTIC-India at IISc Bengaluru, in India, focusing on next-generation sustainable materials and co-creation research for advanced electronics, healthcare, and industrial applications.
North America is experiencing robust growth in the non-conductive inks market, owing to the emergence of innovations in healthcare electronics, aerospace systems, and intelligent packaging solutions. The companies in the region are concentrating on delivering performance inks that meet specific requirements like wearables and defense electronics. There is also regulatory pressure on the suppliers that is compelling them to produce reliable inks. Material science firms are partnering with technology start-ups to shorten their innovation cycles. Domestic semiconductor manufacturing is expected to generate growth prospects for suppliers.
Trends in the global market are pointing towards specialization, with non-conductive ink companies working on developing inks specifically for applications within flexible electronics, car controls, and medical gadgets. Innovation in material science are expected to be driven by improvements in dielectrics, low-temperature drying, and substrates flexibility. Collaboration with OEMs and inkjet printer manufacturers is allowing companies to develop tailor-made products together.
Leading non-conductive inks market players distinguish themselves through the creation of sustainable ink types, such as bio-sourced and low-VOC inks. There are opportunities in the areas of smart packaging and wearable sectors, which are gaining momentum in the market due to the rising demand from technology companies. These innovations present an opportunity for suppliers to secure long-term contracts based on their expertise in specific application areas.
Henkel AG & Co. KGaA was founded in 1876 in Düsseldorf, Germany, and specializes in innovative functional coatings and insulation materials for electronic devices. The company is expanding its range of non-conductive inks that can be applied in automotive and industrial sectors, with an emphasis on low cure and good adhesion characteristics.
Teikoku Printing Inks Mfg. Co., Ltd was established in 1895 and is based in Tokyo, Japan. The company manufactures high-quality ink products for applications in electronics and packaging sectors. Teikoku Printing Inks Mfg. Co., Ltd is working on new and precise non-conductive ink products that can be used in printed electronics sector.
Established in 1938 in Weißenburg, Germany, Proell GmbH specializes in advanced inks for industrial and electronics sectors. The company is currently innovating in the area of non-conductive ink products for membrane switches and automotive interior, with an emphasis on durable performance under harsh conditions.
*Please note that this is only a partial list; the complete list of key players is available in the full report. Additionally, the list of key players can be customized to better suit your needs.*
Unlock the latest insights with our non-conductive inks market trends 2026 report. Discover regional growth patterns, consumer preferences, and key industry players. Stay ahead of competition with trusted data and expert analysis. Download your free sample report today and drive informed decisions in the market.
Upto 15% Off
USD
$2499 $2249
$3999 $3599
$4999 $4249
$5999 $5099


*While we strive to always give you current and accurate information, the numbers depicted on the website are indicative and may differ from the actual numbers in the main report. At Expert Market Research, we aim to bring you the latest insights and trends in the market. Using our analyses and forecasts, stakeholders can understand the market dynamics, navigate challenges, and capitalize on opportunities to make data-driven strategic decisions.*
In 2025, the market reached an approximate value of USD 542.94 Million.
The market is projected to grow at a CAGR of 6.80% between 2026 and 2035.
The market is estimated to witness a healthy growth in the forecast period of 2026-2035 to reach USD 1048.25 Million by 2035.
Investing in application-specific R&D, forming OEM partnerships, expanding sustainable product lines, optimizing curing technologies, and strengthening regional production capabilities are helping stakeholders capture high-value opportunities and improve competitive positioning.
Expanding electronic industry and use of glass substrates in electronics are among the key trends propelling the growth of the market.
The major regions in the market are North America, Latin America, the Middle East and Africa, Europe, and the Asia Pacific.
PCB panel is the dominant application type in the global non-conductive inks market.
The key players in the market include Henkel AG & Co. KGaA, Teikoku Printing Inks Mfg. Co., Ltd, and Proell GmbH, among others.
Maintaining consistent dielectric performance across diverse substrates, managing regulatory compliance for chemical compositions, and balancing cost with high-performance requirements are challenging manufacturers amid rapidly evolving electronics applications and production standards globally.
Explore our key highlights of the report and gain a concise overview of key findings, trends, and actionable insights that will empower your strategic decisions.
| REPORT FEATURES | DETAILS |
| Base Year | 2025 |
| Historical Period | 2019-2025 |
| Forecast Period | 2026-2035 |
| Scope of the Report |
Historical and Forecast Trends, Industry Drivers and Constraints, Historical and Forecast Market Analysis by Segment:
|
| Breakup by Application |
|
| Breakup by Region |
|
| Market Dynamics |
|
| Competitive Landscape |
|
| Companies Covered |
|
| Report Price and Purchase Option | Explore our purchase options that are best suited to your resources and industry needs. |
| Delivery Format | Delivered as an attached PDF and Excel through email, with an option of receiving an editable PPT, according to the purchase option. |
Datasheet
One User
USD 2,499
USD 2,249
tax inclusive*
Single User License
One User
USD 3,999
USD 3,599
tax inclusive*
Five User License
Five User
USD 4,999
USD 4,249
tax inclusive*
Corporate License
Unlimited Users
USD 5,999
USD 5,099
tax inclusive*
*Please note that the prices mentioned below are starting prices for each bundle type. Kindly contact our team for further details.*
Flash Bundle
Small Business Bundle
Growth Bundle
Enterprise Bundle
*Please note that the prices mentioned below are starting prices for each bundle type. Kindly contact our team for further details.*
Flash Bundle
Number of Reports: 3
20%
tax inclusive*
Small Business Bundle
Number of Reports: 5
25%
tax inclusive*
Growth Bundle
Number of Reports: 8
30%
tax inclusive*
Enterprise Bundle
Number of Reports: 10
35%
tax inclusive*
How To Order

Select License Type
Choose the right license for your needs and access rights.

Click on ‘Buy Now’
Add the report to your cart with one click and proceed to register.

Select Mode of Payment
Choose a payment option for a secure checkout. You will be redirected accordingly.
Strategic Solutions for Informed Decision-Making
Gain insights to stay ahead and seize opportunities.

Get insights & trends for a competitive edge.

Track prices with detailed trend reports.

Analyse trade data for supply chain insights.

Leverage cost reports for smart savings

Enhance supply chain with partnerships.

Connect For More Information
Our expert team of analysts will offer full support and resolve any queries regarding the report, before and after the purchase.
Our expert team of analysts will offer full support and resolve any queries regarding the report, before and after the purchase.
We employ meticulous research methods, blending advanced analytics and expert insights to deliver accurate, actionable industry intelligence, staying ahead of competitors.
Our skilled analysts offer unparalleled competitive advantage with detailed insights on current and emerging markets, ensuring your strategic edge.
We offer an in-depth yet simplified presentation of industry insights and analysis to meet your specific requirements effectively.


