

Consumer Insights
Uncover trends and behaviors shaping consumer choices today
Procurement Insights
Optimize your sourcing strategy with key market data
Industry Stats
Stay ahead with the latest trends and market analysis.
The global nootropics market attained USD 3.45 Billion in 2025. The global nootropics industry is expected to grow at a CAGR of 14.60% in the forecast period of 2026-2035 to attain USD 13.48 Billion by 2035.
According to Beverage Daily, the functional beverage sector is rapidly pivoting toward brain health, cognition, and mental wellness in April 2026. Nootropic-driven brands like Neutonic, Bloom, Trip, and Hiyo are fueling rapid category expansion, incorporating ingredients such as citicoline, L-theanine, ashwagandha, and lion's mane. SPINS data shows mood beverages up 42% in dollar growth, signaling strong momentum for cognitive-support products in the global nootropics market.
As reported by NutraIngredients, Magtein, a novel form of magnesium L-threonate, received UK novel food approval from the Food Standards Agency in March 2026. Backed by five human clinical trials, the ingredient strengthens the cognitive enhancement and brain health segments of the nootropics market. The approval reflects rising consumer demand for science-backed solutions targeting focus, sleep, stress resilience, and healthy aging worldwide.
Compound Annual Growth Rate
14.6%
Value in USD Billion
2026-2035
Read more about this report - REQUEST FREE SAMPLE COPY IN PDF
North America has the highest number of nootropics consumers regionally and holds the major market share of nootropics. The U.S. Food and Drug Administration has classified non-prescription nootropics product under the Generally Regarded as Safe (GRAS) category, thereby easing market expansion. Hence, it is the home of the largest market players in the nootropics industry. Consumption of multi-vitamin tablets for improving functional abilities is fairly common among the population of this region. High awareness for cognitive health, the rise of self-directed buyers, and a growing population are some of the factors that drive the market dominance of North America. The Asia Pacific is expected to be the fastest growing market in the forecast period. Countries such as China and India have a great history of cognitive based natural drugs. Foreign investment in collaboration with regional players holds immense potential for the growth of the nootropics industry.
Read more about this report - REQUEST FREE SAMPLE COPY IN PDF
Nootropics are drugs or supplements that claim to improve cognitive function, specifically executive functions, memory, creativity, or motivation, in healthy individuals. These have been in the market for several decades, such as caffeine and multivitamins - substances approved by FDA as dietary supplements and classified as GRAS (generally regarded as safe). Currently, these products are being marketed and sold to academic and professional overachievers to augment their brain functions.
Market Breakup by Type
Market Breakup by Indications
Market Breakup by Dosage Form
Market Breakup by Route of Administration
Market Breakup by End User
Market Breakup by Distribution Channel
Market Breakup by Region


Read more about this report - REQUEST FREE SAMPLE COPY IN PDF
Due to a highly competitive and challenging work environment, the market for brain boosters has witnessed a rise and is expected to grow in the forecast period. The rising demand for improved decision making in the sports industry and growing awareness with respect to mental health are also boosting the rise of the market for nootropics. Due to increasing awareness, rising disposable incomes, and increased demand for productivity, the market is expected to grow rapidly in emerging countries such as China and India. As cognitive enhancers made from natural and herbal substances have already been common in these areas historically, mergers between foreign and local companies are expected to push the market for nootropics in these areas forward. However, on the flip side, various side effects, addiction, lack of awareness, the stigma around visiting psychiatrists and neurologists in developing countries might impede the growth of the nootropics industry.
The report gives a detailed analysis of the following key players in the global nootropics market, covering their competitive landscape, capacity, and latest developments like mergers, acquisitions, and investments, expansions of capacity, and plant turnarounds:
The comprehensive EMR report provides an in-depth assessment of the market based on the Porter's five forces model along with giving a SWOT analysis.
Upto 15% Off
USD
$5499 $4949
$3299 $2969
$6999 $5949
$8199 $6969


*While we strive to always give you current and accurate information, the numbers depicted on the website are indicative and may differ from the actual numbers in the main report. At Expert Market Research, we aim to bring you the latest insights and trends in the market. Using our analyses and forecasts, stakeholders can understand the market dynamics, navigate challenges, and capitalize on opportunities to make data-driven strategic decisions.*
In 2025, the global nootropics market attained a value of nearly USD 3.45 Billion.
The market is projected to grow at a CAGR of 14.60% between 2026 and 2035.
The major drivers of the market include the increasing awareness, rising disposable incomes, increased demand for productivity, rise of self-directed buyers, growing population, and foreign investment.
The rising demand for improved decision-making in the sports industry and growing awareness with respect to mental health are the key industry trends propelling the market's growth.
The major regions in the industry are North America, Latin America, the Middle East and Africa, Europe, and the Asia Pacific.
Prescription and OTC are the types of nootropics in the market.
The market is segmented on the basis of distribution channels into online and offline.
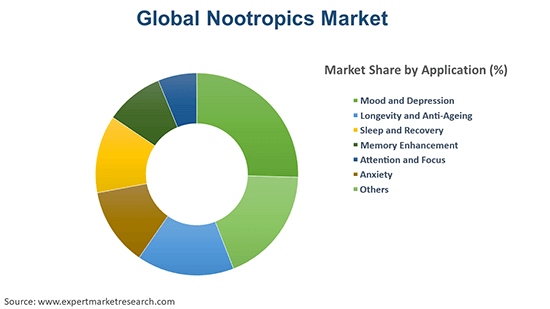
Based on applications, the industry is divided into mood and depression, longevity and anti-ageing, sleep and recovery, memory enhancement, attention and focus, and anxiety, among others.
The major players in the industry are Purelife Bioscience Co., Ltd., UCB S.A., HVMN Inc., and Gaia Herbs, Inc., among others.
Explore our key highlights of the report and gain a concise overview of key findings, trends, and actionable insights that will empower your strategic decisions.
| REPORT FEATURES | DETAILS |
| Base Year | 2025 |
| Historical Period | 2019-2025 |
| Forecast Period | 2026-2035 |
| Scope of the Report |
Historical and Forecast Trends, Industry Drivers and Constraints, Historical and Forecast Market Analysis by Segment:
|
| Breakup by Type |
|
| Breakup by Indications |
|
| Breakup by Dosage Form |
|
| Breakup by Route of Administration |
|
| Breakup by End User |
|
| Breakup by Distribution Channel |
|
| Breakup by Region |
|
| Market Dynamics |
|
| Supplier Landscape |
|
| Companies Covered |
|
| Report Price and Purchase Option | Explore our purchase options that are best suited to your resources and industry needs. |
| Delivery Format | Delivered as an attached PDF and Excel through email, with an option of receiving an editable PPT, according to the purchase option. |
Single User License
One User
USD 5,499
USD 4,949
tax inclusive*
Datasheet
One User
USD 3,299
USD 2,969
tax inclusive*
Five User License
Five User
USD 6,999
USD 5,949
tax inclusive*
Corporate License
Unlimited Users
USD 8,199
USD 6,969
tax inclusive*
*Please note that the prices mentioned below are starting prices for each bundle type. Kindly contact our team for further details.*
Flash Bundle
Small Business Bundle
Growth Bundle
Enterprise Bundle
*Please note that the prices mentioned below are starting prices for each bundle type. Kindly contact our team for further details.*
Flash Bundle
Number of Reports: 3
20%
tax inclusive*
Small Business Bundle
Number of Reports: 5
25%
tax inclusive*
Growth Bundle
Number of Reports: 8
30%
tax inclusive*
Enterprise Bundle
Number of Reports: 10
35%
tax inclusive*
How To Order

Select License Type
Choose the right license for your needs and access rights.

Click on ‘Buy Now’
Add the report to your cart with one click and proceed to register.

Select Mode of Payment
Choose a payment option for a secure checkout. You will be redirected accordingly.
Strategic Solutions for Informed Decision-Making
Gain insights to stay ahead and seize opportunities.

Get insights & trends for a competitive edge.

Track prices with detailed trend reports.

Analyse trade data for supply chain insights.

Leverage cost reports for smart savings

Enhance supply chain with partnerships.

Connect For More Information
Our expert team of analysts will offer full support and resolve any queries regarding the report, before and after the purchase.
Our expert team of analysts will offer full support and resolve any queries regarding the report, before and after the purchase.
We employ meticulous research methods, blending advanced analytics and expert insights to deliver accurate, actionable industry intelligence, staying ahead of competitors.
Our skilled analysts offer unparalleled competitive advantage with detailed insights on current and emerging markets, ensuring your strategic edge.
We offer an in-depth yet simplified presentation of industry insights and analysis to meet your specific requirements effectively.


