

Consumer Insights
Uncover trends and behaviors shaping consumer choices today
Procurement Insights
Optimize your sourcing strategy with key market data
Industry Stats
Stay ahead with the latest trends and market analysis.
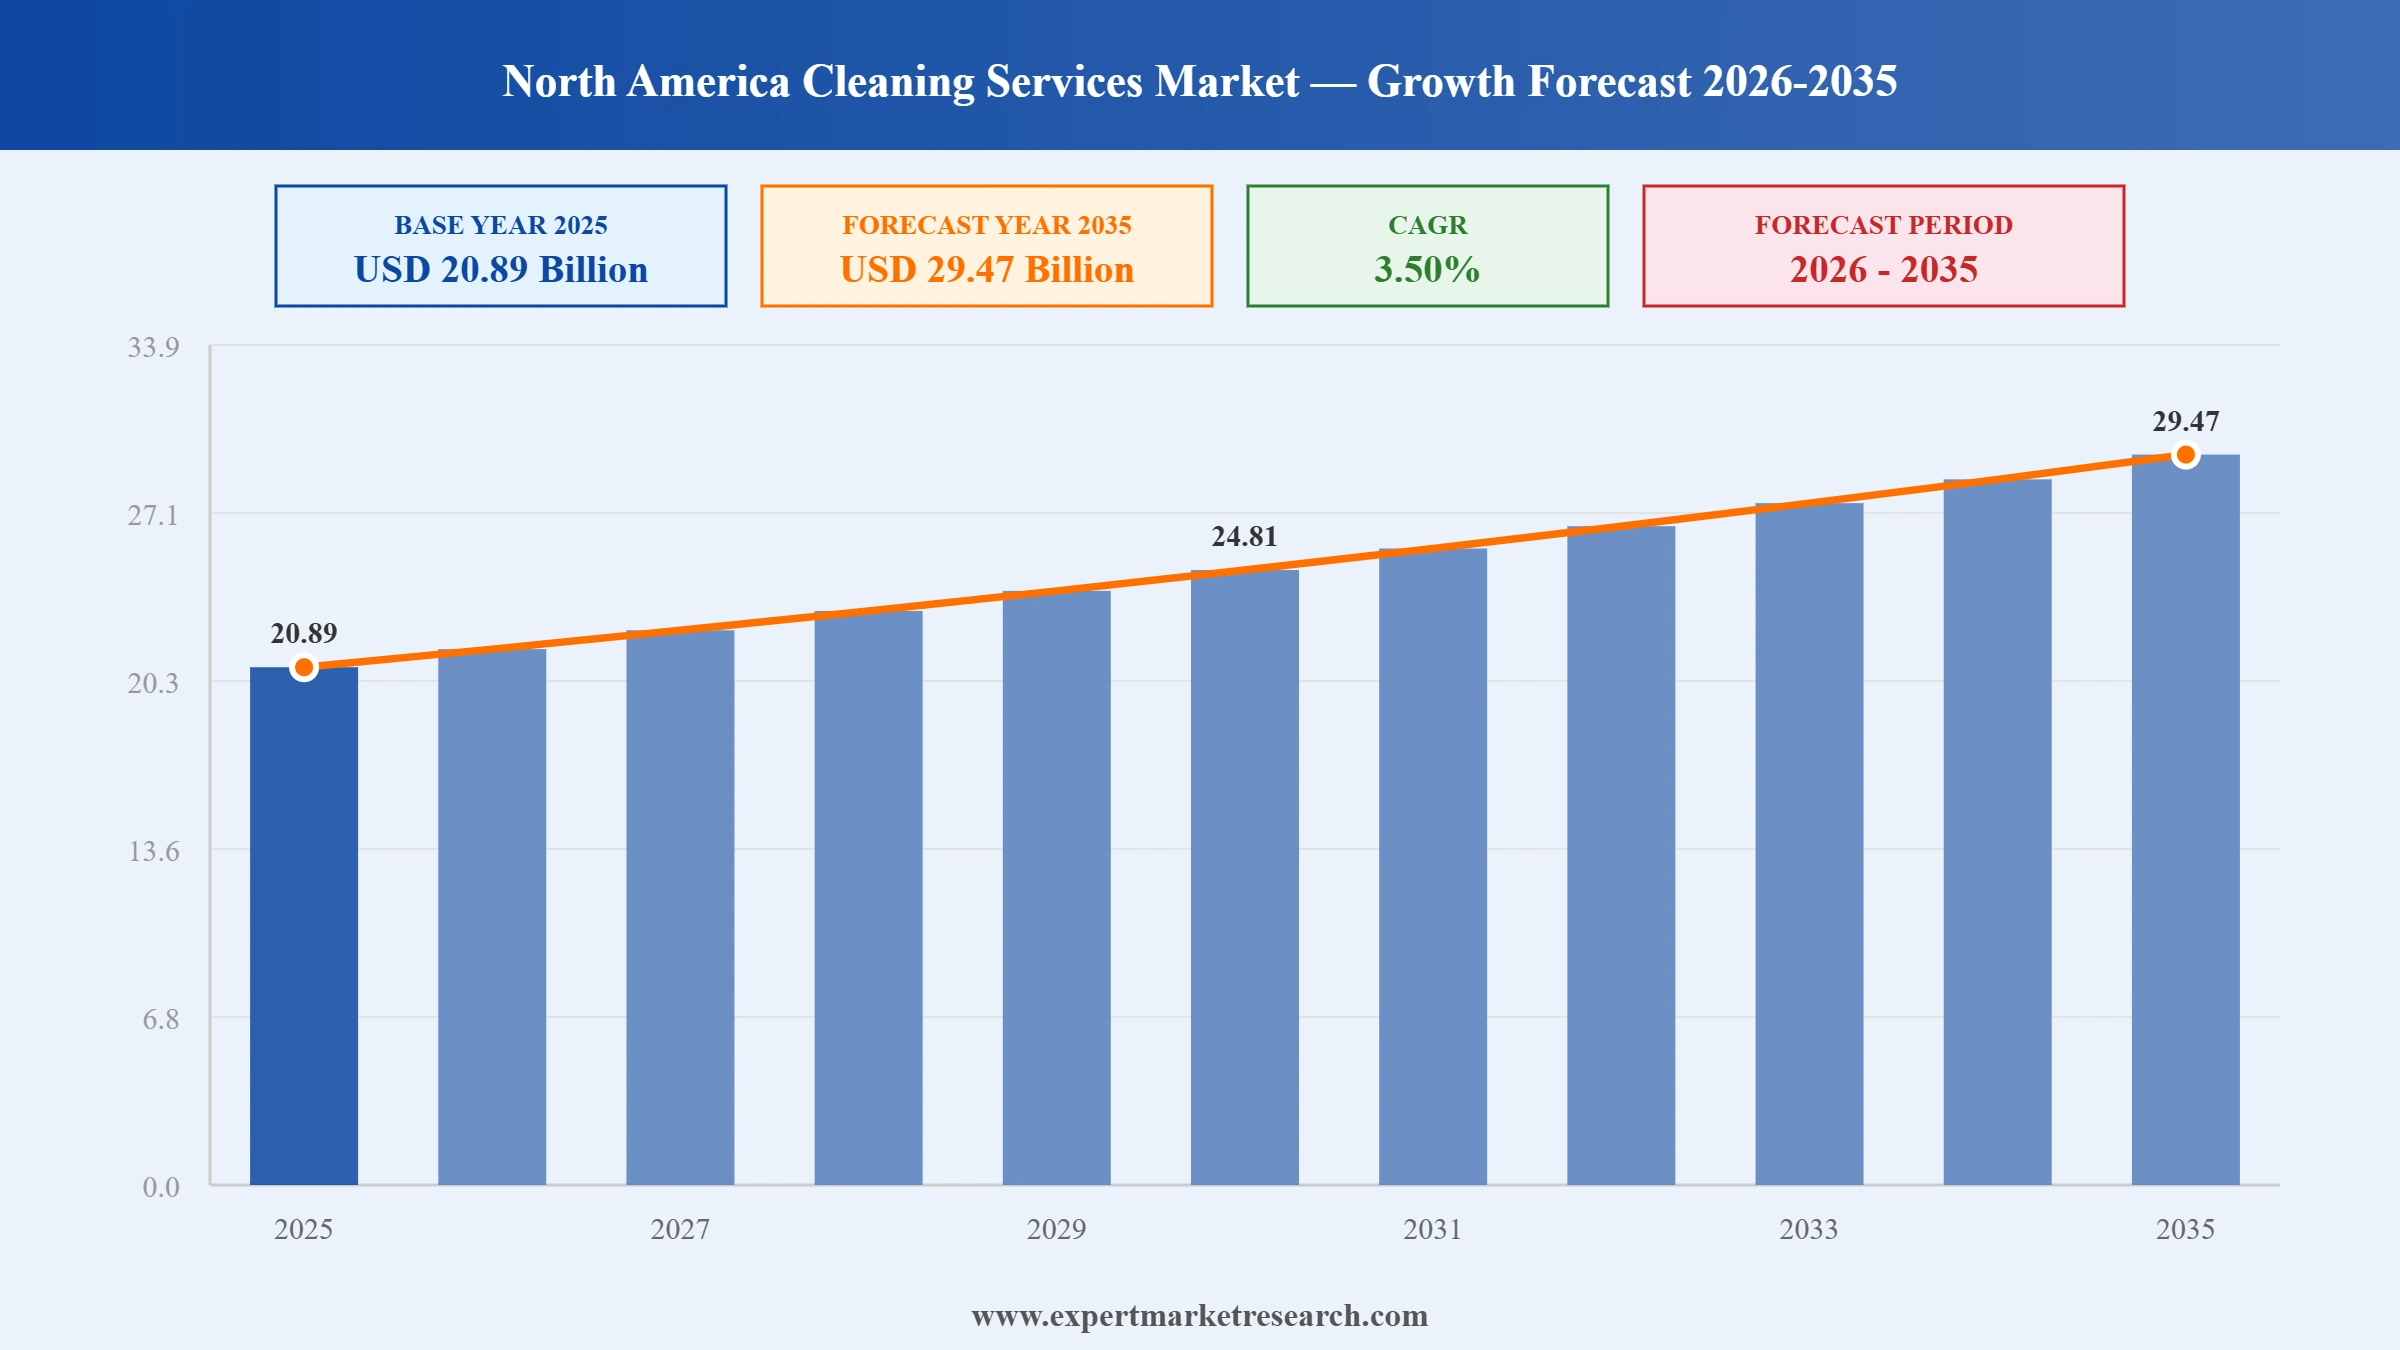
The North America cleaning services market reached a value of USD 20.89 Billion at 2025 and is projected to expand at a CAGR of around 3.50% during the forecast period of 2026-2035. With increasing airborne illness concerns driving heightened hygiene awareness, rising real estate investment expanding the commercial cleaning opportunity, growing adoption of smart technologies and IoT-enabled cleaning solutions, and the surging demand for outsourced cleaning services from construction and healthcare industries, the market is expected to reach USD 29.47 Billion by 2035.
Read more about this report - REQUEST FREE SAMPLE COPY IN PDF
The North America cleaning services market is undergoing meaningful transformation, shaped by accelerating M&A activity among leading integrated facility services providers, growing adoption of eco-friendly and biodegradable cleaning solutions, and technology-driven innovations including AI-based scheduling and smart cleaning platforms. These developments are reshaping service delivery models across commercial, healthcare, and institutional cleaning segments.
GDI Integrated Facility Services significantly expanded its US janitorial services platform in December 2025 by acquiring Performance Environmental Services in Connecticut and Northeast Services across Massachusetts, Rhode Island, and New Hampshire, growing its commercial cleaning footprint across the US Northeast.
Sodexo completed the rollout of fully biodegradable chemical lines across its North American healthcare portfolio in January 2025, achieving its 2026 sustainability pledge one year ahead of schedule and setting a new benchmark for eco-friendly cleaning practices across hospital facilities.
ABM Industries was awarded a multi-year housekeeping contract for Chase Field in Arizona in March 2024, covering over 1.3 million square feet of the Arizona Diamondbacks' stadium facility, expanding ABM's commercial cleaning portfolio across major sports and entertainment venues.
GDI Integrated Facility Services completed the acquisition of Paramount Building Solutions in March 2024, further strengthening its commercial janitorial services capabilities and broadening its client base and service coverage across North America's commercial real estate and facilities management sectors.
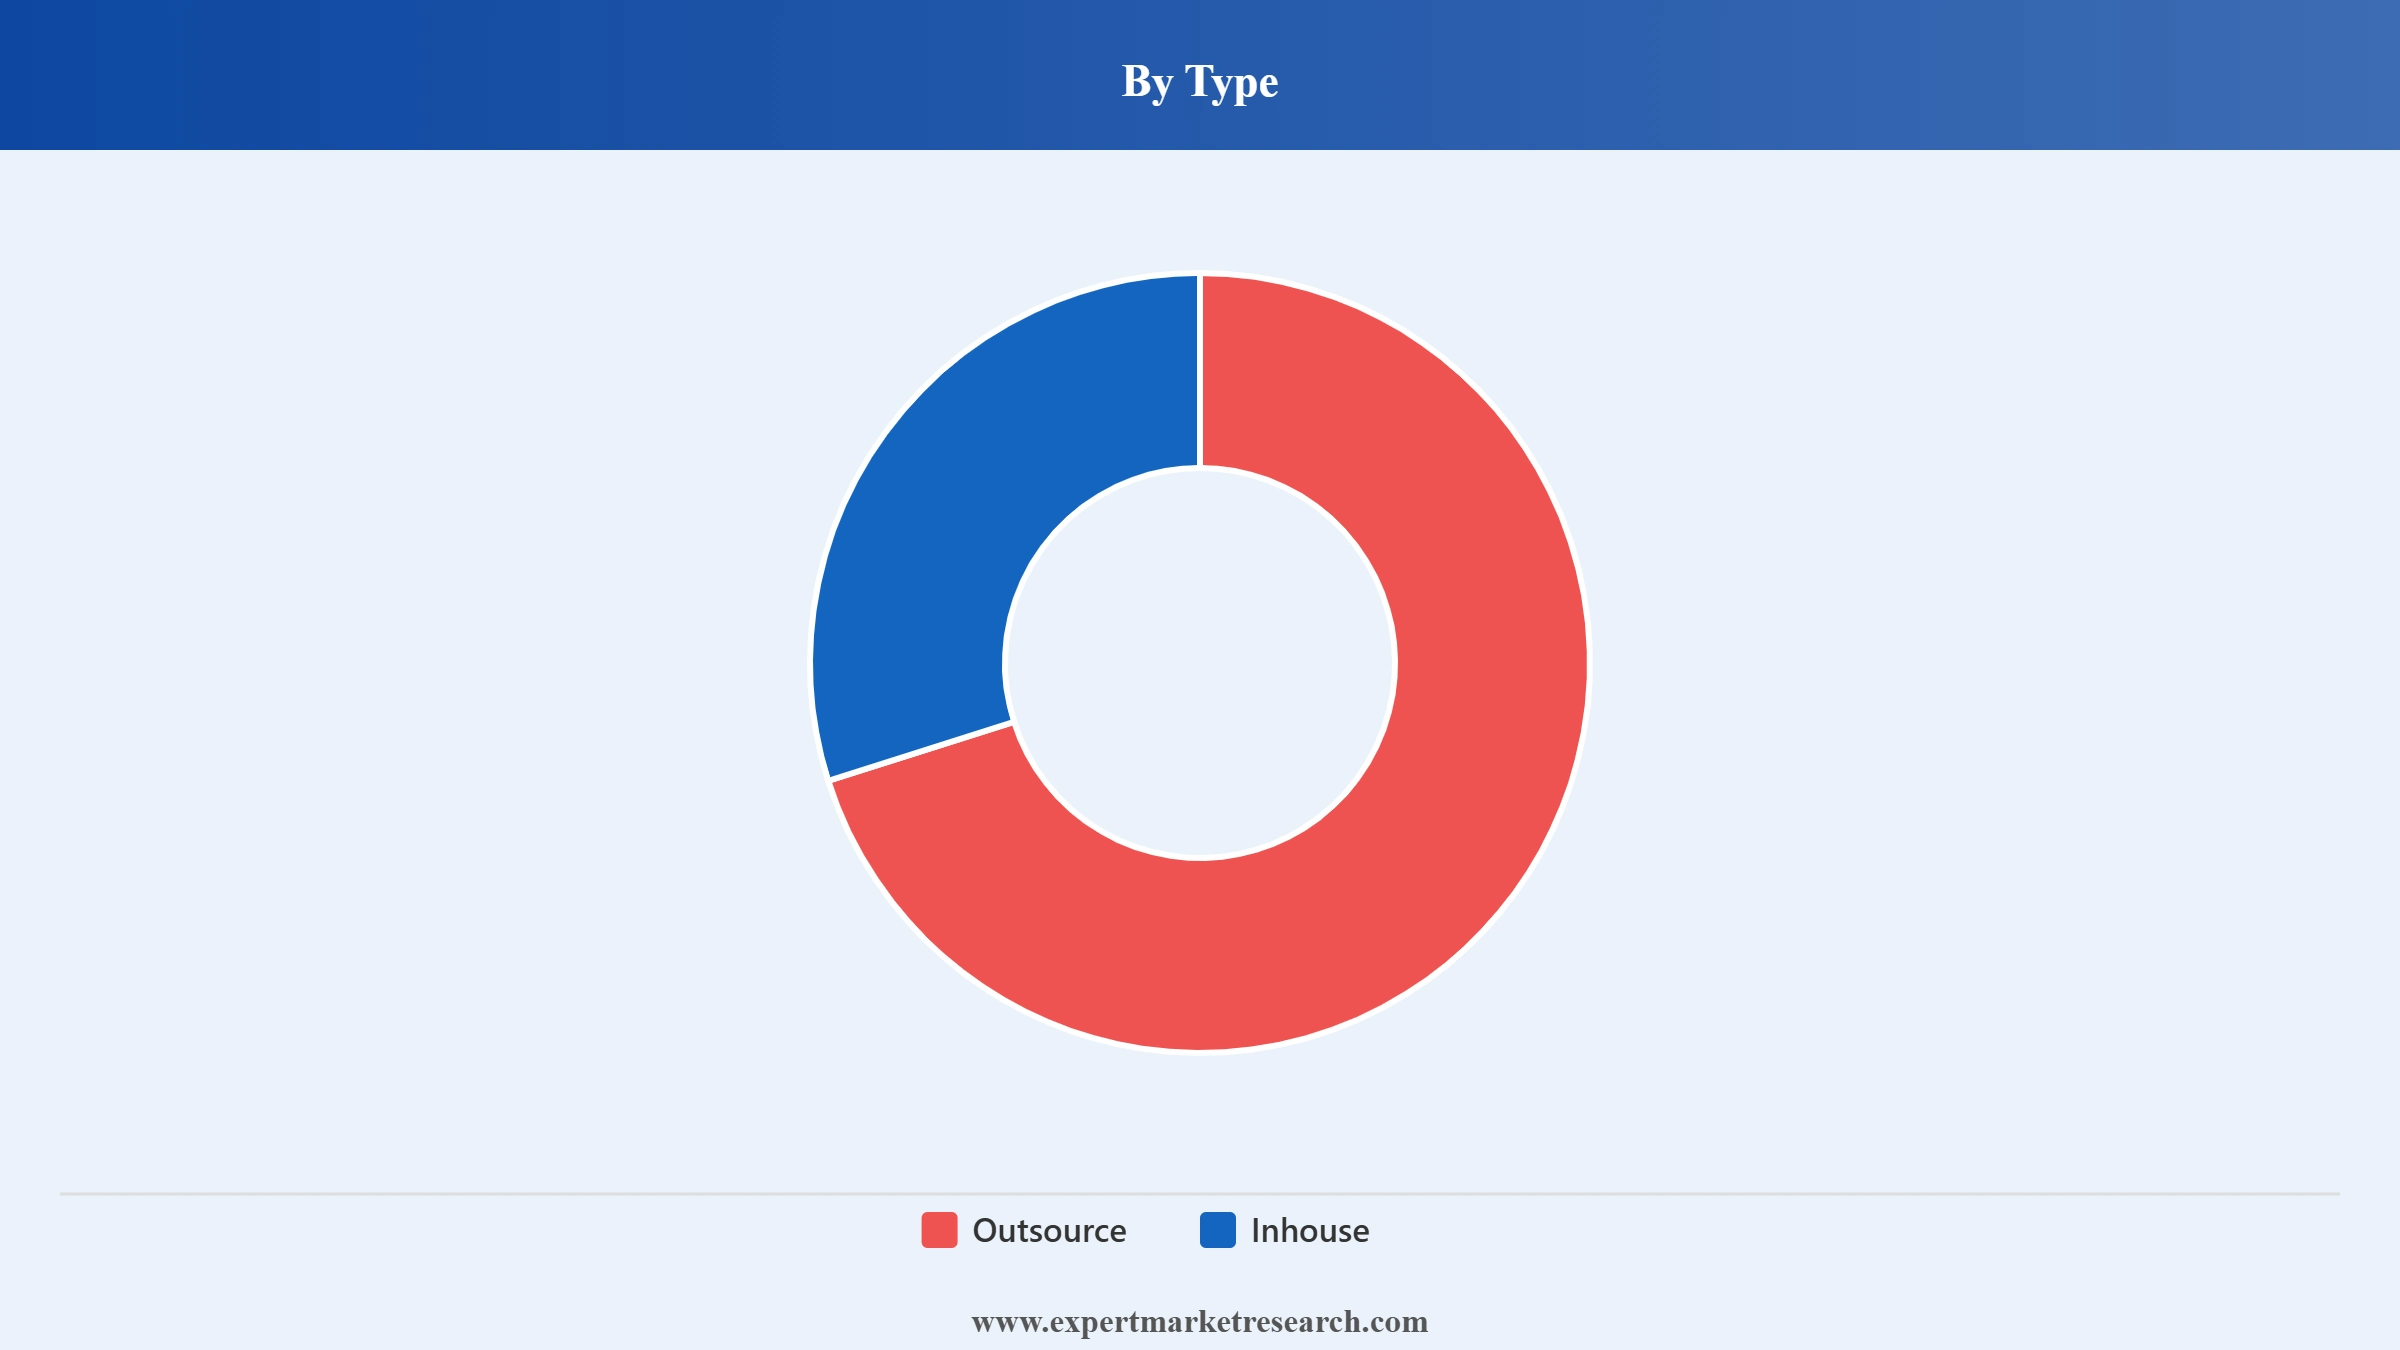
Outsourced cleaning services are the dominant type in the North America cleaning services market. In the United States, 10% of business-sector cleaning jobs are contractual, and commercial cleaning accounts for 31% of industry market share, demonstrating strong enterprise outsource adoption.
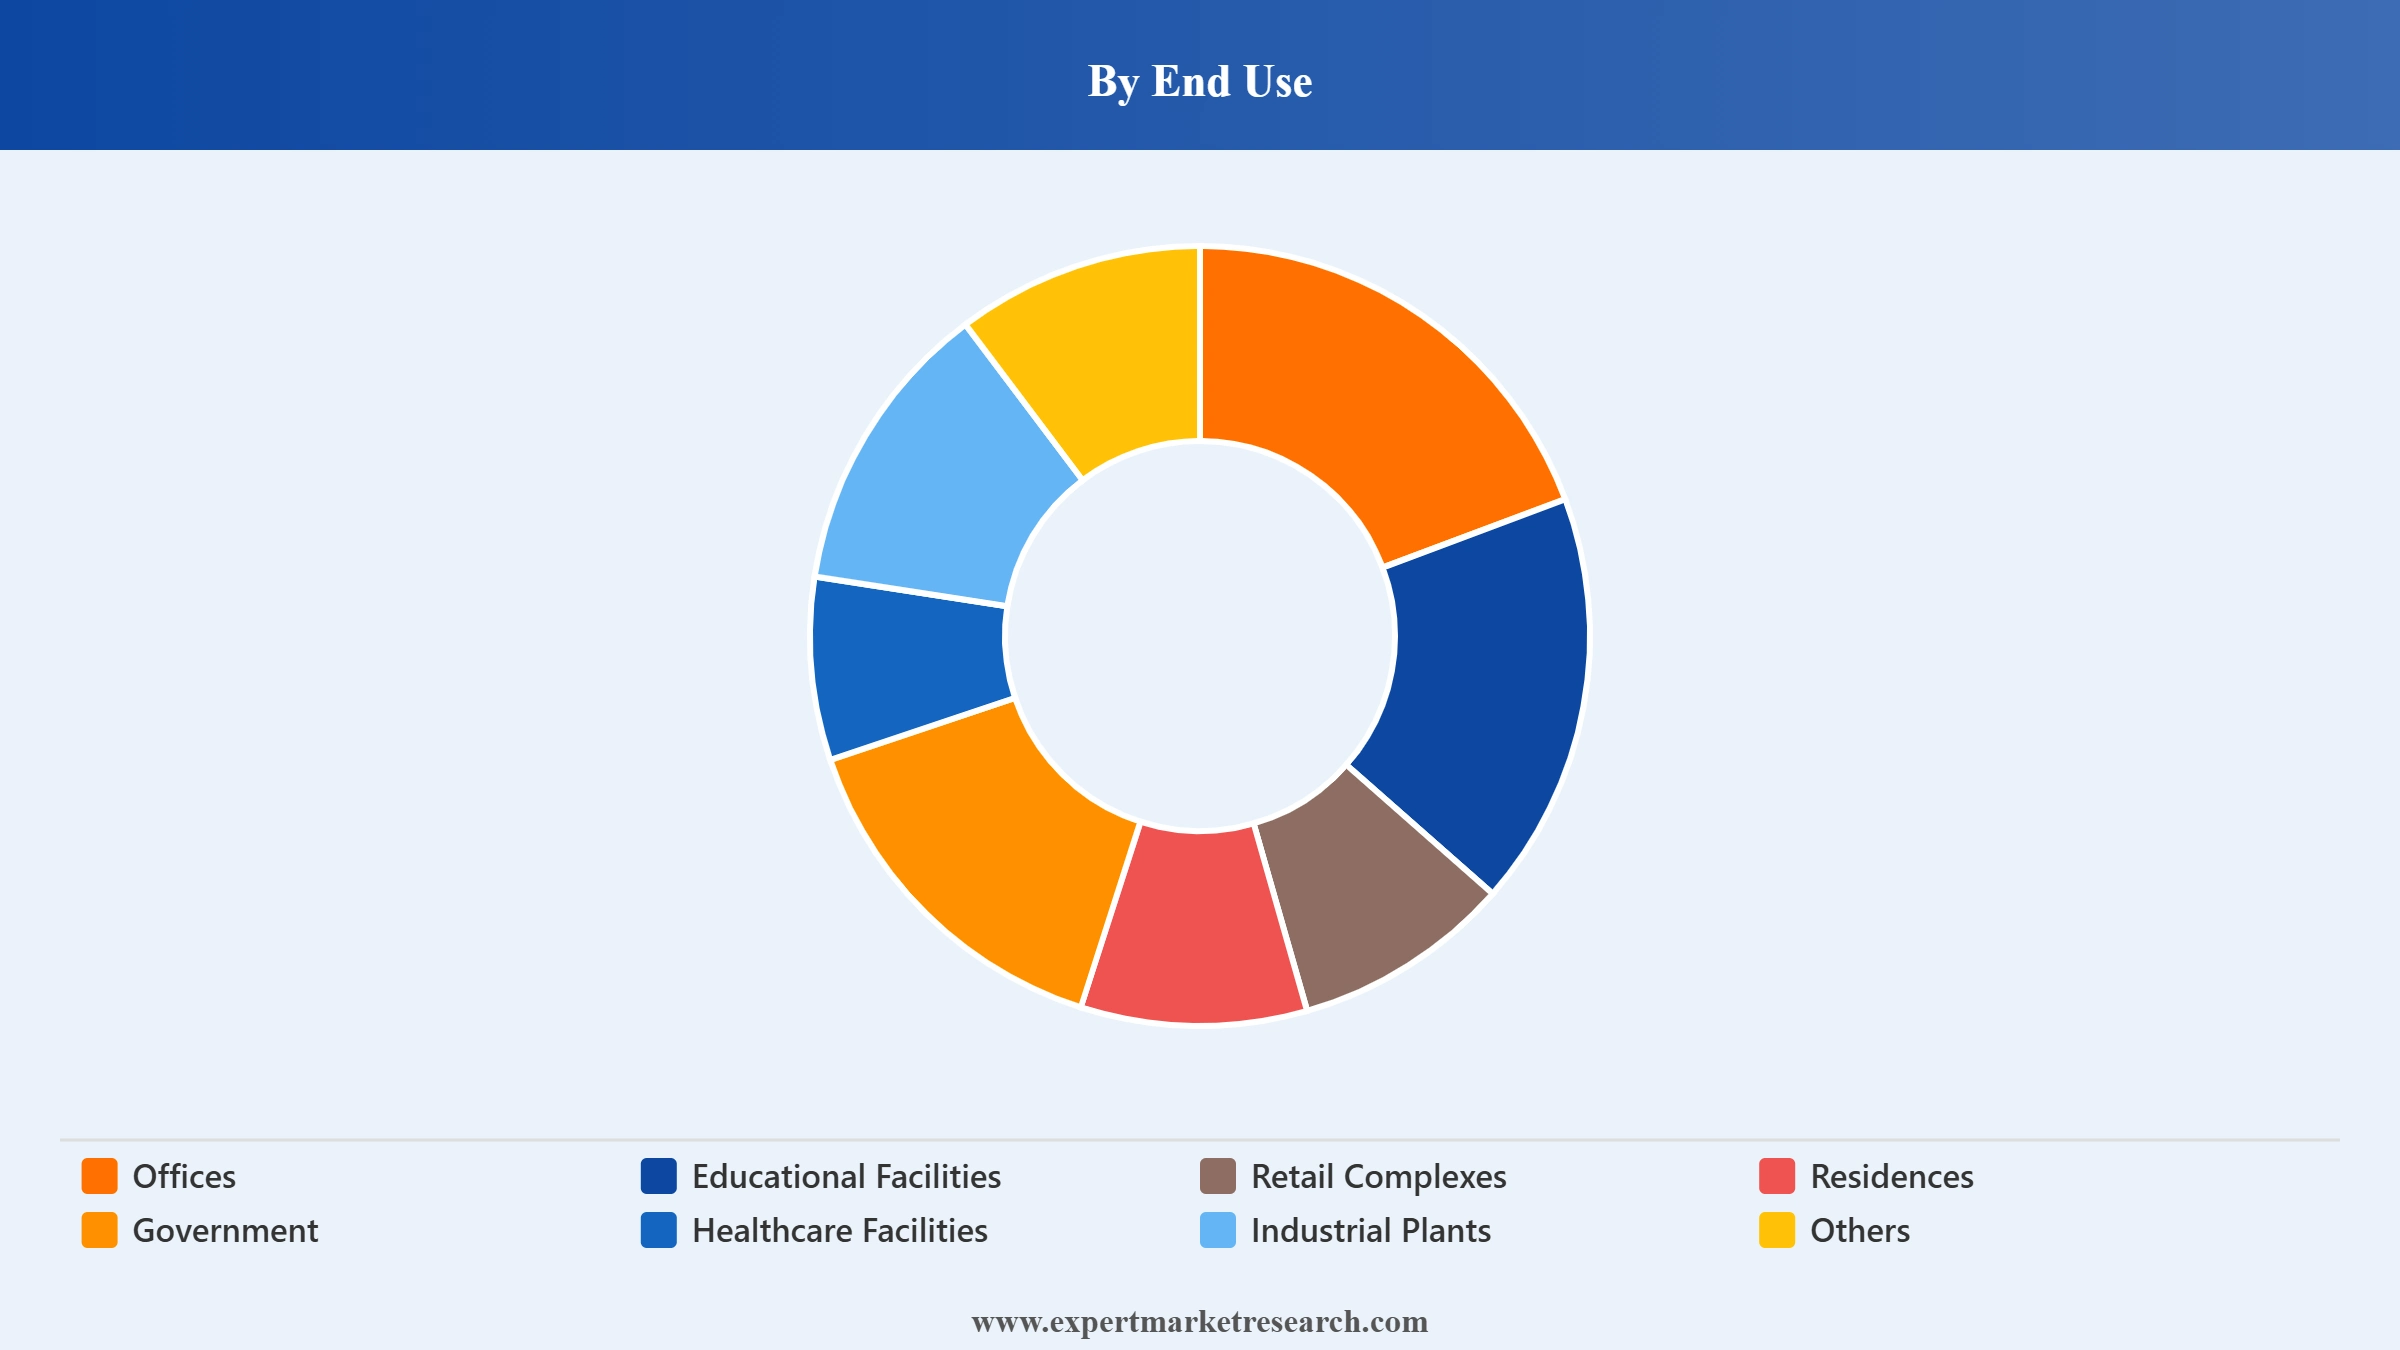
Offices are the dominant end use in the North America cleaning services market, driven by growing demand for professional work environments. ABM Industries, ISS Group, and Sodexo are among the largest providers serving the US and Canadian office cleaning segment.
Healthcare facilities are a fast-growing segment in North America's cleaning services market due to infection prevention demands. Sodexo completed a biodegradable chemicals rollout across its North American healthcare portfolio in January 2025, meeting its 2026 sustainability commitment one year early.
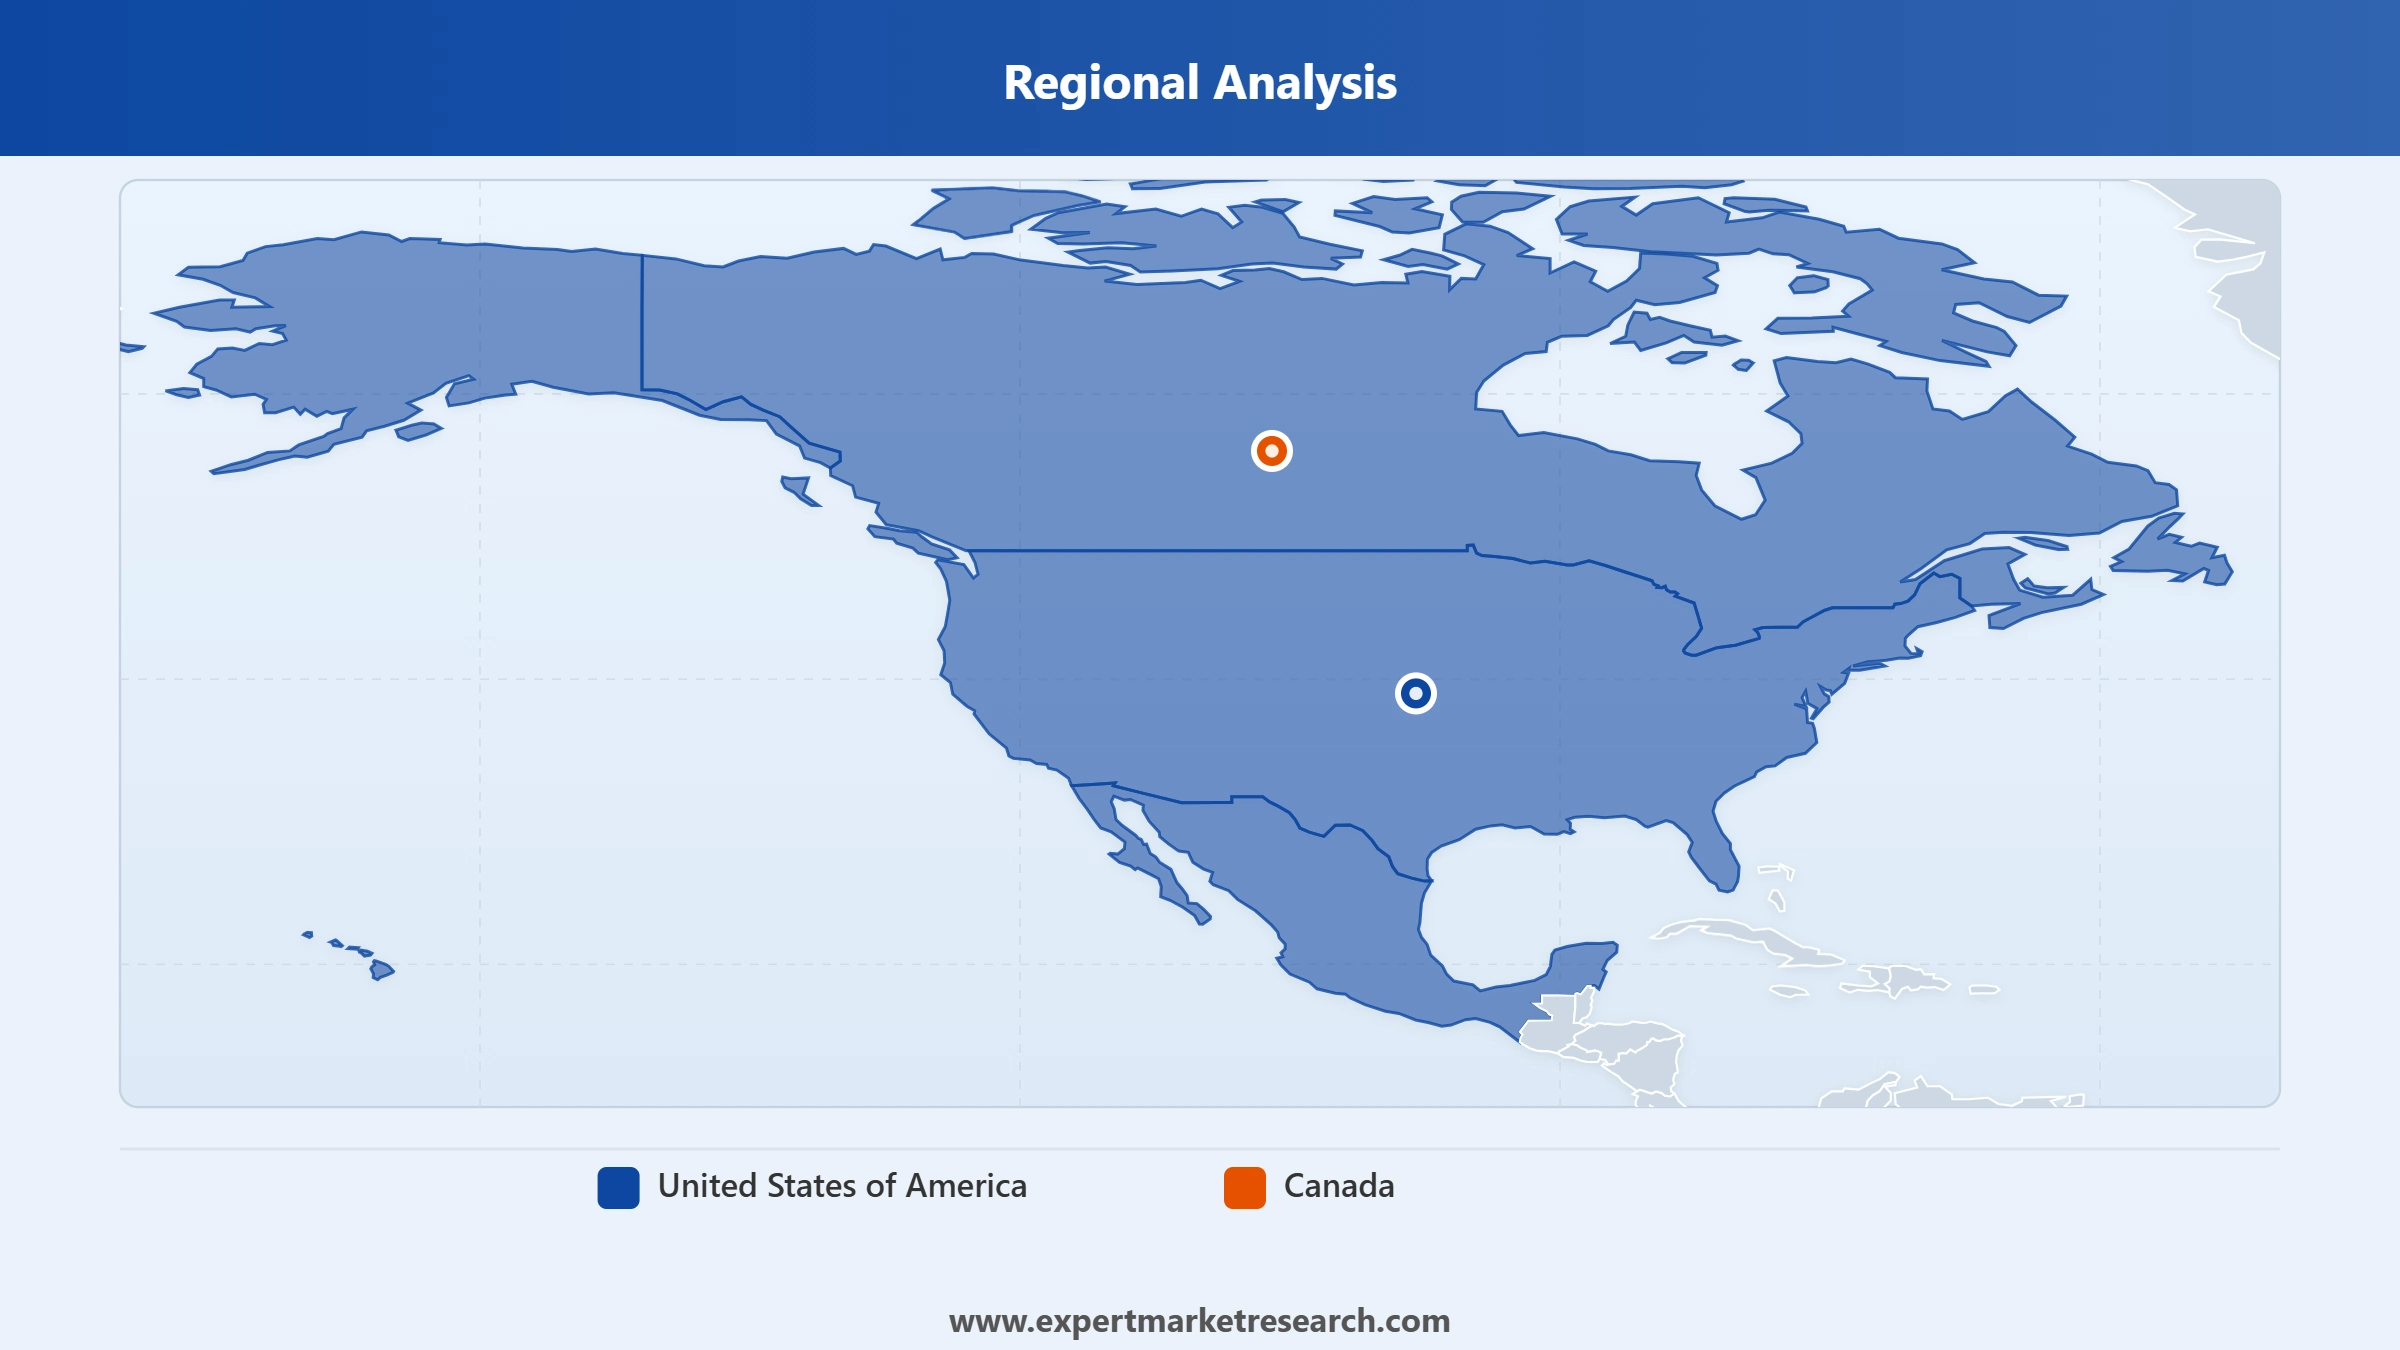
The United States dominates the North America cleaning services market, with approximately 875,000 active cleaning companies. Over 1 million janitorial service businesses were operating in the US as of 2021, with 10% of households hiring professional residential cleaners each year.
Canada is a growing market in the North America cleaning services market, driven by rising commercial real estate investment, growing urban populations, and increasing outsourced facility service adoption. GDI Integrated Facility Services leads Canada's janitorial and facility management services sector.
The report by Expert Market Research titled "North America Cleaning Services Market Report and Forecast 2026-2035" offers a detailed analysis of the market based on the following segments:
Market Breakup by Type
Key Insight: Outsourced cleaning services hold the dominant share in the North America cleaning services market by type, driven by cost savings, operational flexibility, and quality assurance that commercial and institutional clients achieve by contracting with professional cleaning service providers. In the United States, approximately 10% of all business-sector cleaning jobs are contractual, and commercial cleaning accounts for 31% of the industry's total market share. The preference for outsourced services is particularly prevalent in office buildings, healthcare facilities, educational institutions, and large retail complexes, where consistent quality, specialized equipment, and regulatory compliance requirements make third-party providers more cost-effective than in-house cleaning staff. Inhouse cleaning is retained in sensitive government facilities and specialized industrial environments.
Market Breakup by End Use
Key Insight: Offices hold the dominant share of the North America cleaning services market by end use, driven by the largest commercial real estate footprint in the region, return-to-office trends, and rising corporate investment in professional and hygienic work environments. The outsourcing of office cleaning services is more prevalent than in-house approaches due to its cost-effectiveness, flexibility, and quality assurance. ABM Industries, ISS Group, and Sodexo are among the largest janitorial service providers serving US and Canadian office clients. Healthcare facilities represent the fastest-growing end use segment, driven by heightened infection prevention and control requirements, strict hygiene regulations, and increasing demand for specialized disinfection and sanitation services across hospitals, clinics, and long-term care facilities.
Market Breakup by Region
Key Insight: The United States is the dominant country in the North America cleaning services market, underpinned by approximately 875,000 active cleaning companies and over 1 million janitorial services businesses that operated as of 2021, representing a 5.7% year-on-year increase from 2020. The country accounts for the vast majority of market revenue, supported by strong commercial real estate activity, rising real estate investment, and rapidly growing residential cleaning demand. Between 2023 and 2030, the US residential cleaning market is projected to grow at approximately 6.2% annually, further reinforcing the strength of the US market. Canada is a growing market, supported by urbanisation trends, increasing construction activity, and the expansion of integrated facility services providers including GDI.


Read more about this report - REQUEST FREE SAMPLE COPY IN PDF
By Type, Outsource accounts for the dominant share of the market due to cost savings, operational flexibility, and quality assurance for commercial clients
Outsourced cleaning services dominate the North America cleaning services market by type, capturing the largest revenue share driven by the significant cost and operational advantages they offer commercial and institutional facility managers. Businesses across offices, healthcare, retail, and government sectors favour outsourcing as it eliminates the administrative burden of in-house staffing, enables access to specialised equipment and trained personnel, and offers scalable service levels. In the United States, commercial cleaning accounts for 31% of the industry's total market share, and approximately 10% of all business-sector cleaning jobs are fulfilled through contractual outsource arrangements with professional cleaning service providers.
Read more about this report - REQUEST FREE SAMPLE COPY IN PDF
Inhouse cleaning services retain a meaningful market share in the North America cleaning services market, particularly across sensitive and security-conscious end use segments including government facilities, classified industrial plants, and select healthcare environments where internal staff oversight is mandated. Inhouse cleaning is also preferred by some large corporations that maintain control over brand standards and quality. However, structural shifts toward cost optimisation and non-core business outsourcing continue to erode inhouse market share. Smart technologies such as IoT-enabled cleaning equipment and automated floor care systems are increasingly being adopted by both outsource and inhouse cleaning operations.
By End Use, Offices account for the dominant share of the market due to the largest commercial real estate footprint and high demand for professional, hygienic work environments
Offices hold the dominant end use share in the North America cleaning services market, anchored by the region's extensive commercial real estate infrastructure and rising corporate investment in maintaining clean, professional work environments for employees and visitors. The return-to-office trend following the post-pandemic period has materially increased demand for regular, high-frequency cleaning services across corporate campuses, coworking spaces, and business parks. The outsourcing of office cleaning services is highly prevalent, with major US providers including ABM Industries, ISS Group, and Sodexo serving national and multi-site office clients under long-term facility management contracts.
Read more about this report - REQUEST FREE SAMPLE COPY IN PDF
Healthcare facilities represent the fastest-growing end use segment in North America's cleaning services market, driven by increasingly stringent infection prevention and control standards, growing hospital-acquired infection concerns, and mandatory regulatory compliance across healthcare environments. Specialized cleaning services including electrostatic disinfection, UV sanitisation, and terminal cleaning are in rising demand across US and Canadian hospitals, ambulatory care centres, and long-term care facilities. Sodexo's January 2025 completion of a fully biodegradable chemical rollout across its North American healthcare portfolio underscores the market's shift toward sustainable, high-performance cleaning solutions in this fast-growing segment.
United States dominates the market due to its largest commercial real estate base, the highest concentration of cleaning service providers, and mature institutional demand
The United States holds the dominant position in the North America cleaning services market, supported by approximately 875,000 active cleaning companies and over 1 million janitorial services businesses operating across the country as of 2021, reflecting 5.7% year-on-year growth from 2020. Commercial cleaning accounts for 31% of the total US cleaning industry market share, with demand driven by large office building portfolios, healthcare facilities, educational institutions, retail complexes, and industrial plants. Between 2023 and 2030, the US residential cleaning market is projected to grow at approximately 6.2% annually, reinforcing the multi-segment growth profile of the US market. Major facility services companies including ABM Industries, ISS Group, and Sodexo generate significant revenue from US commercial cleaning contracts.
Read more about this report - REQUEST FREE SAMPLE COPY IN PDF
Canada is the fastest-growing country in the North America cleaning services market, supported by rising commercial real estate development, increasing urbanisation across Toronto, Vancouver, Calgary, and Montreal, and the expanding adoption of outsourced integrated facility services. GDI Integrated Facility Services is the leading commercial janitorial and facility management provider in Canada, with a nationwide network serving office, healthcare, industrial, and government clients. GDI's December 2025 acquisition of Performance Environmental Services (Connecticut) and Northeast Services (Massachusetts, Rhode Island, New Hampshire) further demonstrates the North American expansion ambitions of Canadian-headquartered cleaning services leaders. Government initiatives and rising construction activity are expected to sustain Canada's elevated growth trajectory.
The North America cleaning services market is highly fragmented, characterised by a mix of global integrated facility services giants, mid-sized regional operators, and thousands of localised independent cleaning companies competing across commercial, residential, industrial, and institutional segments. The top players including ISS Group, Rentokil Initial, Sodexo, and GDI Integrated Facility Services compete through technology adoption, sustainability offerings, and service bundling across multi-site clients.
Strategic acquisitions are reshaping the competitive landscape, with GDI completing multiple US janitorial acquisitions in 2024-2025 to expand its Northeast US footprint. Sodexo is differentiating through sustainability-led cleaning chemistry and healthcare-focused environmental services. Technology adoption including AI-powered scheduling, IoT cleaning sensors, and smart occupancy-responsive cleaning systems is becoming a key competitive differentiator as clients demand data-driven, outcome-based service delivery.
ISS Group, founded in 1901 and headquartered in Copenhagen, Denmark, is one of the world's largest facility services companies. It serves the North America cleaning services market through its ISS North America division, providing integrated facility services including cleaning, food services, technical maintenance, and workplace management across commercial, healthcare, and technology sector clients.
Rentokil Initial plc, founded in 1903 and headquartered in Crawley, United Kingdom, is a global leader in pest control and hygiene services. The company significantly expanded in North America through its 2022 Terminix acquisition and serves the North America cleaning services market through integrated hygiene, washroom services, and facility cleaning operations.
Sodexo, founded in 1966 and headquartered in Issy-les-Moulineaux, France, is a global facility management and food services company with its North American operations headquartered in North Bethesda, Maryland. It provides outsourced cleaning, environmental services, and facilities management to healthcare, education, corporate, and government clients across the United States and Canada.
TKO Services Ltd. is a Canadian commercial cleaning and janitorial services company serving commercial, institutional, and industrial facilities across Canada. The company provides outsourced cleaning, floor care, window cleaning, and specialised sanitation services to office buildings, healthcare facilities, and retail properties, with operations concentrated in major Canadian urban markets.
Other key players in the market are GDI Integrated Facilities Service, J+A Cleaning Services Ltd, CSL Group, Orkin North America, LLC, CleanMark Group Inc., Areal Cleaning Services, and Others.
*Please note that this is only a partial list; the complete list of key players is available in the full report. Additionally, the list of key players can be customized to better suit your needs.*
Gain comprehensive intelligence on the North America cleaning services market with Expert Market Research's detailed 2026 report. Explore in-depth analysis of outsourced and inhouse service dynamics, end use segment performance across offices, healthcare, and retail facilities, country-level forecasts for the United States and Canada, and competitive positioning of key providers including ISS Group, Sodexo, and GDI. Whether you are a cleaning services company, facility manager, private equity firm, or institutional investor, this report equips you with the data-driven clarity needed to capitalise on the growing North America cleaning services market. Download your free sample today.
Global Cleaning Services Market
Benelux Cleaning Services Market
South Korea Cleaning Services Market
Australia and New Zealand Cleaning Services Market
Upto 15% Off
USD
$2999 $2699
$4839 $4355
$5999 $5099
$7259 $6170


*While we strive to always give you current and accurate information, the numbers depicted on the website are indicative and may differ from the actual numbers in the main report. At Expert Market Research, we aim to bring you the latest insights and trends in the market. Using our analyses and forecasts, stakeholders can understand the market dynamics, navigate challenges, and capitalize on opportunities to make data-driven strategic decisions.*
At 2025, the market reached an approximate value of USD 20.89 Billion.
The market is projected to grow at a CAGR of 3.50% between 2026 and 2035.
The market is estimated to witness a healthy growth in the forecast period of 2026-2035 to reach USD 29.47 Billion by 2035.
The major drivers of the market include the increase in airborne illnesses, rising awareness for cleaner environments, rising real estate investment, and growth in prepaid and post-paid cleaning services.
The countries covered in North America cleaning services market are United States of America and Canada.
Key trends aiding market expansion include the rising health and hygiene concerns, growing adoption of smart technologies, and increased demand for outsourced cleaning services by construction and healthcare industries.
A professional cleaner can provide a variety of services, such as house cleaning, carpet cleaning, laundry cleaning, and disinfection and sanitisation cleaning services.
Janitorial services are a type of commercial cleaning which manages numerous tasks in formal business settings. This includes hospitals and banking organisations.
A cleaner's only responsibility is to clean a certain area, whereas a janitor's duties also include maintenance. While janitors typically work in bigger, public settings, cleaners frequently work in smaller structures or residential locations. While janitors could work full-time, cleaners frequently operate on a contract basis.
The key players include ISS Group, Rentokil Initial plc, Sodexo, TKO Services Ltd., GDI Integrated Facilities Service, J+A Cleaning Services Ltd, CSL Group, Orkin North America, LLC, CleanMark Group Inc., and Areal Cleaning Services.
Explore our key highlights of the report and gain a concise overview of key findings, trends, and actionable insights that will empower your strategic decisions.
| REPORT FEATURES | DETAILS |
| Base Year | 2025 |
| Historical Period | 2019-2025 |
| Forecast Period | 2026-2035 |
| Scope of the Report |
Historical and Forecast Trends, Industry Drivers and Constraints, Historical and Forecast Market Analysis by Segment:
|
| Breakup by Type |
|
| Breakup by End Use |
|
| Breakup by Region |
|
| Market Dynamics |
|
| Competitive Landscape |
|
| Companies Covered |
|
Datasheet
One User
USD 2,999
USD 2,699
tax inclusive*
Single User License
One User
USD 4,839
USD 4,355
tax inclusive*
Five User License
Five User
USD 5,999
USD 5,099
tax inclusive*
Corporate License
Unlimited Users
USD 7,259
USD 6,170
tax inclusive*
*Please note that the prices mentioned below are starting prices for each bundle type. Kindly contact our team for further details.*
Flash Bundle
Small Business Bundle
Growth Bundle
Enterprise Bundle
*Please note that the prices mentioned below are starting prices for each bundle type. Kindly contact our team for further details.*
Flash Bundle
Number of Reports: 3
20%
tax inclusive*
Small Business Bundle
Number of Reports: 5
25%
tax inclusive*
Growth Bundle
Number of Reports: 8
30%
tax inclusive*
Enterprise Bundle
Number of Reports: 10
35%
tax inclusive*
How To Order

Select License Type
Choose the right license for your needs and access rights.

Click on ‘Buy Now’
Add the report to your cart with one click and proceed to register.

Select Mode of Payment
Choose a payment option for a secure checkout. You will be redirected accordingly.
Strategic Solutions for Informed Decision-Making
Gain insights to stay ahead and seize opportunities.

Get insights & trends for a competitive edge.

Track prices with detailed trend reports.

Analyse trade data for supply chain insights.

Leverage cost reports for smart savings

Enhance supply chain with partnerships.

Connect For More Information
Our expert team of analysts will offer full support and resolve any queries regarding the report, before and after the purchase.
Our expert team of analysts will offer full support and resolve any queries regarding the report, before and after the purchase.
We employ meticulous research methods, blending advanced analytics and expert insights to deliver accurate, actionable industry intelligence, staying ahead of competitors.
Our skilled analysts offer unparalleled competitive advantage with detailed insights on current and emerging markets, ensuring your strategic edge.
We offer an in-depth yet simplified presentation of industry insights and analysis to meet your specific requirements effectively.


