

Consumer Insights
Uncover trends and behaviors shaping consumer choices today
Procurement Insights
Optimize your sourcing strategy with key market data
Industry Stats
Stay ahead with the latest trends and market analysis.
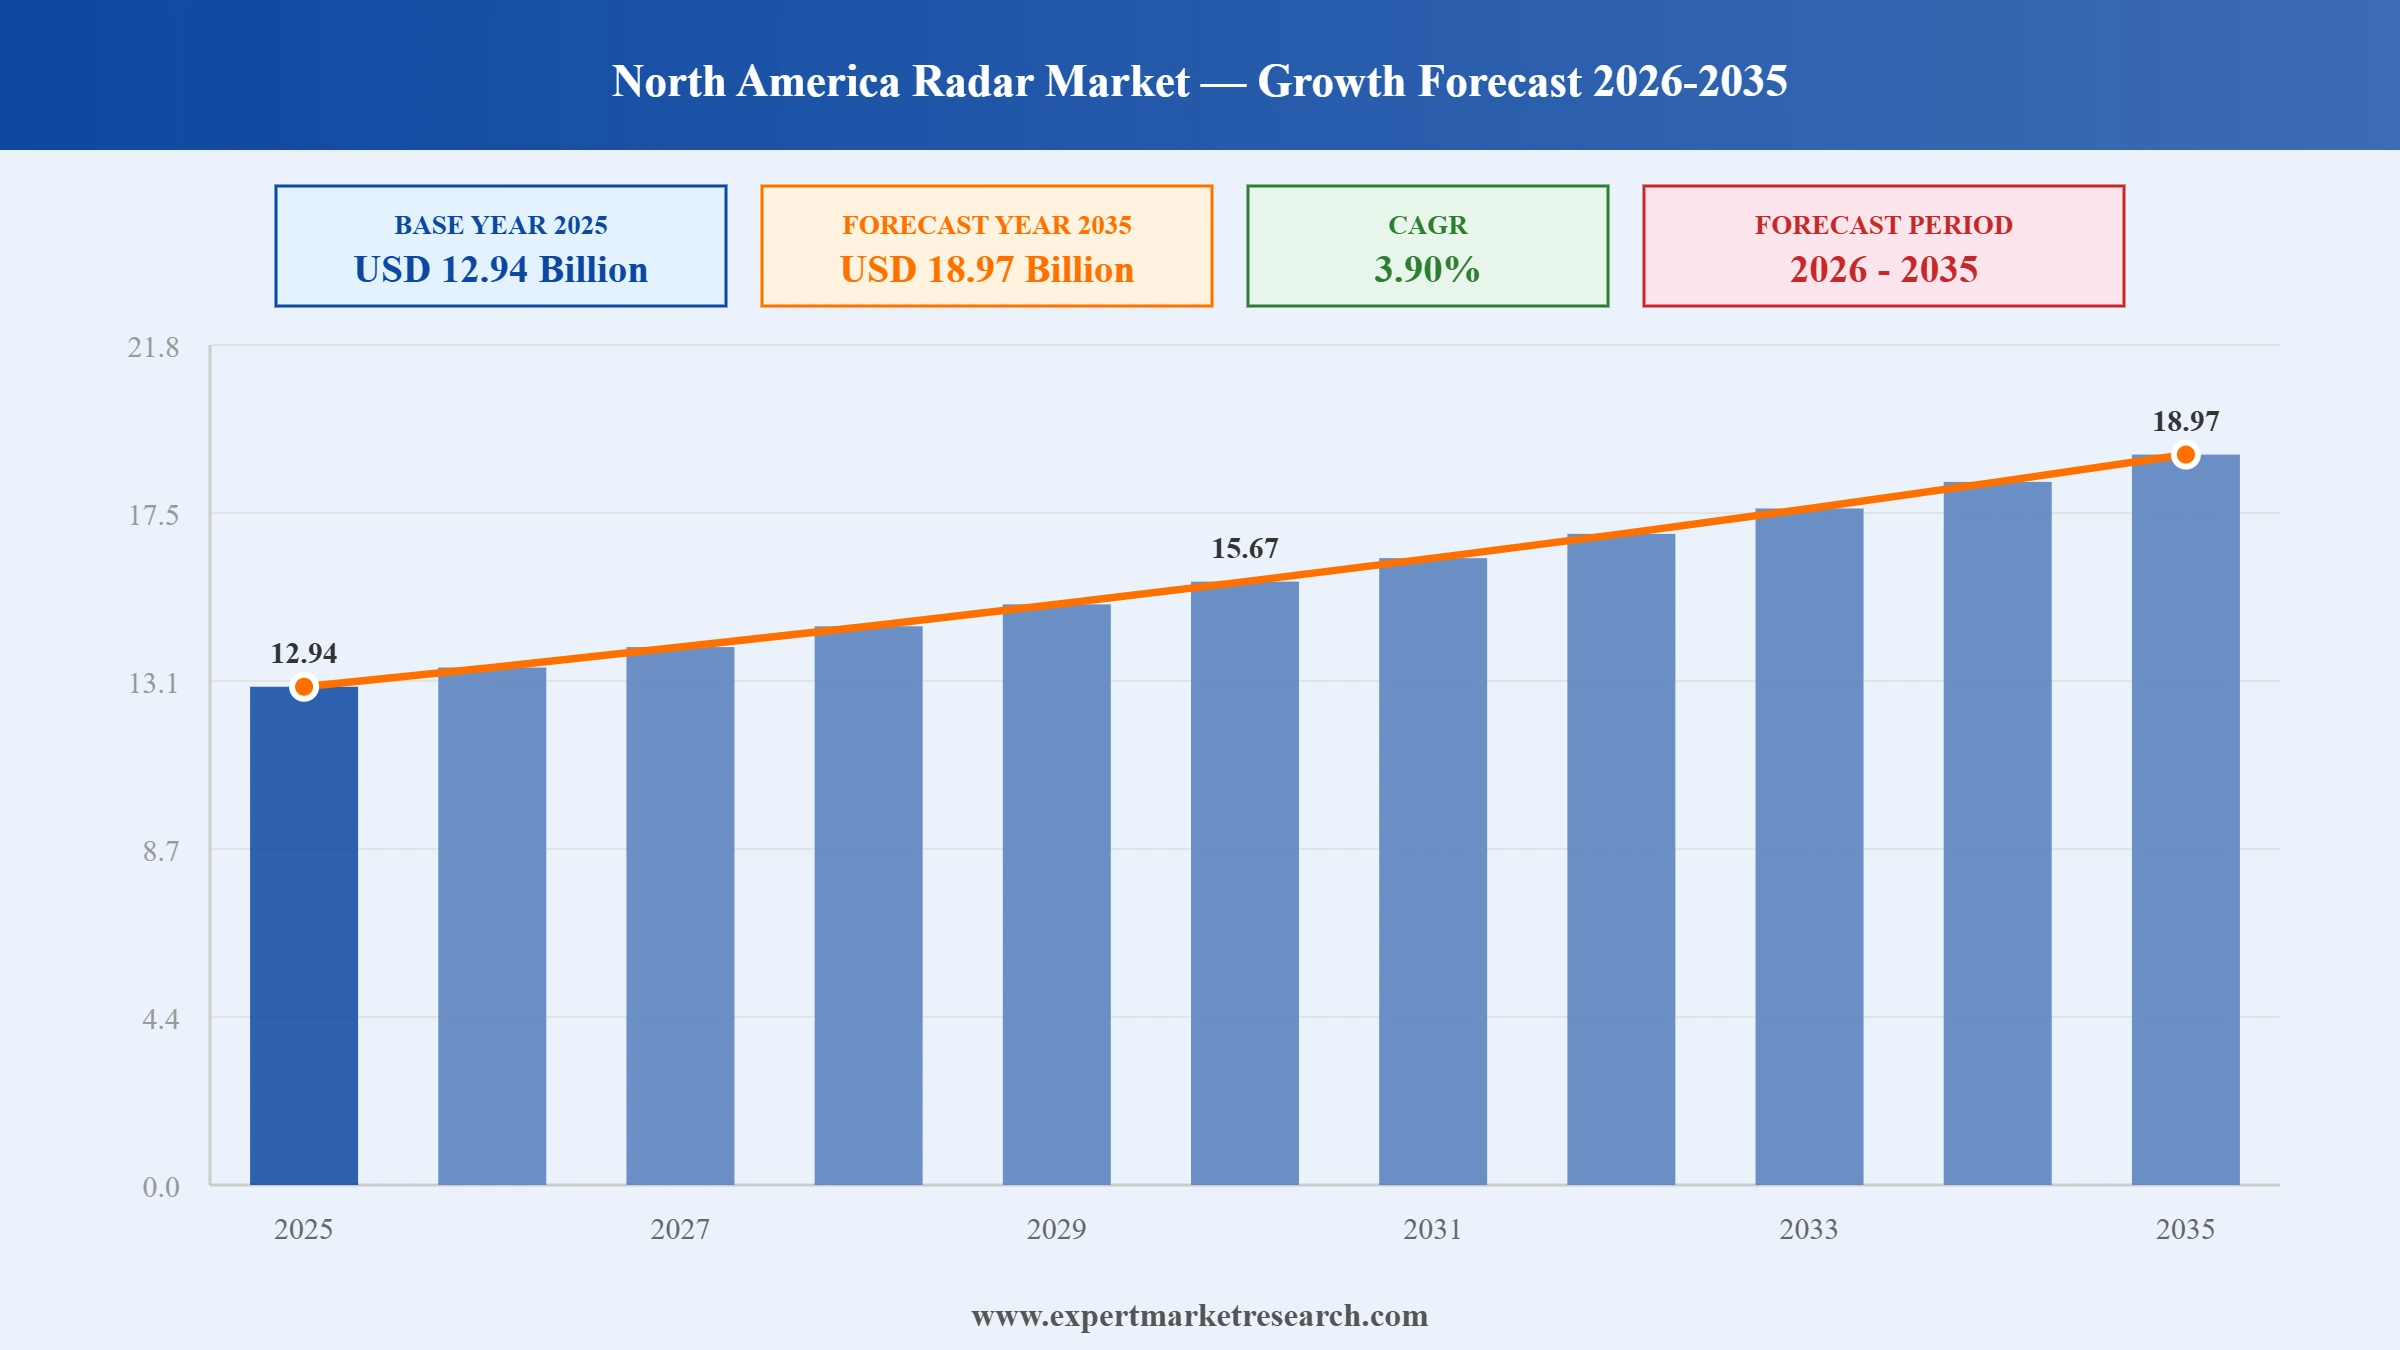
The North America radar market reached around USD 12.94 Billion in 2025. The market is projected to grow at a CAGR of 3.90% between 2026 and 2035 to reach nearly USD 18.97 Billion by 2035.
The United States ranks as the second-largest market globally for both vehicle sales and production.
Canada stands as one of the largest aerospace markets globally. In 2022, it was the sole nation to secure a position within the top five rankings for civil flight simulators, engines, and aircraft sub-segments.
The defence budget of the United States saw an increase of $55 billion between the years 2022 and 2023.
Read more about this report - REQUEST FREE SAMPLE COPY IN PDF
| North America Radar Market Report Summary | Description | Value |
| Base Year | USD Billion | 2025 |
| Historical Period | USD Billion | 2019-2025 |
| Forecast Period | USD Billion | 2026-2035 |
| Market Size 2025 | USD Billion | 12.94 |
| Market Size 2035 | USD Billion | 18.97 |
| CAGR 2019-2025 | Percentage | XX% |
| CAGR 2026-2035 | Percentage | 3.90% |
| CAGR 2026-2035 - Market by Country | United States | 4.0% |
| CAGR 2026-2035 - Market by Radar Service | Support and Maintenance | 4.6% |
| CAGR 2026-2035 - Market by Platform | Space Based | 4.9% |
| 2025 Market Share by Country | Canada | 12.2% |
The trade tensions between the United States and China, along with disruptions in supply chains, the conflict between Russia and Ukraine, and the general instability of the global order have resulted in significant geopolitical strain for North America. The United States possesses the world's most formidable military, with substantial government investments directed towards this sector. During times of geopolitical unrest, radar technology becomes increasingly crucial, delivering essential capabilities for defence, surveillance, and early warning systems. In regions characterised by disputed or unstable borders, radar systems play a vital role in monitoring and securing these boundaries. They are capable of detecting and tracking the movements of military personnel, vehicles, and unauthorised entries, thereby providing early alerts regarding potential incursions or violations.
The aerospace sector in Canada contributed more than C$27 billion (approximately US$20.8 billion) to the nation's GDP. In the third quarter of 2023, the combined operating revenue of the 24 largest air carriers in Canada reached $9.6 billion. During this period, Canadian airlines facilitated the transportation of 25.0 million passengers through both scheduled and charter services. Radars play a crucial role in the monitoring and management of air traffic within controlled airspace. Air traffic control radars are responsible for tracking the position, altitude, and speed of aircraft, thereby ensuring safe distances between them and preventing potential collisions.
Increased defence spending, rising geopolitical tensions, wide applications of radars in air traffic management, and the expansion of the automotive sector are the major trends impacting the North America radar market growth.
Northrop Grumman obtained a potential contract modification valued at $167.1 million from the U.S. Navy for the provision of four lot 6 full-rate production Ground/Air Task Oriented Radar systems. G/ATOR, the multimission radar system, aims to help the Marine Corps force identify, detect, and track cruise missiles, remotely piloted vehicles, and mortar fire, among other airborne threats.
Raytheon, a subsidiary of RTX, granted a contract valued at $677 million to continue the production of AN/SPY-6(V) radars for the United States Navy. Under the contract, the US Navy aims to receive 7 radars, surging the total amount of radars under the contract for procurement to 38.
United Airlines chose Honeywell to supply avionics for its new 737 Max aircraft. Honeywell will deliver technologies such as 3D weather radar, state-of-the-art 25-hour flight data recorders, and sophisticated traffic avoidance systems.
The growth of the civil aviation sector in North America is fuelling the need for sophisticated radar systems for air traffic management, which are crucial for maintaining safety and efficiency at airports. These radar systems play a vital role in overseeing airspace, regulating air traffic, and improving safety, especially in congested air corridors.
The flourishing automotive sector in North America is increasingly integrating radar technology into vehicles for advanced driver-assistance systems. These include applications such as adaptive cruise control, collision avoidance, blind-spot detection, and autonomous driving systems, all of which rely on radar for accurate detection and response.
The persistent geopolitical tensions, especially involving major global powers and non-state entities, have heightened the focus on homeland security and defence measures. Radar systems play a vital role in providing early warnings, detecting threats, and monitoring potential dangers across air, sea, and land domains, which encompasses missile strikes and unauthorised entries into airspace.
The necessity for precise weather observation and effective disaster management, especially in areas susceptible to severe weather phenomena such as hurricanes, tornadoes, and snowstorms, fuels the demand for weather radar systems. These radars deliver essential information for forecasting and early alerts, thereby assisting in reducing the consequences of natural disasters.
The United States possesses one of the most substantial defence budgets globally, which fosters a considerable demand for sophisticated radar systems. This encompasses funding for air defence, missile detection, surveillance, and electronic warfare capabilities, all aimed at ensuring national security and sustaining global military dominance.


Read more about this report - REQUEST FREE SAMPLE COPY IN PDF
The increasing frequency and intensity of severe weather events underscore the importance of precise weather observation and effective disaster management. The demand for weather radar systems is driven by the need for accurate forecasting and early warning capabilities, which are essential for reducing the consequences of natural disasters. By investing in advanced radar technology and fostering collaboration among meteorologists, emergency responders, and community leaders, legal authorities can enhance resilience to the challenges posed by severe weather and protect lives and property in vulnerable areas.
North America Radar Market Report and Forecast 2026-2035 offers a detailed analysis of the market based on the following segments:
Market Breakup by Component
Market Breakup by Radar Service
Market Breakup by Platform
Market Breakup by End Use
Market Breakup by Country
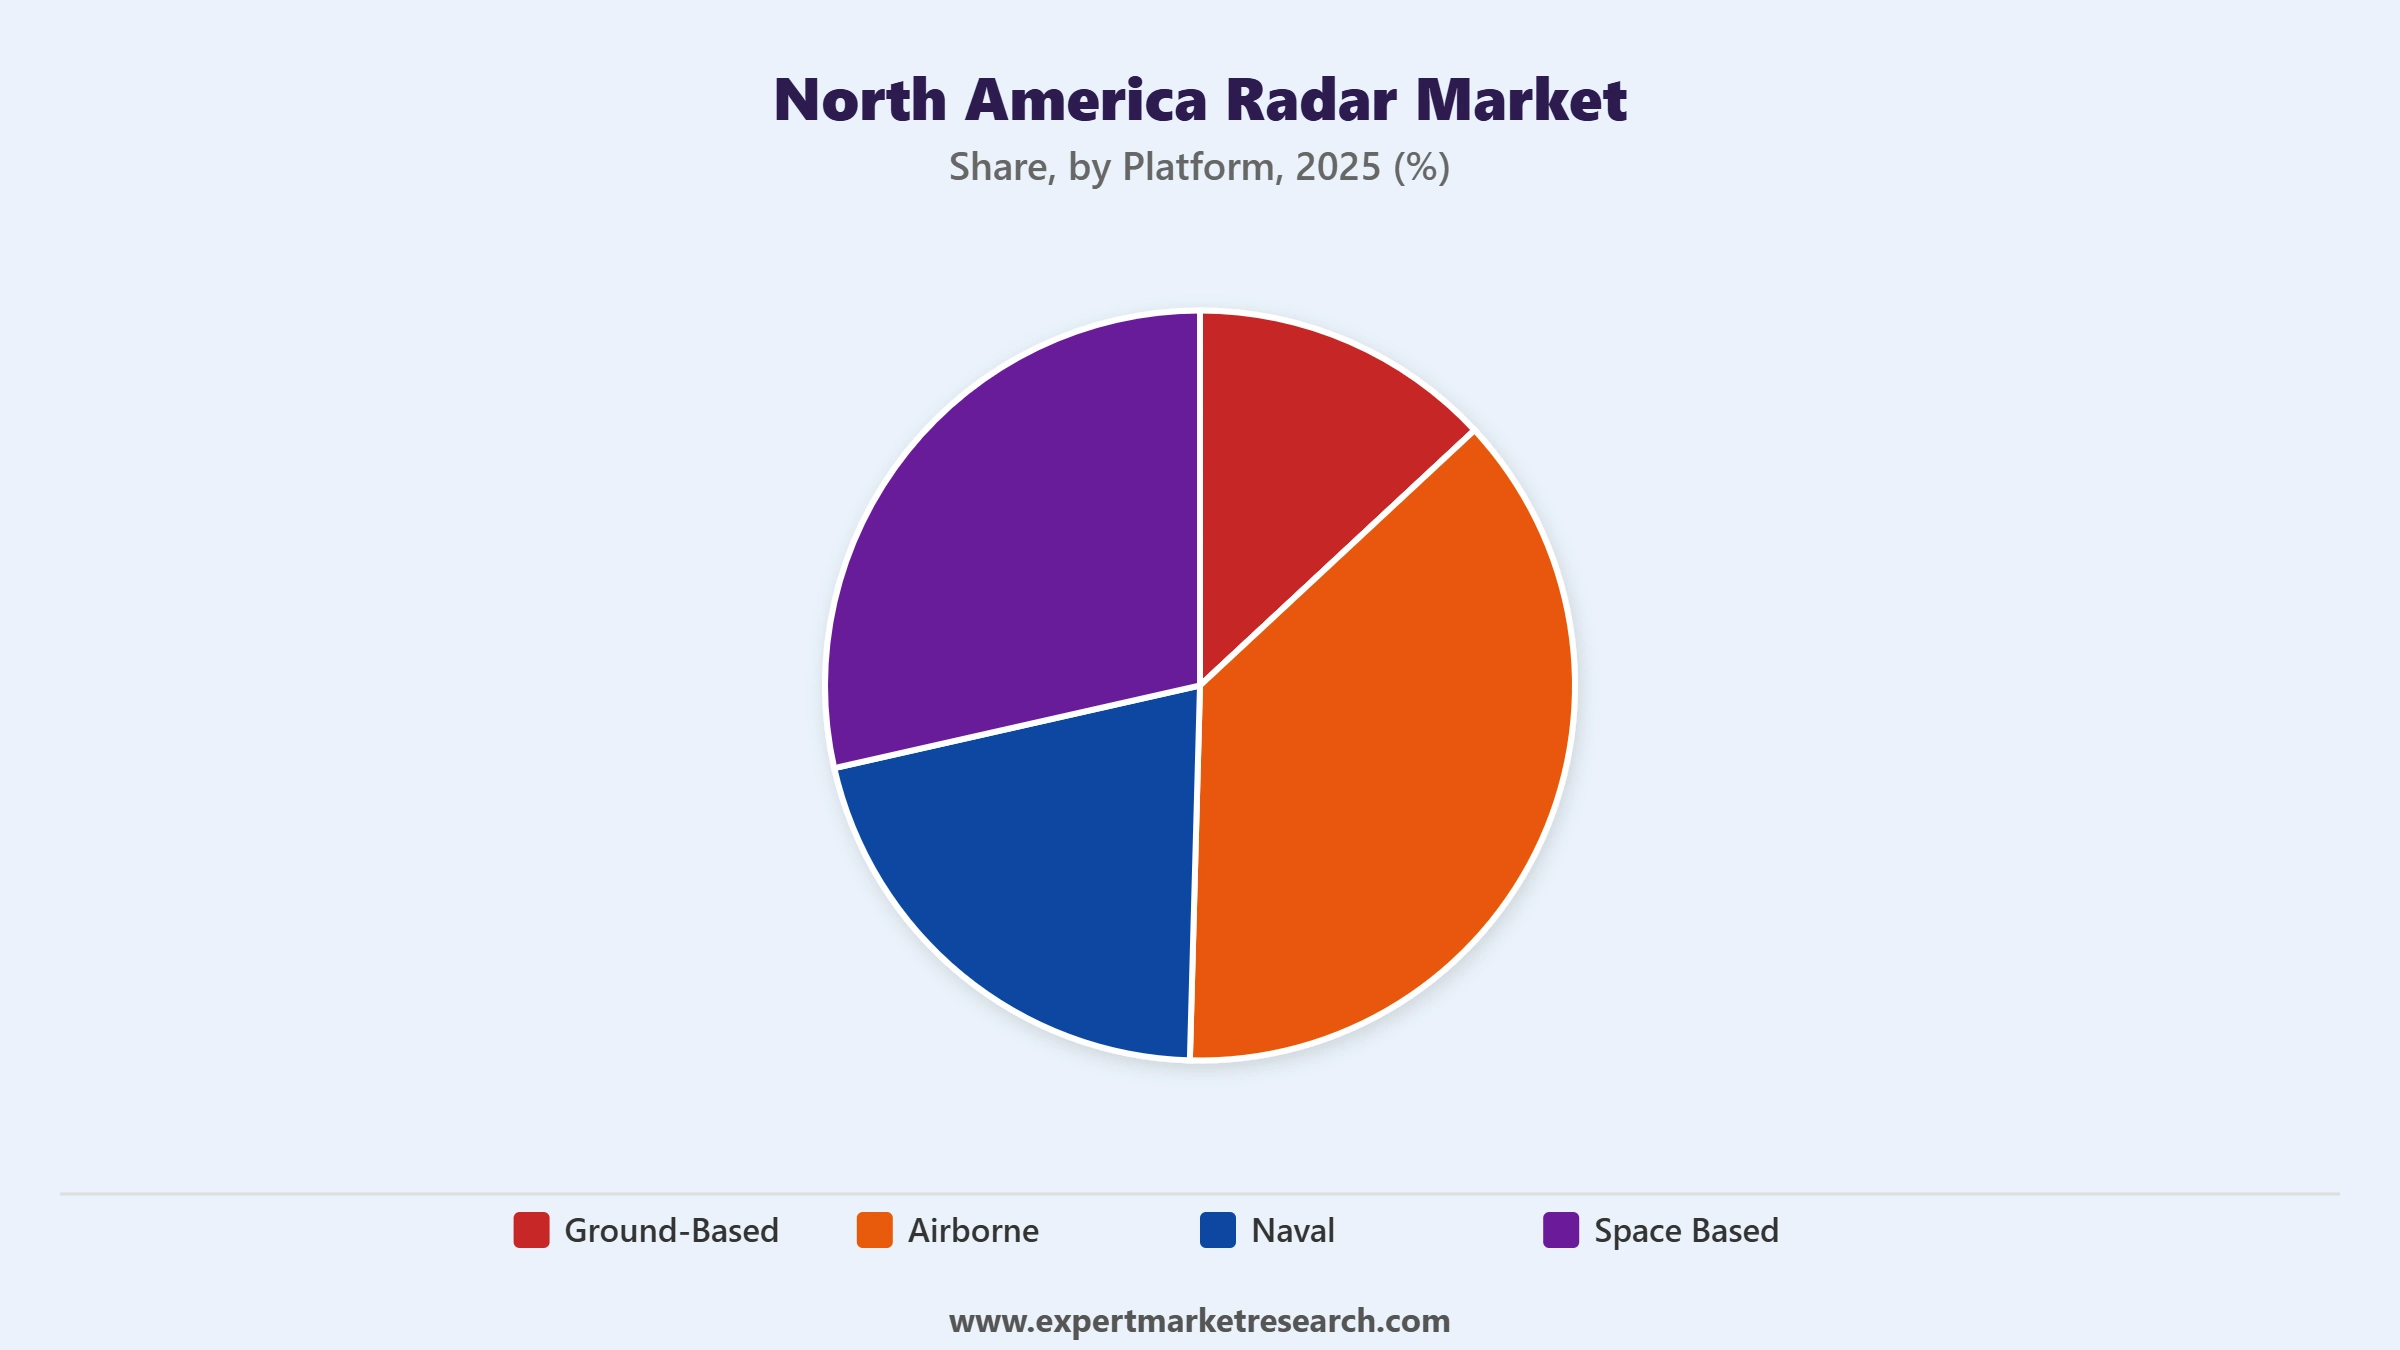
Based on the platform, the market is segmented into ground-based, airborne, naval, and space based. The space based segment is projected to grow at a CAGR of 4.9% during the forecast period of 2026-2035. Space based radar serves as a robust instrument applicable to various fields, offering essential information for scientific research, environmental monitoring, and security operations.
Read more about this report - REQUEST FREE SAMPLE COPY IN PDF
Major players are focusing on the adoption of 3D and 4D radar technologies to gain a competitive edge in the market.
The comprehensive report looks into the macro and micro aspects of the market. The EMR report gives an in-depth insight into the market by providing a SWOT analysis as well as an analysis of Porter’s Five Forces model.
Upto 15% Off
USD
$2499 $2249
$3999 $3599
$4999 $4249
$5999 $5099


*While we strive to always give you current and accurate information, the numbers depicted on the website are indicative and may differ from the actual numbers in the main report. At Expert Market Research, we aim to bring you the latest insights and trends in the market. Using our analyses and forecasts, stakeholders can understand the market dynamics, navigate challenges, and capitalize on opportunities to make data-driven strategic decisions.*
In 2025, the market attained a value of nearly USD 12.94 Billion.
The market is assessed to grow at a CAGR of 3.90% between 2026 and 2035.
The market is estimated to reach around USD 18.97 Billion by 2035.
The market is being driven by the rising application of radars in natural disaster management and weather forecasting and increasing geopolitical tension in the region.
The key trends aiding the market expansion include the expansion of the automotive sector and the rising application of radars in air traffic management.
The major end uses of the radar are military applications, air traffic control, remote sensing, and ground traffic control, among others.
The countries considered in the market are the United States and Canada.
The major players in the market are Honeywell International Inc., Lockheed Martin Corporation, Northrop Grumman Corp., BAE Systems Plc, RTX Corp., Thales S.A., Saab AB, SRC Inc., General Dynamics Corp., and Leonardo S.p.A, among others.
Explore our key highlights of the report and gain a concise overview of key findings, trends, and actionable insights that will empower your strategic decisions.
| REPORT FEATURES | DETAILS |
| Base Year | 2025 |
| Historical Period | 2019-2025 |
| Forecast Period | 2026-2035 |
| Scope of the Report |
Historical and Forecast Trends, Industry Drivers and Constraints, Historical and Forecast Market Analysis by Segment
|
| Breakup by Component |
|
| Breakup by Radar Service |
|
| Breakup by Platform |
|
| Breakup by End Use |
|
| Breakup by Region |
|
| Market Dynamics |
|
| Competitive Landscape |
|
| Companies Covered |
|
Datasheet
One User
USD 2,499
USD 2,249
tax inclusive*
Single User License
One User
USD 3,999
USD 3,599
tax inclusive*
Five User License
Five User
USD 4,999
USD 4,249
tax inclusive*
Corporate License
Unlimited Users
USD 5,999
USD 5,099
tax inclusive*
*Please note that the prices mentioned below are starting prices for each bundle type. Kindly contact our team for further details.*
Flash Bundle
Small Business Bundle
Growth Bundle
Enterprise Bundle
*Please note that the prices mentioned below are starting prices for each bundle type. Kindly contact our team for further details.*
Flash Bundle
Number of Reports: 3
20%
tax inclusive*
Small Business Bundle
Number of Reports: 5
25%
tax inclusive*
Growth Bundle
Number of Reports: 8
30%
tax inclusive*
Enterprise Bundle
Number of Reports: 10
35%
tax inclusive*
How To Order

Select License Type
Choose the right license for your needs and access rights.

Click on ‘Buy Now’
Add the report to your cart with one click and proceed to register.

Select Mode of Payment
Choose a payment option for a secure checkout. You will be redirected accordingly.
Strategic Solutions for Informed Decision-Making
Gain insights to stay ahead and seize opportunities.

Get insights & trends for a competitive edge.

Track prices with detailed trend reports.

Analyse trade data for supply chain insights.

Leverage cost reports for smart savings

Enhance supply chain with partnerships.

Connect For More Information
Our expert team of analysts will offer full support and resolve any queries regarding the report, before and after the purchase.
Our expert team of analysts will offer full support and resolve any queries regarding the report, before and after the purchase.
We employ meticulous research methods, blending advanced analytics and expert insights to deliver accurate, actionable industry intelligence, staying ahead of competitors.
Our skilled analysts offer unparalleled competitive advantage with detailed insights on current and emerging markets, ensuring your strategic edge.
We offer an in-depth yet simplified presentation of industry insights and analysis to meet your specific requirements effectively.


