

Consumer Insights
Uncover trends and behaviors shaping consumer choices today
Procurement Insights
Optimize your sourcing strategy with key market data
Industry Stats
Stay ahead with the latest trends and market analysis.
The omega 3 market was valued at USD 3.82 Billion in 2025. It is poised to grow at a CAGR of 8.00% during the forecast period of 2026-2035, and reach USD 8.25 Billion by 2035. The market growth is driven by rising consumer awareness of cardiovascular health benefits, increasing dietary supplement consumption, expanding functional food applications, growing aging populations, product innovation, and greater demand for preventive healthcare solutions.
Compound Annual Growth Rate
8%
Value in USD Billion
2026-2035
Read more about this report - REQUEST FREE SAMPLE COPY IN PDF
The market reached a value of approximately USD 3.82 Billion in 2025. The market is witnessing steady growth due to increasing consumer awareness of the health benefits associated with omega-3 fatty acids, particularly for cardiovascular, cognitive, and eye health. Rising demand for dietary supplements, functional foods, infant nutrition products, and pharmaceutical applications is supporting market expansion. Growing adoption of preventive healthcare practices, an aging global population, and advancements in sustainable sourcing technologies are further driving demand. Additionally, expanding availability through retail and online channels continues to enhance product accessibility and consumer reach worldwide.
Read more about this report - REQUEST FREE SAMPLE COPY IN PDF
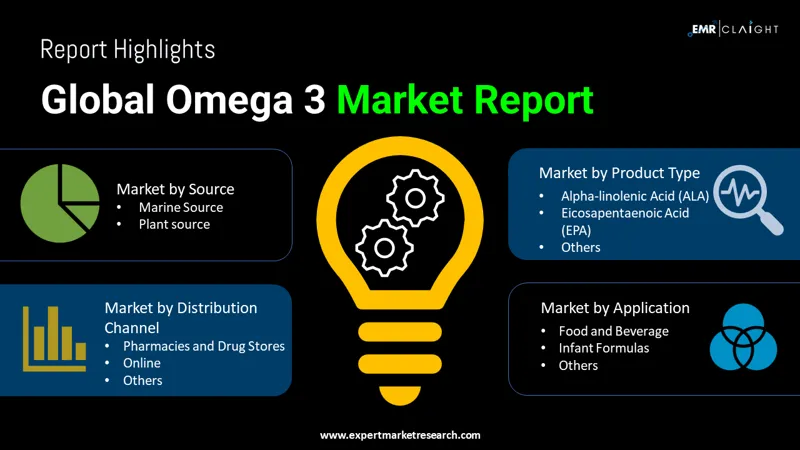
Market Breakup by Product Type
The product type segment includes DHA, ALA, EPA, and other omega-3 variants, reflecting diverse nutritional compositions that support broad commercial applications, product differentiation strategies, and evolving consumer health requirements.
Market Breakup by Source
The source segment includes marine and plant sources, representing key raw material categories that influence ingredient availability, sustainability considerations, production processes, consumer preferences, and product positioning across global markets.
Market Breakup by Application
The application segment includes dietary supplements, pharmaceuticals, animal feed and pet food, food and beverage, infant formulas, and others, highlighting the extensive utilization of omega-3 ingredients across nutrition, healthcare, and consumer product industries.
Market Breakup by Distribution Channel
The distribution channel segment includes hypermarkets and supermarkets, pharmacies and drug stores, online channels, and others, reflecting major sales platforms that shape product accessibility, purchasing patterns, and brand reach.
Market Breakup by Region
The regional segment includes North America, Europe, Asia Pacific, Latin America, and the Middle East and Africa, encompassing diverse regulatory environments, consumption trends, healthcare priorities, and industry development patterns.
Read more about this report - REQUEST FREE SAMPLE COPY IN PDF
|
Analysis Type |
Factors |
Example |
|
Market Drivers |
Rising demand for high-potency EPA and DHA supplements, smaller capsule formats, heart and brain health positioning, and growing use in functional nutrition. |
In May 2026, GC Rieber VivoMega debuted VivoMega 90% TG Premium fish oil at Vitafoods Europe, offering concentrated EPA and DHA for efficient supplement formulation. |
|
Market Restraints |
Marine feedstock dependence, anchovy quota reductions, fish oil supply pressure, sustainability concerns, higher input costs, and need for supplier diversification. |
In April 2026, Peru set the first anchovy season quota at 1.91 million tonnes, 36.2% below the 2025 level, citing sustainability concerns. |
|
Market Opportunities |
Algae-based omega-3 innovation, fish-free DHA supply, sustainable ingredient development, personalized nutrition, and wider use in infant formula, supplements, functional foods, and animal nutrition. |
In April 2026, Fermentalg launched OMEGA ΩRIGINS, a microalgae-derived EPA/DHA oil range using patented fermentation and multiple ratios for supplements and functional foods. |
This section analyzes key factors influencing market growth, including increasing health consciousness, expanding nutraceutical adoption, rising demand for functional foods, evolving consumer preferences, regulatory developments, sustainable sourcing initiatives, and technological advancements in formulations.
High-Potency Fish Oil Launch Supports Global Premium Supplement Market Growth
Rising demand for smaller capsules, high-strength formulations, and better user experience is supporting market growth across global omega-3 supplements. For instance, in May 2026, GC Rieber VivoMega debuted VivoMega 90% TG Premium fish oil at Vitafoods Europe, delivering concentrated EPA and DHA for efficient supplement design. The launch should help brands improve dosage convenience during the forecast period, strengthen premium positioning, and support broader adoption among consumers seeking heart, brain, eye, and active lifestyle nutrition across mature and emerging channels.
Peru Anchovy Quota Reduction Pressures Fish Oil Supply Market Restraints
Growing supplement demand, wider use in functional foods, and dependence on marine raw materials support omega-3 consumption, but fish oil availability remains a market restraint. For instance, in April 2026, Peru set the first anchovy season quota at 1.91 million tonnes, 36.2% below the 2025 level, citing sustainability concerns. This reduction may tighten global feedstock supply during the forecast period, raise input costs, and push manufacturers toward algae-based sourcing, inventory planning, and stronger supplier diversification strategies.
Fermentalg Algal Oil Launch Advances Sustainable EPA DHA Market Development
Growing interest in algal sourcing, personalized nutrition, and sustainable ingredients is advancing market development for EPA and DHA applications. For instance, in April 2026, Fermentalg launched OMEGA ΩRIGINS, a microalgae-derived EPA/DHA oil range using patented fermentation and multiple ratios for supplements and functional food. This innovation should support cleaner formulation strategies during the forecast period, widen non-fish sourcing choices, and enable manufacturers to target longevity, sports nutrition, cognitive health, and visual wellness with differentiated product formats across worldwide channels.
Mara Funding Expands Scalable Algae Based DHA Supply Market Opportunities
Pressure on marine resources, demand for fish-free nutrition, and need for scalable DHA supply are creating market opportunities globally. For instance, in July 2025, Mara Renewables secured US$9.1 million from S2G Investments to expand R&D, manufacturing capability, and commercial reach for algae-based omega-3 production. The funding should improve supply resilience during the forecast period, support broader use in infant formula, supplements, functional foods, animal nutrition, and aquaculture, and reduce dependence on wild fish inputs over time worldwide.
Marine Segment Likely to Dominate the Market Segment by Source
The marine segment captured about 83% market share in the historical period. Strong availability of omega-3-rich raw materials, established extraction technologies, and widespread utilization across nutritional applications continue supporting demand. Manufacturers increasingly focus on quality enhancement, traceability, and sustainable sourcing practices to strengthen product appeal and meet evolving consumer expectations. The segment is likely to dominate the market due to its extensive commercial adoption, mature supply chain infrastructure, and broad acceptance among consumers seeking high-quality omega-3 ingredients.


Read more about this report - REQUEST FREE SAMPLE COPY IN PDF
North America accounted for more than 36% market share in the historical period. High consumer awareness regarding preventive healthcare, strong dietary supplement penetration, and advanced product innovation continue supporting regional market development. The presence of established manufacturers, extensive retail distribution networks, and favorable spending on wellness products further contributes to industry expansion. North America is likely to dominate the market, supported by robust demand for nutritional products, ongoing research activities, and a well-developed regulatory and commercial ecosystem.
Founded in 1865 and headquartered in Wayzata, Minnesota, United States, Cargill is a global food and agricultural company. Its omega-3 portfolio includes fish oil ingredients, nutritional solutions, and functional food ingredients serving dietary supplements and food manufacturers.
Established in 1999 and headquartered in Slough, England, United Kingdom, Reckitt is a consumer health and hygiene company. Its omega-3 portfolio includes nutritional supplements marketed through health and wellness brands supporting heart and cognitive health.
Founded in 2006 and headquartered in Lysaker, Norway, Aker Biomarine specializes in marine biotechnology. Its portfolio includes krill-based omega-3 ingredients, dietary supplements, and specialty nutritional products focused on cardiovascular, brain, and joint health.
Established in 1865 and headquartered in Ludwigshafen, Germany, BASF is a global chemical and nutrition company. Its omega-3 portfolio includes algal and marine-derived ingredients used in dietary supplements, infant nutrition, pharmaceuticals, and functional foods.
Other key players in the market include Omega Protein Corporation, Unilever Plc, Koninklijke DSM N.V., and others.
*Please note that this is only a partial list; the complete list of key players is available in the full report. Additionally, the list of key players can be customized to better suit your needs.*
This report is developed through a robust mixed-methods research design combining:
Upto 15% Off
USD
$5499 $4949
$3299 $2969
$6999 $5949
$8199 $6969


*While we strive to always give you current and accurate information, the numbers depicted on the website are indicative and may differ from the actual numbers in the main report. At Expert Market Research, we aim to bring you the latest insights and trends in the market. Using our analyses and forecasts, stakeholders can understand the market dynamics, navigate challenges, and capitalize on opportunities to make data-driven strategic decisions.*
Explore our key highlights of the report and gain a concise overview of key findings, trends, and actionable insights that will empower your strategic decisions.
| REPORT FEATURES | DETAILS |
| Base Year | 2025 |
| Historical Period | 2019-2025 |
| Forecast Period | 2026-2035 |
| Scope of the Report |
Historical and Forecast Trends, Industry Drivers and Constraints, Historical and Forecast Market Analysis by Segment:
|
| Breakup by Product Type |
|
| Breakup by Source |
|
| Breakup by Application |
|
| Breakup by Distribution Channel |
|
| Breakup by Region |
|
| Market Dynamics |
|
| Supplier Landscape |
|
| Companies Covered |
|
Single User License
One User
USD 5,499
USD 4,949
tax inclusive*
Datasheet
One User
USD 3,299
USD 2,969
tax inclusive*
Five User License
Five User
USD 6,999
USD 5,949
tax inclusive*
Corporate License
Unlimited Users
USD 8,199
USD 6,969
tax inclusive*
*Please note that the prices mentioned below are starting prices for each bundle type. Kindly contact our team for further details.*
Flash Bundle
Small Business Bundle
Growth Bundle
Enterprise Bundle
*Please note that the prices mentioned below are starting prices for each bundle type. Kindly contact our team for further details.*
Flash Bundle
Number of Reports: 3
20%
tax inclusive*
Small Business Bundle
Number of Reports: 5
25%
tax inclusive*
Growth Bundle
Number of Reports: 8
30%
tax inclusive*
Enterprise Bundle
Number of Reports: 10
35%
tax inclusive*
How To Order

Select License Type
Choose the right license for your needs and access rights.

Click on ‘Buy Now’
Add the report to your cart with one click and proceed to register.

Select Mode of Payment
Choose a payment option for a secure checkout. You will be redirected accordingly.
Strategic Solutions for Informed Decision-Making
Gain insights to stay ahead and seize opportunities.

Get insights & trends for a competitive edge.

Track prices with detailed trend reports.

Analyse trade data for supply chain insights.

Leverage cost reports for smart savings

Enhance supply chain with partnerships.

Connect For More Information
Our expert team of analysts will offer full support and resolve any queries regarding the report, before and after the purchase.
Our expert team of analysts will offer full support and resolve any queries regarding the report, before and after the purchase.
We employ meticulous research methods, blending advanced analytics and expert insights to deliver accurate, actionable industry intelligence, staying ahead of competitors.
Our skilled analysts offer unparalleled competitive advantage with detailed insights on current and emerging markets, ensuring your strategic edge.
We offer an in-depth yet simplified presentation of industry insights and analysis to meet your specific requirements effectively.


