

Consumer Insights
Uncover trends and behaviors shaping consumer choices today
Procurement Insights
Optimize your sourcing strategy with key market data
Industry Stats
Stay ahead with the latest trends and market analysis.
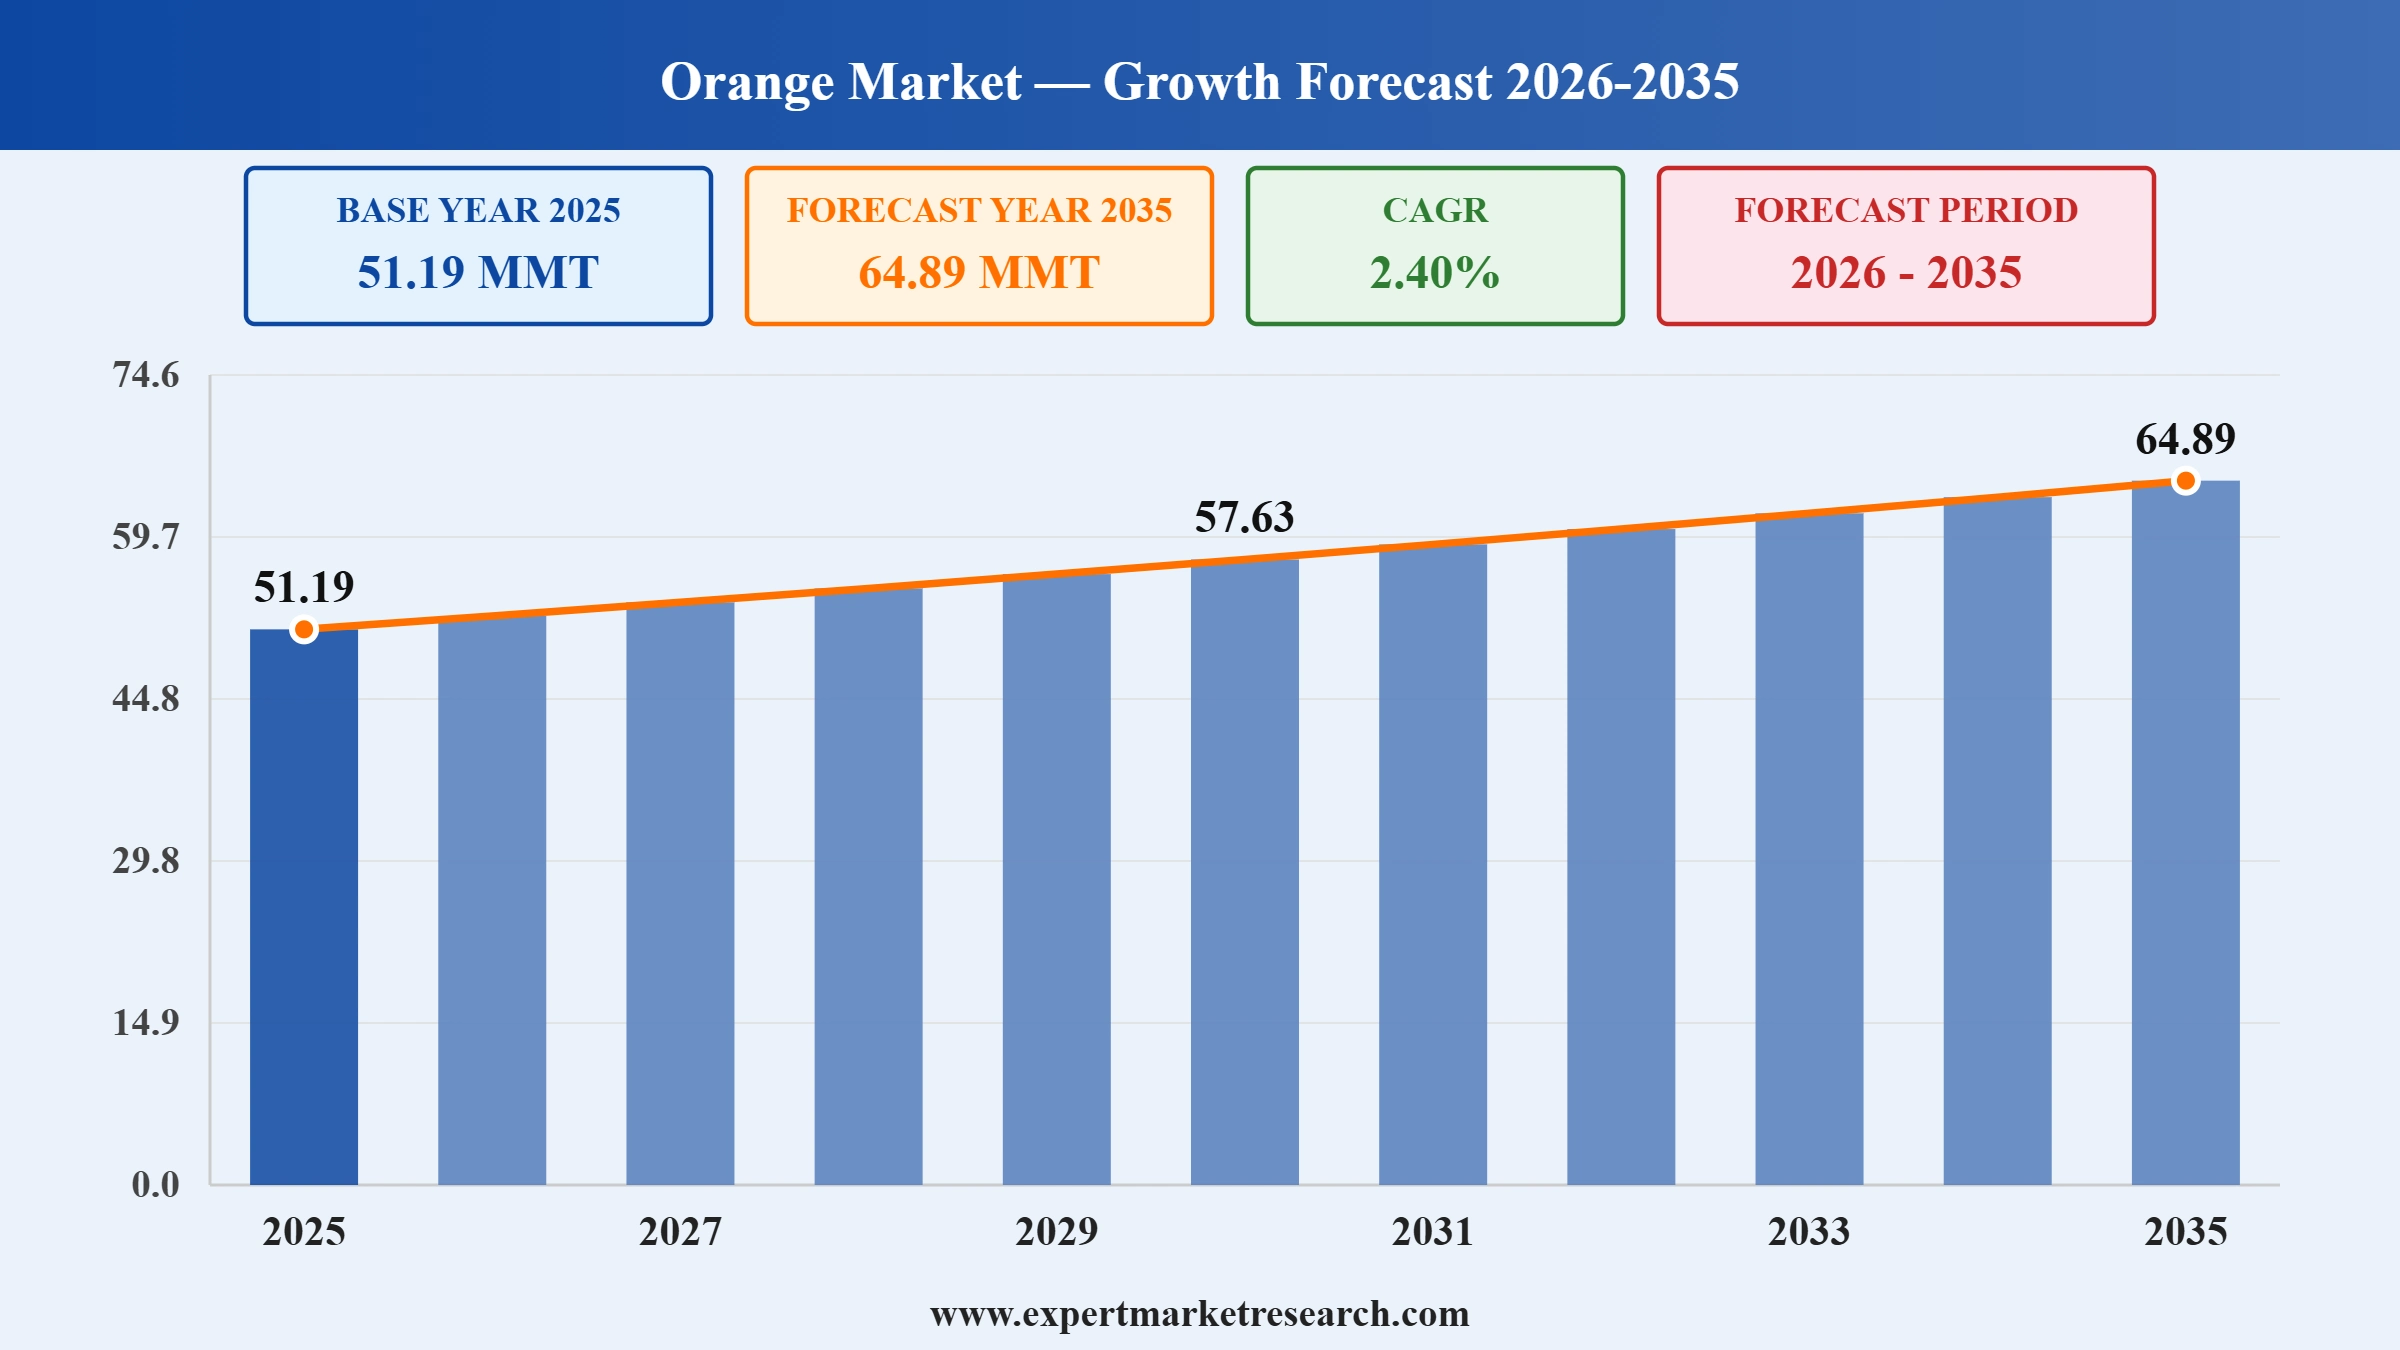
The global orange market was volumed at 51.19 MMT in 2025. The industry is expected to grow at a CAGR of 2.40% during the forecast period of 2026-2035 to attain a volume of 64.89 MMT by 2035.
Brazil's 2025-26 orange harvest concluded at 292 million boxes, broadly in line with expectations after a difficult start to the season hampered by drought and citrus greening disease. FreshFruitPortal reported that processor stocks remained tight despite the recovery in volumes, with orange juice export revenues from key Brazilian producers down 27.1% year-on-year as global retail demand softened amid record consumer prices.
The USDA Foreign Agricultural Service projected global orange juice production to rise sharply in 2025-26, helped by recovery in Brazilian and Mexican output and stable Egyptian volumes. Citrus Industry magazine highlighted Egypt's plans to commission six new orange juice concentrate factories, signalling rising competition for traditional South American suppliers and a structural shift in the global processed citrus trade through the second half of 2026.
Read more about this report - REQUEST FREE SAMPLE COPY IN PDF
| Global Orange Market Report Summary | Description | Value |
| Base Year | MMT | 2025 |
| Historical Period | MMT | 2019-2025 |
| Forecast Period | MMT | 2026-2035 |
| Market Size 2025 | MMT | 51.19 |
| Market Size 2035 | MMT | 64.89 |
| CAGR 2019-2025 | Percentage | XX% |
| CAGR 2026-2035 | Percentage | 2.40% |
| CAGR 2026-2035 - Market by Region | Asia Pacific | 2.8% |
| CAGR 2026-2035 - Market by Country | India | 4.5% |
| CAGR 2026-2035 - Market by Country | UK | 3.3% |
| CAGR 2026-2035 - Market by Form | Juice | 2.6% |
| CAGR 2026-2035 - Market by Distribution Channel | Online Channels | 8.1% |
| Market Share by Country 2025 | Brazil | 2.3% |
Consumers are showing a growing preference for organic oranges and orange juice due to health benefits. An example of this trend is the rising popularity of organic orange juice brands like Tropicana Organic and Simply Orange Organic. These products cater to consumers who are willing to pay a premium for oranges and orange juice that are grown using environmentally friendly methods and without synthetic pesticides.
Additionally, rising temperature in APAC countries, such as India and changing lifestyle patterns are leading consumers to seek out fresh, vitamin C and compound nutrient-rich citrus fruits, further boosting the orange market growth.
The orange market is benefiting from technological innovations that improve efficiency and traceability throughout the supply chain. One example is the use of precision farming techniques, such as GPS-guided tractors and drones, to optimise the application of water, fertilisers, and pesticides in orange groves. These technologies help growers improve yields, reduce waste, and minimise the environmental impact of orange production. Additionally, the integration of digital platforms like online marketplaces and mobile apps has streamlined the distribution of fresh oranges, making them more accessible to consumers, thereby positively influencing the overall market growth.
As per orange market analysis, orange juice segment is evolving beyond traditional orange juice to include a wider range of flavours and product formats. A prime example of this trend is the introduction of cold-pressed orange juice and orange juice blends. Cold-pressed juices are perceived as more nutritious and minimally processed, appealing to health-conscious consumers. Meanwhile, orange juice blends, such as those combined with other fruit juices or superfoods, cater to the growing demand for unique and functional beverage options.
Read more about this report - REQUEST FREE SAMPLE COPY IN PDF
Global Orange Market Report and Forecast 2026-2035 offers a detailed analysis of the market based on the following segments:
Market Breakup by Variety
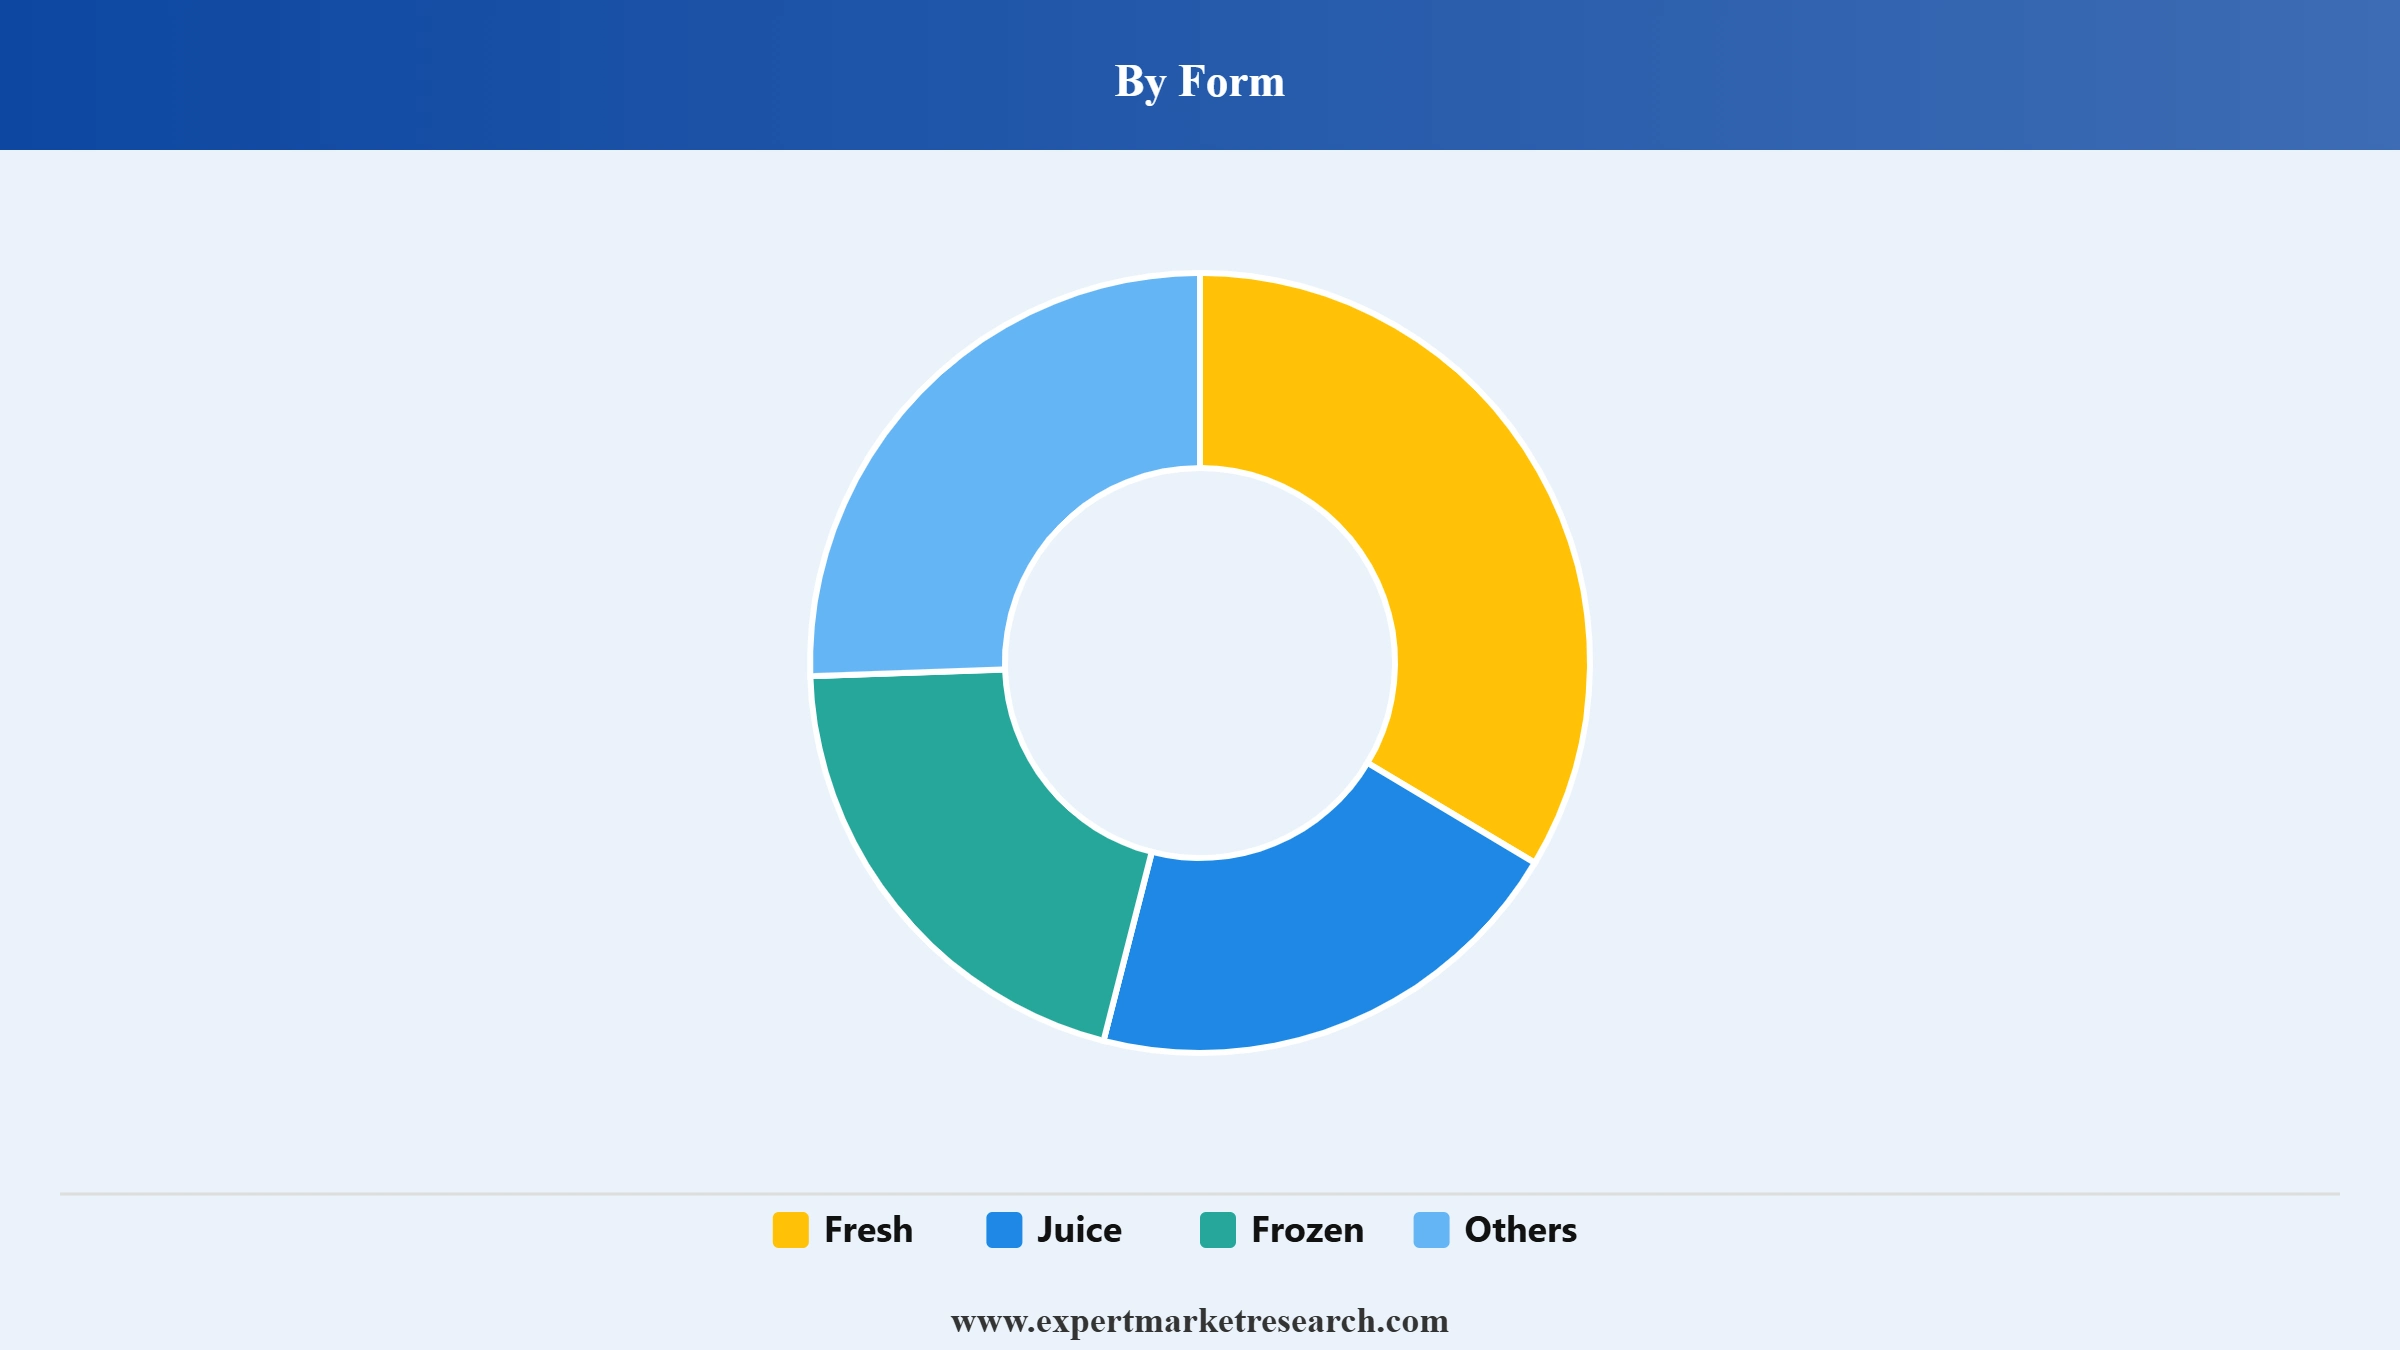
Market Breakup by Form
Market Breakup by Distribution Channel
Market Breakup by Region


Read more about this report - REQUEST FREE SAMPLE COPY IN PDF
Market players are focused on adopting more sustainable orange farming practises to improve their supply chains and stay ahead in the competition.
Upto 15% Off
USD
$2499 $2249
$3999 $3599
$4999 $4249
$5999 $5099


*While we strive to always give you current and accurate information, the numbers depicted on the website are indicative and may differ from the actual numbers in the main report. At Expert Market Research, we aim to bring you the latest insights and trends in the market. Using our analyses and forecasts, stakeholders can understand the market dynamics, navigate challenges, and capitalize on opportunities to make data-driven strategic decisions.*
The market is projected to grow at a CAGR of 2.40% between 2026 and 2035.
The market is being driven due to the increasing demand for fresh and processed orange products, rising demand for fruit juices, and rising awareness of the nutritional value and health benefits of oranges, which are rich in vitamin C and other beneficial compounds.
Key trends aiding the market expansion include improvements in orange cultivation techniques, availability of variety of oranges, and easy accessibility of oranges in various distribution channels.
Regions considered in the market are North America, Europe, Asia Pacific, Latin America, and the Middle East and Africa.
Based on variety, the market segmentations include navel oranges, blood oranges, and Valencia oranges, among others.
Fresh, juice, frozen, and other forms are considered in the report.
Key players in the market are Sunkist Growers Inc., Dole Food Company, Inc., Del Monte Foods, Inc., Sucocitrico Cutrale LTDA, Wonderful Citrus LLC, Florida's Natural Growers, Inc., The Coca-Cola Company, Tropicana Brands Group, Inc., Huiyuan Group Co. Ltd., and Welch Foods, Inc., among others.
In 2025, the oranges market reached an approximate volume of 51.19 MMT.
The market is estimated to witness healthy growth in the forecast period of 2026-2035 to reach a volume of around 64.89 MMT by 2035.
Explore our key highlights of the report and gain a concise overview of key findings, trends, and actionable insights that will empower your strategic decisions.
| REPORT FEATURES | DETAILS |
| Base Year | 2025 |
| Historical Period | 2019-2025 |
| Forecast Period | 2026-2035 |
| Scope of the Report |
Historical and Forecast Trends, Industry Drivers and Constraints, Historical and Forecast Market Analysis by Segment:
|
| Breakup by Variety |
|
| Breakup by Form |
|
| Breakup by Distribution Channel |
|
| Breakup by Region |
|
| Market Dynamics |
|
| Competitive Landscape |
|
| Companies Covered |
|
Datasheet
One User
USD 2,499
USD 2,249
tax inclusive*
Single User License
One User
USD 3,999
USD 3,599
tax inclusive*
Five User License
Five User
USD 4,999
USD 4,249
tax inclusive*
Corporate License
Unlimited Users
USD 5,999
USD 5,099
tax inclusive*
*Please note that the prices mentioned below are starting prices for each bundle type. Kindly contact our team for further details.*
Flash Bundle
Small Business Bundle
Growth Bundle
Enterprise Bundle
*Please note that the prices mentioned below are starting prices for each bundle type. Kindly contact our team for further details.*
Flash Bundle
Number of Reports: 3
20%
tax inclusive*
Small Business Bundle
Number of Reports: 5
25%
tax inclusive*
Growth Bundle
Number of Reports: 8
30%
tax inclusive*
Enterprise Bundle
Number of Reports: 10
35%
tax inclusive*
How To Order

Select License Type
Choose the right license for your needs and access rights.

Click on ‘Buy Now’
Add the report to your cart with one click and proceed to register.

Select Mode of Payment
Choose a payment option for a secure checkout. You will be redirected accordingly.
Strategic Solutions for Informed Decision-Making
Gain insights to stay ahead and seize opportunities.

Get insights & trends for a competitive edge.

Track prices with detailed trend reports.

Analyse trade data for supply chain insights.

Leverage cost reports for smart savings

Enhance supply chain with partnerships.

Connect For More Information
Our expert team of analysts will offer full support and resolve any queries regarding the report, before and after the purchase.
Our expert team of analysts will offer full support and resolve any queries regarding the report, before and after the purchase.
We employ meticulous research methods, blending advanced analytics and expert insights to deliver accurate, actionable industry intelligence, staying ahead of competitors.
Our skilled analysts offer unparalleled competitive advantage with detailed insights on current and emerging markets, ensuring your strategic edge.
We offer an in-depth yet simplified presentation of industry insights and analysis to meet your specific requirements effectively.


