

Consumer Insights
Uncover trends and behaviors shaping consumer choices today
Procurement Insights
Optimize your sourcing strategy with key market data
Industry Stats
Stay ahead with the latest trends and market analysis.
The global potassium nitrate market attained a value of USD 1.79 Billion in 2025 and is projected to reach USD 2.48 Billion by 2035. The market is estimated to grow at a progressive CAGR of 3.30% during the forecast period of 2026-2035.
Compound Annual Growth Rate
3.3%
Value in USD Billion
2026-2035
| Global Potassium Nitrate Market Report Summary | Description | Value |
| Base Year | USD Billion | 2025 |
| Historical Period | USD Billion | 2019-2025 |
| Forecast Period | USD Billion | 2026-2035 |
| Market Size 2025 | USD Billion | 1.79 |
| Market Size 2035 | USD Billion | 2.48 |
| CAGR 2019-2025 | Percentage | XX% |
| CAGR 2026-2035 | Percentage | 3.30% |
| CAGR 2026-2035 - Market by Region | North America | 3.1% |
| CAGR 2026-2035 - Market by Country | India | 4.1% |
| CAGR 2026-2035 - Market by Country | China | 3.6% |
| CAGR 2026-2035 - Market by Raw Material | Potassium Chloride | 3.8% |
| CAGR 2026-2035 - Market by End Use | Pharmaceuticals | 3.7% |
| Market Share by Country 2025 | UK | 4.2% |
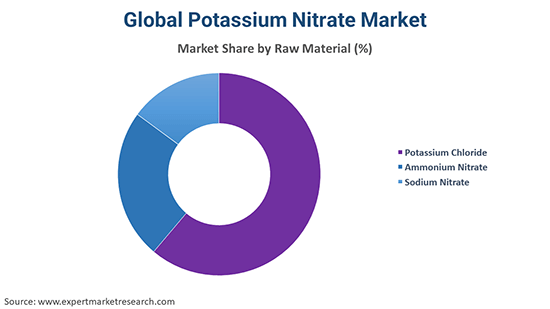
On the basis of raw materials, the potassium chloride segment was estimated to account for the largest market share in 2020. The segment is likely to retain its dominance over the forecast period. Based on end-uses, the agriculture industry represented the dominant segment in 2020. Potassium nitrate is widely used as a fertiliser along with other applications like its use in the production of gun powder, fireworks, medicines, etc. Nitrogen is a nutrient essential for all living organisms. When used as a fertiliser, potassium nitrate becomes a source of nitrogen and potassium. An increased population demands more crop production, which can be ensured with the use of a good fertiliser. It was estimated the world’s fertiliser consumption increased by approximately 1.8% a year through 2018. Thus, the growing fertiliser industry is acting as a catalyst for the global potassium nitrate market growth.
Regionally, the Asia Pacific represents the leading potassium nitrate market, accounting for the majority of the global share. Asia, the largest consumer of fertilisers in the world, relies on imports of all three primary nutrients. For instance, in India, the raw materials and intermediates are largely imported to produce nitrogenous and phosphatic fertilisers to meet domestic requirements. Due to the non-availability of any potash (K) reserve in the country, its entire requirement is fulfilled through imports. Globally, the largest exporter of fertilisers is Russia, accounting for about a fifth of the total fertiliser trade, along with other significant contributors like Canada, China, Belarus, and the United States. On the other hand, the world’s largest importer of fertilisers is the United States, followed by countries like Brazil, India, and China. These regions are majorly contributing to the growth of the potassium nitrate market.


Potassium nitrate (KNO3) is a crystalline salt that exhibits a colour of white to grey. It is also known as saltpetre or nitre. The salt is naturally found in the pure form and can also be prepared commercially by mixing sodium nitrate and potassium chloride. Potassium nitrate is a strong oxidizing agent that assists in accelerating the burning of combustible substances. Due to this, it is widely used as a constituent in fireworks, rocket propellants, gunpowder, and medicines. Apart from this, potassium nitrate finds immense applications.
The potassium nitrate market can be majorly segmented on the basis of its raw material segments into:
The potassium nitrate market can be broadly categorised on the basis of its end-use segments into:
Market Breakup by Region
Read more about this report - REQUEST FREE SAMPLE COPY IN PDF
| CAGR 2026-2035 - Market by | Country |
| India | 4.1% |
| China | 3.6% |
| Brazil | 3.4% |
| USA | 3.1% |
| UK | 3.0% |
| Canada | XX% |
| Germany | XX% |
| France | 2.6% |
| Italy | XX% |
| Japan | XX% |
| Australia | XX% |
| Saudi Arabia | XX% |
| Mexico | XX% |
Potassium nitrate is extensively used in the food industry to preserve food items such as beef, ham, salami, and among others, and in the agriculture sector to produce the fertilizers. Moreover, governments of developing countries are offering subsidies for the sales of fertilisers, resulting in the increased consumption of potassium nitrate. In addition to this, it is resistant to fungal diseases, improves drought tolerance, and maintains a balance between proteins and carbohydrates, and increase food formation in plants and root growth. Growing demand for speciality fertilisers has witnessed a surge in the agriculture segment, which in turn is stimulating the market growth. Furthermore, increasing concerns regarding the depletion of exhaustible resources have also led many organizations to resort to sustainable resources like CSPs, hence, is propelling the potassium nitrate market growth.
Drilling and blasting are essential practices in the mining process and are commonly used to break up benches of rock containing ore. For instance, in the coal mining industry, high-quality explosives such as potassium nitrate are used to extract coal from ground mines. With the surging need for blasting and drilling chemicals in the coal mining industry, the demand for potassium nitrate is expected to increase over the years to come.
The report gives a detailed analysis of the following key players in the global market for potassium nitrate, covering their competitive landscape, capacity, and latest developments like mergers, acquisitions, and investments, expansions of capacity, and plant turnarounds:
The comprehensive EMR report provides an in-depth assessment of the market based on the Porter's five forces model along with giving a SWOT analysis.
Upto 15% Off
USD
$2499 $2249
$3999 $3599
$4999 $4249
$5999 $5099


*While we strive to always give you current and accurate information, the numbers depicted on the website are indicative and may differ from the actual numbers in the main report. At Expert Market Research, we aim to bring you the latest insights and trends in the market. Using our analyses and forecasts, stakeholders can understand the market dynamics, navigate challenges, and capitalize on opportunities to make data-driven strategic decisions.*
The global potassium nitrate market reached a value of USD 1.79 Billion in 2025.
The market is projected to grow at a CAGR of nearly 3.30% in the forecast period of 2026-2035.
The market is estimated to reach a value of about USD 2.48 Billion by 2035.
The major drivers of the market include rising disposable incomes, increasing population, rising food industry, growing demand for speciality fertilisers, and the increasing demand for blasting and drilling chemicals in the coal mining market.
The rising concerns regarding the depletion of exhaustible resources have led many organisations to resort to sustainable resources like CSPs. This is expected to be a key trend guiding the growth of the market.
North America, Europe, the Asia Pacific, Latin America, and the Middle East and Africa are the leading regions in the market.
The significant raw materials of potassium nitrate are potassium chloride, ammonium nitrate, and sodium nitrate.
Agricultural industry, general industries, pharmaceuticals, and food industry, among others, are the major end use industries of potassium nitrate.
The leading players in the market are Haifa Chemicals Ltd, Migao Corporation, SQM S.A., Uralchem JSC, and Yara North America, Inc., among others.
Explore our key highlights of the report and gain a concise overview of key findings, trends, and actionable insights that will empower your strategic decisions.
| REPORT FEATURES | DETAILS |
| Base Year | 2025 |
| Historical Period | 2019-2025 |
| Forecast Period | 2026-2035 |
| Scope of the Report |
Historical and Forecast Trends, Industry Drivers and Constraints, Historical and Forecast Market Analysis by Segment:
|
| Breakup by Raw Material |
|
| Breakup by End Use Industry |
|
| Breakup by Region |
|
| Market Dynamics |
|
| Competitive Landscape |
|
| Companies Covered |
|
| Report Price and Purchase Option | Explore our purchase options that are best suited to your resources and industry needs. |
| Delivery Format | Delivered as an attached PDF and Excel through email, with an option of receiving an editable PPT, according to the purchase option. |
Datasheet
One User
USD 2,499
USD 2,249
tax inclusive*
Single User License
One User
USD 3,999
USD 3,599
tax inclusive*
Five User License
Five User
USD 4,999
USD 4,249
tax inclusive*
Corporate License
Unlimited Users
USD 5,999
USD 5,099
tax inclusive*
*Please note that the prices mentioned below are starting prices for each bundle type. Kindly contact our team for further details.*
Flash Bundle
Small Business Bundle
Growth Bundle
Enterprise Bundle
*Please note that the prices mentioned below are starting prices for each bundle type. Kindly contact our team for further details.*
Flash Bundle
Number of Reports: 3
20%
tax inclusive*
Small Business Bundle
Number of Reports: 5
25%
tax inclusive*
Growth Bundle
Number of Reports: 8
30%
tax inclusive*
Enterprise Bundle
Number of Reports: 10
35%
tax inclusive*
How To Order

Select License Type
Choose the right license for your needs and access rights.

Click on ‘Buy Now’
Add the report to your cart with one click and proceed to register.

Select Mode of Payment
Choose a payment option for a secure checkout. You will be redirected accordingly.
Strategic Solutions for Informed Decision-Making
Gain insights to stay ahead and seize opportunities.

Get insights & trends for a competitive edge.

Track prices with detailed trend reports.

Analyse trade data for supply chain insights.

Leverage cost reports for smart savings

Enhance supply chain with partnerships.

Connect For More Information
Our expert team of analysts will offer full support and resolve any queries regarding the report, before and after the purchase.
Our expert team of analysts will offer full support and resolve any queries regarding the report, before and after the purchase.
We employ meticulous research methods, blending advanced analytics and expert insights to deliver accurate, actionable industry intelligence, staying ahead of competitors.
Our skilled analysts offer unparalleled competitive advantage with detailed insights on current and emerging markets, ensuring your strategic edge.
We offer an in-depth yet simplified presentation of industry insights and analysis to meet your specific requirements effectively.


