

Consumer Insights
Uncover trends and behaviors shaping consumer choices today
Procurement Insights
Optimize your sourcing strategy with key market data
Industry Stats
Stay ahead with the latest trends and market analysis.
The power cables market attained a value of USD 157.31 Billion as of 2025 and is anticipated to grow at a CAGR of 6.40% during the forecast period of 2026 to 2035. Growing use of renewable energy sources is propelling the demand for high-performance power cables, such as HVDC and submarine cables, to facilitate efficient transmission of energy, grid stability, and less power loss in green infrastructure projects. The market is thus expected to reach a value of nearly USD 292.53 Billion by 2035.
Compound Annual Growth Rate
6.4%
Value in USD Billion
2026-2035
The market for power cables is growing rapidly, spurred by the rising demand for electricity, urbanization, and the growth of renewable energy initiatives. The increasing requirement for efficient power transmission and distribution infrastructure is triggering investments in high-performance cables for residential, commercial, and industrial purposes. Governments around the globe are upgrading old power grids and implementing smart grid technology, increasing the demand in the power cables market.
Growth in renewable energy, especially in solar and wind power, is providing opportunities for dedicated cables such as submarine cables and underground cables to link off-shore wind farms and megawatt-sized solar farms with the grid. Use of high-voltage direct current (HVDC) cables is also gathering momentum because it reduces power loss over long-distance transmission.
Read more about this report - REQUEST FREE SAMPLE COPY IN PDF
Also, the pressure for sustainable solutions is promoting the creation of environmentally friendly, recyclable cables with lower carbon footprints. Industry players are concentrating on innovative materials like high-purity copper and aluminum to improve conductivity, durability, and efficiency. Increased investments in electrification initiatives in emerging economies also add to power cables demand growth.
With rising technological innovation, regulatory assistance, and rising energy demands, the power cables market is poised to experience consistent growth, offering profitable opportunities for manufacturers, suppliers, and energy and utility industry stakeholders.
Power cable trends include fire-resistant cables, superconducting technology, lightweight flexible designs, and eco-friendly materials for enhanced safety, efficiency, and sustainability, thus shaping the power cables market dynamics and trends.
UGREEN has launched a Genshin Impact-themed charging collection, including a 20,000mAh power bank, 65W GaN fast charger, Qi2 wireless charger, and a 100W USB-C cable. Featuring artwork of Kinich from Natlan, these limited-edition accessories are available in 14 countries.
Hellenic Cables signed a significant contract for advanced cable systems, demonstrating its ability to design and deliver cutting-edge energy solutions. Hellenic Cables was given a contract by Independent Power Transmission Operator to design, supply, and construct 38 kilometers of underground and subterranean cables with a voltage of 150kV XLPE. The project is scheduled to be completed in 2026. This partnership shows how committed the company is to enhance global energy infrastructure.
Yokogawa Electric Corporation has introduced OpreX Subsea Power Cable Monitoring, a system that uses fiber optic sensors to continuously monitor temperature changes in subsea power cables at offshore wind farms. This enables condition-based maintenance, reducing inspection costs and enhancing operational efficiency by promptly detecting and addressing potential cable damage.
Dynamic Cables Limited announced the launch of its new Solar Power Cable, catering to the domestic market. This product falls under the cables category and aims to enhance solar energy infrastructure with reliable and efficient power transmission.
As safety regulations continue to rise, utilities and industries are implementing fire-resistant power cables to avoid electrical accidents. The cables provide constant power supply in mission-critical infrastructures such as hospitals, tunnels, and skyscrapers by maintaining their function under intense heat and avoiding failures due to fires, thus pushing the growth of the power cables market.
Superconducting power cables are being considered for their potential to transmit higher currents with little energy loss. The cables improve grid efficiency and are being piloted in urban power grids to address increasing energy needs while minimizing transmission losses and overheating problems in traditional copper and aluminum cables.
Industries are moving towards high-performance, lightweight cables using advanced materials to enhance installation ease and durability. Flexible power cables are especially useful in robotics, automation, and aerospace industries where rigid cables are not ideal for dynamic movements and space limitations, thereby helping to create new trends in the power cables market.
Sustainability is prompting the creation of environment-friendly power cables with recyclable components and lead-free insulating materials. Manufacturers are turning to minimizing carbon footprints by implementing biodegradable cable sheathing and maximizing energy efficiency in alignment with world environmental policies and the growing inclination for green energy options in power distribution systems.
The global power cables market is witnessing fast growth with the growth of renewable energy infrastructure. As there are growing investments in wind and solar power schemes, the need for high-performance power cables is growing to facilitate the efficient transmission of electricity from production points to the grid with limited energy loss. Moreover, the use of high-voltage direct current (HVDC) cables is increasingly popular, as they facilitate long-distance transmission of power with lower energy losses, thus shaping new trends in the power cables market.
Governments and utilities are investing significantly in HVDC grids to stabilize the grid and incorporate renewable energy sources efficiently. In addition, the growth of smart grids and digitalization is revolutionizing power cable management. IoT-based monitoring systems ensure real-time tracking of data, increasing efficiency, reducing failure, and prolonging cable life, and creating more robust and intelligent power networks.
Read more about this report - REQUEST FREE SAMPLE COPY IN PDF
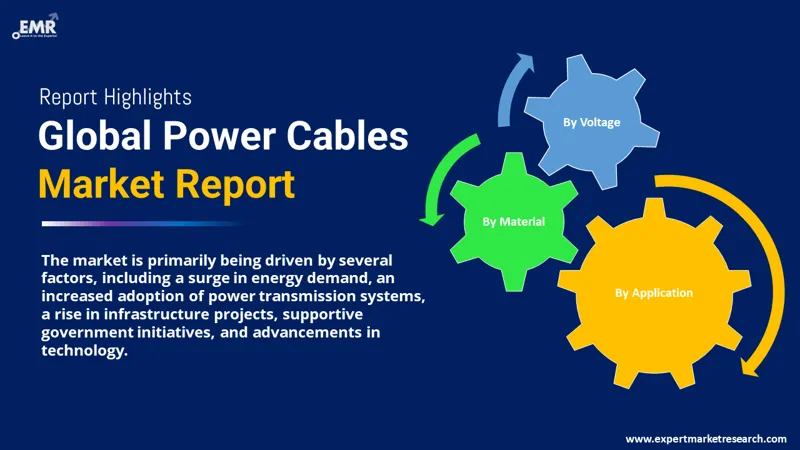
The EMR’s report titled “Power Cables Market Report and Forecast 2026-2035” offers a detailed analysis of the market based on the following segments:
Market Breakup by Material
Market Breakup by Voltage
Market Breakup by Application
Market Breakup by Region


Aluminum cables are gaining popularity because of their light weight, economic price, and high conductivity-to-weight ratio, which makes them suitable for overhead power transmission and distribution systems. As per the global power cables market analysis, the demand for renewable energy and grid expansion schemes increases, aluminum is used extensively in long-distance transmission lines because of its low cost and resistance to corrosion.
As per the power cables industry analysis, copper cables, owing to their higher conductivity, high durability, and flexibility, are still the preferred option for industrial and underground usage. Increasing EVs, smart grids, and high-performance electric system adoption is propelling the demand for copper cables, transmitting power efficiently with negligible energy loss.
Major power cables market players are prioritizing innovation, sustainability, and efficiency to address increasing energy needs. They are investing in low-loss, high-performance cables for enhanced transmission, growing renewable energy integration with niche solutions, and increasing grid reliability with advanced materials and intelligent monitoring technologies. Power cables companies are also prioritizing environmentally friendly production, recyclable materials, and high-voltage DC transmission to enable long-distance power transmission. Strategic alliances and international expansions are fueling market growth and technological innovation.
Prysmian Group, founded in 1872 and based in Milan, Italy, supplies a wide assortment of high-voltage, medium-voltage, and low-voltage power cables. The cables underpin energy transmission and distribution systems, providing reliability for utilities, industrial usage, and renewable energy schemes.
Nexans S.A., established in 2000 and headquartered in Paris, France, supplies power cables to different industries, such as utilities, infrastructure, and offshore wind farms. Their offerings range from high-performance energy cables for efficiency, sustainability, and durability in harsh conditions to serving the worldwide energy transition.
Belden Inc. was founded in 1902 with its headquarters in Missouri, United States, and is a high-quality power and industrial cable specialist. Its solutions provide durability, flexibility, and advanced shielding for critical industries such as automation, transportation, and data centers.
Sumitomo Electric Industries, Ltd., established in 1897 and headquartered in Osaka, Japan, produces an extensive range of power cables for transmission and distribution. Their leading-edge technologies are enabled for high-voltage uses, smart grids, and integration of renewable energies in order to enhance energy efficiency and sustainable electrification globally.
*Please note that this is only a partial list; the complete list of key players is available in the full report. Additionally, the list of key players can be customized to better suit your needs.*
Other key players in the power cables market report include Furukawa Electric Co., Ltd, LS Cable & System Ltd., KEI Industries Ltd., The Okonite Company Inc., International Wire Group, and Hitachi Metals, Ltd., among others.
Upto 15% Off
USD
$2499 $2249
$3999 $3599
$4999 $4249
$5999 $5099


*While we strive to always give you current and accurate information, the numbers depicted on the website are indicative and may differ from the actual numbers in the main report. At Expert Market Research, we aim to bring you the latest insights and trends in the market. Using our analyses and forecasts, stakeholders can understand the market dynamics, navigate challenges, and capitalize on opportunities to make data-driven strategic decisions.*
In 2025, the power cables market reached an approximate value of USD 157.31 Billion.
The market is assessed to grow at a CAGR of 6.40% between 2026 and 2035.
The major drivers of the market include rising demand for energy, increased adaptation of power transmissions, growing infrastructure projects, favourable government initiatives, and improving technology.
The key market trend guiding the growth of the power cables market include the adoption of smart grid technology and increase in urbanisation.
The major regions in the market are North America, Latin America, the Middle East and Africa, Europe, and the Asia Pacific.
The materials used in the market include aluminium and copper.
The major segments based on voltage are low voltage, medium voltage, and high voltage.
The significant applications of the product include power transmission, utilities, telecommunication, and infrastructure, among others.
The key players in the market are Prysmian Group, Nexans Group, Belden Inc., Sumitomo Electric Industries, Nexans S.A., Furukawa Electric Co., Ltd, LS Cables & System Ltd., KEI Industries Ltd., The Okonite Company Inc., International Wire Group, and Hitachi Metals, Ltd, among others.
The market is estimated to witness healthy growth in the forecast period of 2026-2035 to reach a value of around USD 292.53 Billion by 2035.
Explore our key highlights of the report and gain a concise overview of key findings, trends, and actionable insights that will empower your strategic decisions.
| REPORT FEATURES | DETAILS |
| Base Year | 2025 |
| Historical Period | 2019-2025 |
| Forecast Period | 2026-2035 |
| Scope of the Report |
Historical and Forecast Trends, Industry Drivers and Constraints, Historical and Forecast Market Analysis by Segment:
|
| Breakup by Material |
|
| Breakup by Voltage |
|
| Breakup by Application |
|
| Breakup by Region |
|
| Market Dynamics |
|
| Competitive Landscape |
|
| Companies Covered |
|
| Report Price and Purchase Option | Explore our purchase options that are best suited to your resources and industry needs. |
| Delivery Format | Delivered as an attached PDF and Excel through email, with an option of receiving an editable PPT, according to the purchase option. |
Datasheet
One User
USD 2,499
USD 2,249
tax inclusive*
Single User License
One User
USD 3,999
USD 3,599
tax inclusive*
Five User License
Five User
USD 4,999
USD 4,249
tax inclusive*
Corporate License
Unlimited Users
USD 5,999
USD 5,099
tax inclusive*
*Please note that the prices mentioned below are starting prices for each bundle type. Kindly contact our team for further details.*
Flash Bundle
Small Business Bundle
Growth Bundle
Enterprise Bundle
*Please note that the prices mentioned below are starting prices for each bundle type. Kindly contact our team for further details.*
Flash Bundle
Number of Reports: 3
20%
tax inclusive*
Small Business Bundle
Number of Reports: 5
25%
tax inclusive*
Growth Bundle
Number of Reports: 8
30%
tax inclusive*
Enterprise Bundle
Number of Reports: 10
35%
tax inclusive*
How To Order

Select License Type
Choose the right license for your needs and access rights.

Click on ‘Buy Now’
Add the report to your cart with one click and proceed to register.

Select Mode of Payment
Choose a payment option for a secure checkout. You will be redirected accordingly.
Strategic Solutions for Informed Decision-Making
Gain insights to stay ahead and seize opportunities.

Get insights & trends for a competitive edge.

Track prices with detailed trend reports.

Analyse trade data for supply chain insights.

Leverage cost reports for smart savings

Enhance supply chain with partnerships.

Connect For More Information
Our expert team of analysts will offer full support and resolve any queries regarding the report, before and after the purchase.
Our expert team of analysts will offer full support and resolve any queries regarding the report, before and after the purchase.
We employ meticulous research methods, blending advanced analytics and expert insights to deliver accurate, actionable industry intelligence, staying ahead of competitors.
Our skilled analysts offer unparalleled competitive advantage with detailed insights on current and emerging markets, ensuring your strategic edge.
We offer an in-depth yet simplified presentation of industry insights and analysis to meet your specific requirements effectively.


