

Consumer Insights
Uncover trends and behaviors shaping consumer choices today
Procurement Insights
Optimize your sourcing strategy with key market data
Industry Stats
Stay ahead with the latest trends and market analysis.
The recovered paper market attained a volume of 284.01 MMT as of 2025 and is anticipated to grow at a CAGR of 2.50% during the forecast period of 2026 to 2035. One of the key drivers of the recovered paper market is the growing focus on sustainability and circular economy. Governments across the globe are enforcing strict policies to encourage recycling and minimize waste, prompting industries to use recovered paper as a raw material. This change not only saves natural resources but also minimizes carbon emissions, aligning with the world's environmental objectives. The market is thus expected to reach a volume of nearly 363.56 MMT by 2035.
Recovered Paper Market
Overview: The recovered paper market entered Q1 2026 on a familiar trajectory and exited it having absorbed the full force of the Iran-US-Israel conflict. Recovered paper, encompassing all grades of paper collected after consumer or industrial use and reprocessed as secondary fiber, is the world's most widely recycled material and a critical feedstock for paper and packaging production. The conflict's effects on trans-oceanic recovered paper trade flows and processing facility energy costs were felt across all major recovered paper grades.
United States: US recovered paper collection and export during the first quarter of 2026 was influenced by elevated container freight costs from Hormuz disruption, which compressed export margins to Asian mills and directed more supply to domestic paper mill customers. US domestic paper mill demand for recovered fiber, from containerboard producers, tissue mills, and newsprint manufacturers, maintained stable offtake as packaging and tissue demand remained healthy. US recovered paper processing facility energy costs, for baling, sorting, and conveying operations, increased from Q1 2026 natural gas and electricity price elevation. The net effect was favorable for domestic mill relationships and domestic recovered paper pricing, as export economics deteriorated while domestic demand remained strong.
Iran: Iran's market activity remained severely constrained throughout Q1 2026. Comprehensive OFAC sanctions under 31 C.F.R. Part 560 and conflict-related strikes across 26 provinces (ACLED, March 2026) prohibited all commercial engagement with Iranian entities.
Israel: Gulf state recovered paper collection, in Saudi Arabia, UAE, and Kuwait, continued under Vision 2030 and industrial diversification circular economy programs, with Q1 2026 reinforcing the strategic rationale for domestic recovered paper supply chain development. Israeli recovered paper collection and processing, feeding domestic Hadera Paper mill consumption, kept operating through Q1 2026. Global recovered paper trade flows were disrupted by Q1 2026 vessel stranding (700+ ships, Londonlovesbusiness.com) and Hormuz closure effects on container shipping availability, with elevated freight rates reducing the export economics of US and European recovered paper to Asian mills.
Government & Policy Watch
Market & Industry Impact
Procurement & Supply Chain Alert
Compound Annual Growth Rate
2.5%
Value in MMT
2026-2035
Read more about this report - REQUEST FREE SAMPLE COPY IN PDF
The market for recovered paper is being led by two distinct forces: the demand for greener packaging and growing circular economy trends. With more consumers and businesses looking for environmentally friendly options, demand for recyclables, and especially paper, has increased dramatically. Businesses are incorporating recovered paper into their packaging to address green objectives and abide by tighter regulations on waste control, thus driving the growth of recovered paper market.
For instance, businesses such as DS Smith are at the forefront of sustainable packaging through emphasis on closed-loop recycling systems. Apart from enabling carbon footprint reduction, this system ensures a constant supply of recovered paper for manufacturing. Moreover, governmental regulations enforcing greater recycling and landfill waste minimization are also furthering paper recovery and reuse. These drivers are set to continue fueling the growth of the market as industries strive for more sustainable practices.
The recovered paper market dynamics and trends include closed-loop recycling, AI sorting, compostable coatings, and blockchain for transparency.
Exporters of recovered paper highlighted the importance of being agile and responsive to the fast-evolving market conditions. Issues like possible port strikes, volatile foreign exchange rates, geopolitical tensions, and changing consumer behaviors were noted as major challenges. Furthermore, the European Union's imposition of the Carbon Border Adjustment Mechanism (CBAM) was identified as an important area of concern, possibly affecting exports to outside-of-EU nations such as the U.S., India, and Thailand. Industry experts emphasized pre-eminent planning and responsiveness in countering these uncertainties.
Mars Wrigley and Tesco initiated a trial of promotional displays crafted from waste cocoa bean shells and recycled paper. This innovative material, known as Cocoa Cardboard, is designed to replace virgin tree fibers and reduce greenhouse gas emissions by 30% compared to conventional cardboard. Additionally, it boasts a 94% reduction in land use and a 59% decrease in water consumption, as per a life cycle assessment.
Fastmarkets announced the launch of new PIX European prices for recovered paper, effective from April 9, 2024. These include PIX SOP and PIX Multiprint, covering grades like Sorted Office Paper and Multi Printing. Simultaneously, Fastmarkets will discontinue the PPI Europe Paper for Recycling assessments starting May 8, 2024. This transition aims to enhance market transparency and align with industry feedback.
Experts discussed that in North America, the demand for Old Corrugated Containers (OCC) and mixed paper remains strong due to expanding recycled paper and board capacity. From January to June 2024, United States paper mills increased recovered fiber consumption by 6.8%, processing 16.44 million tons compared to 15.4 million tons in the same period of 2023.
Firms are increasingly adopting closed-loop recycling models, wherein paper products are recycled to the same product category. This saves on the use of virgin materials, reduces waste generation, and increases sustainability by providing a continuous loop of reuse, thus pushing the growth of the recovered paper market.
The application of artificial intelligence (AI) in sorting waste has been enhancing efficiency and accuracy. AI systems have the ability to detect and sort various grades of paper, removing contamination and improving the quality of recovered materials, which is important in making high-grade paper products.
To make paper products more recyclable, firms are creating compostable coatings as substitutes for conventional plastic-based coatings. The coatings enable paper products to be composted once used, thus minimizing landfill waste and enabling the circular economy, thereby helping to create new trends in the recovered paper market.
Blockchain technology is used to trace and authenticate the path of recovered paper from one stage of the supply chain to another. It makes the process transparent, eliminates fraud, and ensures sound sourcing practices, which, in turn, builds consumer confidence and motivates the use of recycled material.
Advanced paper-to-paper recycling technologies are improving the effectiveness of recycling used paper into new high-quality paper products. These technologies are being optimized to reduce fiber degradation, allowing continuous recycling of paper products. This development decreases the dependence on virgin pulp and makes paper production more sustainable, thus shaping new trends in the recovered paper market.
Businesses are now placing more emphasis on upcycling mixed paper waste, which was previously more difficult to recycle. Improved technologies enable improved separation and treatment of mixed paper, making what was previously considered low-grade material a valuable resource. This development not only increases recycling levels but also creates new market outlets for recovered paper.
Read more about this report - REQUEST FREE SAMPLE COPY IN PDF
The EMR’s report titled “Recovered Paper Market Report and Forecast 2026-2035” offers a detailed analysis of the market based on the following segments:
Market Breakup by Type
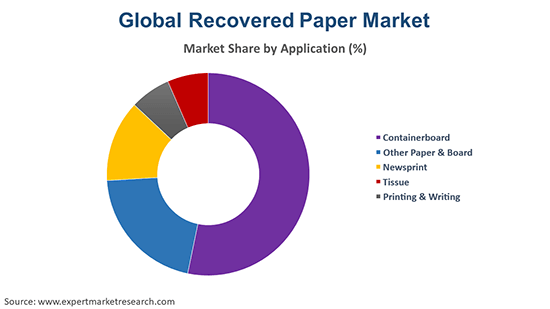
Market Breakup by Application
Market Breakup by Region


The market for fresh as well as recovered paper types is gaining traction in the global market because of the escalating environmental issues and the need for greener alternatives. As per the recovered paper market analysis, fresh paper, which comes from virgin pulp, is still the preferred source for high-end production, particularly in sectors such as printing and packaging.
According to the recovered paper industry analysis, recovered paper, sourced from recycled waste, is gaining substantial momentum since firms and customers are working to minimize wastage and carbon prints. Governments are also implementing tougher recycling policies, supporting further usage of recovered paper. The move towards circular economy processes and increased consumer concern for environmentally friendly products is compelling the growing uptake of recovered paper across diverse sectors, ranging from packaging to tissue production.
Leading recovered paper market players are investing in sustainability, innovation in technology, and a bigger global presence. International Paper and Smurfit Kappa, for example, are committing investments in superior recycling technologies as well as environmental packaging solutions in order to cater to increasing concerns on the environment. DS Smith and Stora Enso, for instance, are improving recycling efficiencies and diversifying into new markets to position themselves stronger. These strategic plans will help to counter growing demand for eco-friendly products and adhere to strict environmental regulations.
Established in 1968 and based in the United States, Waste Management provides strong recycling services, such as large-scale recovered paper collection and processing. Waste Management has several material recovery facilities, promoting environmentally friendly waste diversion and providing high-quality recycled fiber for packaging and manufacturing companies throughout North America.
Founded in 1934 and based in Ireland, Smurfit Kappa employs recovered paper as a key raw material in the manufacture of sustainable corrugated packaging solutions. Smurfit Kappa emphasizes circular production processes and has large-scale recycling operations in Europe and the Americas to minimize environmental footprint and virgin fiber dependence.
Established in 1940 in the United Kingdom, DS Smith is a company that deals with fiber-based packaging solutions made of recycled paper. The company operates a closed-loop recycling system where used paper and boxes are gathered to produce new packaging, thus being resource efficient and helping customers achieve their sustainability objectives in retail, industrial, and e-commerce businesses.
Founded in 1998 with headquarters in the United States, Republic Services operates more than 70 recycling facilities, recycling millions of tons of recovered paper per year. It focuses on innovating recycling facilities and collaborates with companies to keep paper waste out of landfills, which helps create a more sustainable materials management system.
*Please note that this is only a partial list; the complete list of key players is available in the full report. Additionally, the list of key players can be customized to better suit your needs.*
Other key players profiled in the recovered paper market include Cascades Inc., and SUEZ, among others.
Industrial-Grade Recovered Paper
Upto 15% Off
USD
$2499 $2249
$3999 $3599
$4999 $4249
$5999 $5099


*While we strive to always give you current and accurate information, the numbers depicted on the website are indicative and may differ from the actual numbers in the main report. At Expert Market Research, we aim to bring you the latest insights and trends in the market. Using our analyses and forecasts, stakeholders can understand the market dynamics, navigate challenges, and capitalize on opportunities to make data-driven strategic decisions.*
In 2025, the recovered paper market reached an approximate volume of 284.01 MMT.
The market is assessed to grow at a CAGR of 2.50% between 2026 and 2035.
The major drivers of the market include rising demand for tissues, growing concern for the environment, and increasing innovation.
The rise in the usage of recycled paper for containerboard production and increase in industrial production are expected to be key trends guiding the growth of the market.
The major regions in the market are North America, Latin America, the Middle East and Africa, Europe, and the Asia Pacific.
Recovered paper finds applications in containerboard, other paper and board, newsprint, tissue, and printing and writing.
The leading players in global recovered paper market are Waste Management, Inc., Smurfit Kappa Group, DS Smith Plc, Republic Services, Inc., Cascades Inc., and SUEZ, among others.
The market is estimated to witness healthy growth in the forecast period of 2026-2035 to reach a volume of around 363.56 MMT by 2035.
Explore our key highlights of the report and gain a concise overview of key findings, trends, and actionable insights that will empower your strategic decisions.
| REPORT FEATURES | DETAILS |
| Base Year | 2025 |
| Historical Period | 2019-2025 |
| Forecast Period | 2026-2035 |
| Scope of the Report |
Historical and Forecast Trends, Industry Drivers and Constraints, Historical and Forecast Market Analysis by Segment:
|
| Breakup by Type |
|
| Breakup by Application |
|
| Breakup by Region |
|
| Market Dynamics |
|
| Competitive Landscape |
|
| Companies Covered |
|
| Report Price and Purchase Option | Explore our purchase options that are best suited to your resources and industry needs. |
| Delivery Format | Delivered as an attached PDF and Excel through email, with an option of receiving an editable PPT, according to the purchase option. |
Datasheet
One User
USD 2,499
USD 2,249
tax inclusive*
Single User License
One User
USD 3,999
USD 3,599
tax inclusive*
Five User License
Five User
USD 4,999
USD 4,249
tax inclusive*
Corporate License
Unlimited Users
USD 5,999
USD 5,099
tax inclusive*
*Please note that the prices mentioned below are starting prices for each bundle type. Kindly contact our team for further details.*
Flash Bundle
Small Business Bundle
Growth Bundle
Enterprise Bundle
*Please note that the prices mentioned below are starting prices for each bundle type. Kindly contact our team for further details.*
Flash Bundle
Number of Reports: 3
20%
tax inclusive*
Small Business Bundle
Number of Reports: 5
25%
tax inclusive*
Growth Bundle
Number of Reports: 8
30%
tax inclusive*
Enterprise Bundle
Number of Reports: 10
35%
tax inclusive*
How To Order

Select License Type
Choose the right license for your needs and access rights.

Click on ‘Buy Now’
Add the report to your cart with one click and proceed to register.

Select Mode of Payment
Choose a payment option for a secure checkout. You will be redirected accordingly.
Strategic Solutions for Informed Decision-Making
Gain insights to stay ahead and seize opportunities.

Get insights & trends for a competitive edge.

Track prices with detailed trend reports.

Analyse trade data for supply chain insights.

Leverage cost reports for smart savings

Enhance supply chain with partnerships.

Connect For More Information
Our expert team of analysts will offer full support and resolve any queries regarding the report, before and after the purchase.
Our expert team of analysts will offer full support and resolve any queries regarding the report, before and after the purchase.
We employ meticulous research methods, blending advanced analytics and expert insights to deliver accurate, actionable industry intelligence, staying ahead of competitors.
Our skilled analysts offer unparalleled competitive advantage with detailed insights on current and emerging markets, ensuring your strategic edge.
We offer an in-depth yet simplified presentation of industry insights and analysis to meet your specific requirements effectively.


