

Consumer Insights
Uncover trends and behaviors shaping consumer choices today
Procurement Insights
Optimize your sourcing strategy with key market data
Industry Stats
Stay ahead with the latest trends and market analysis.
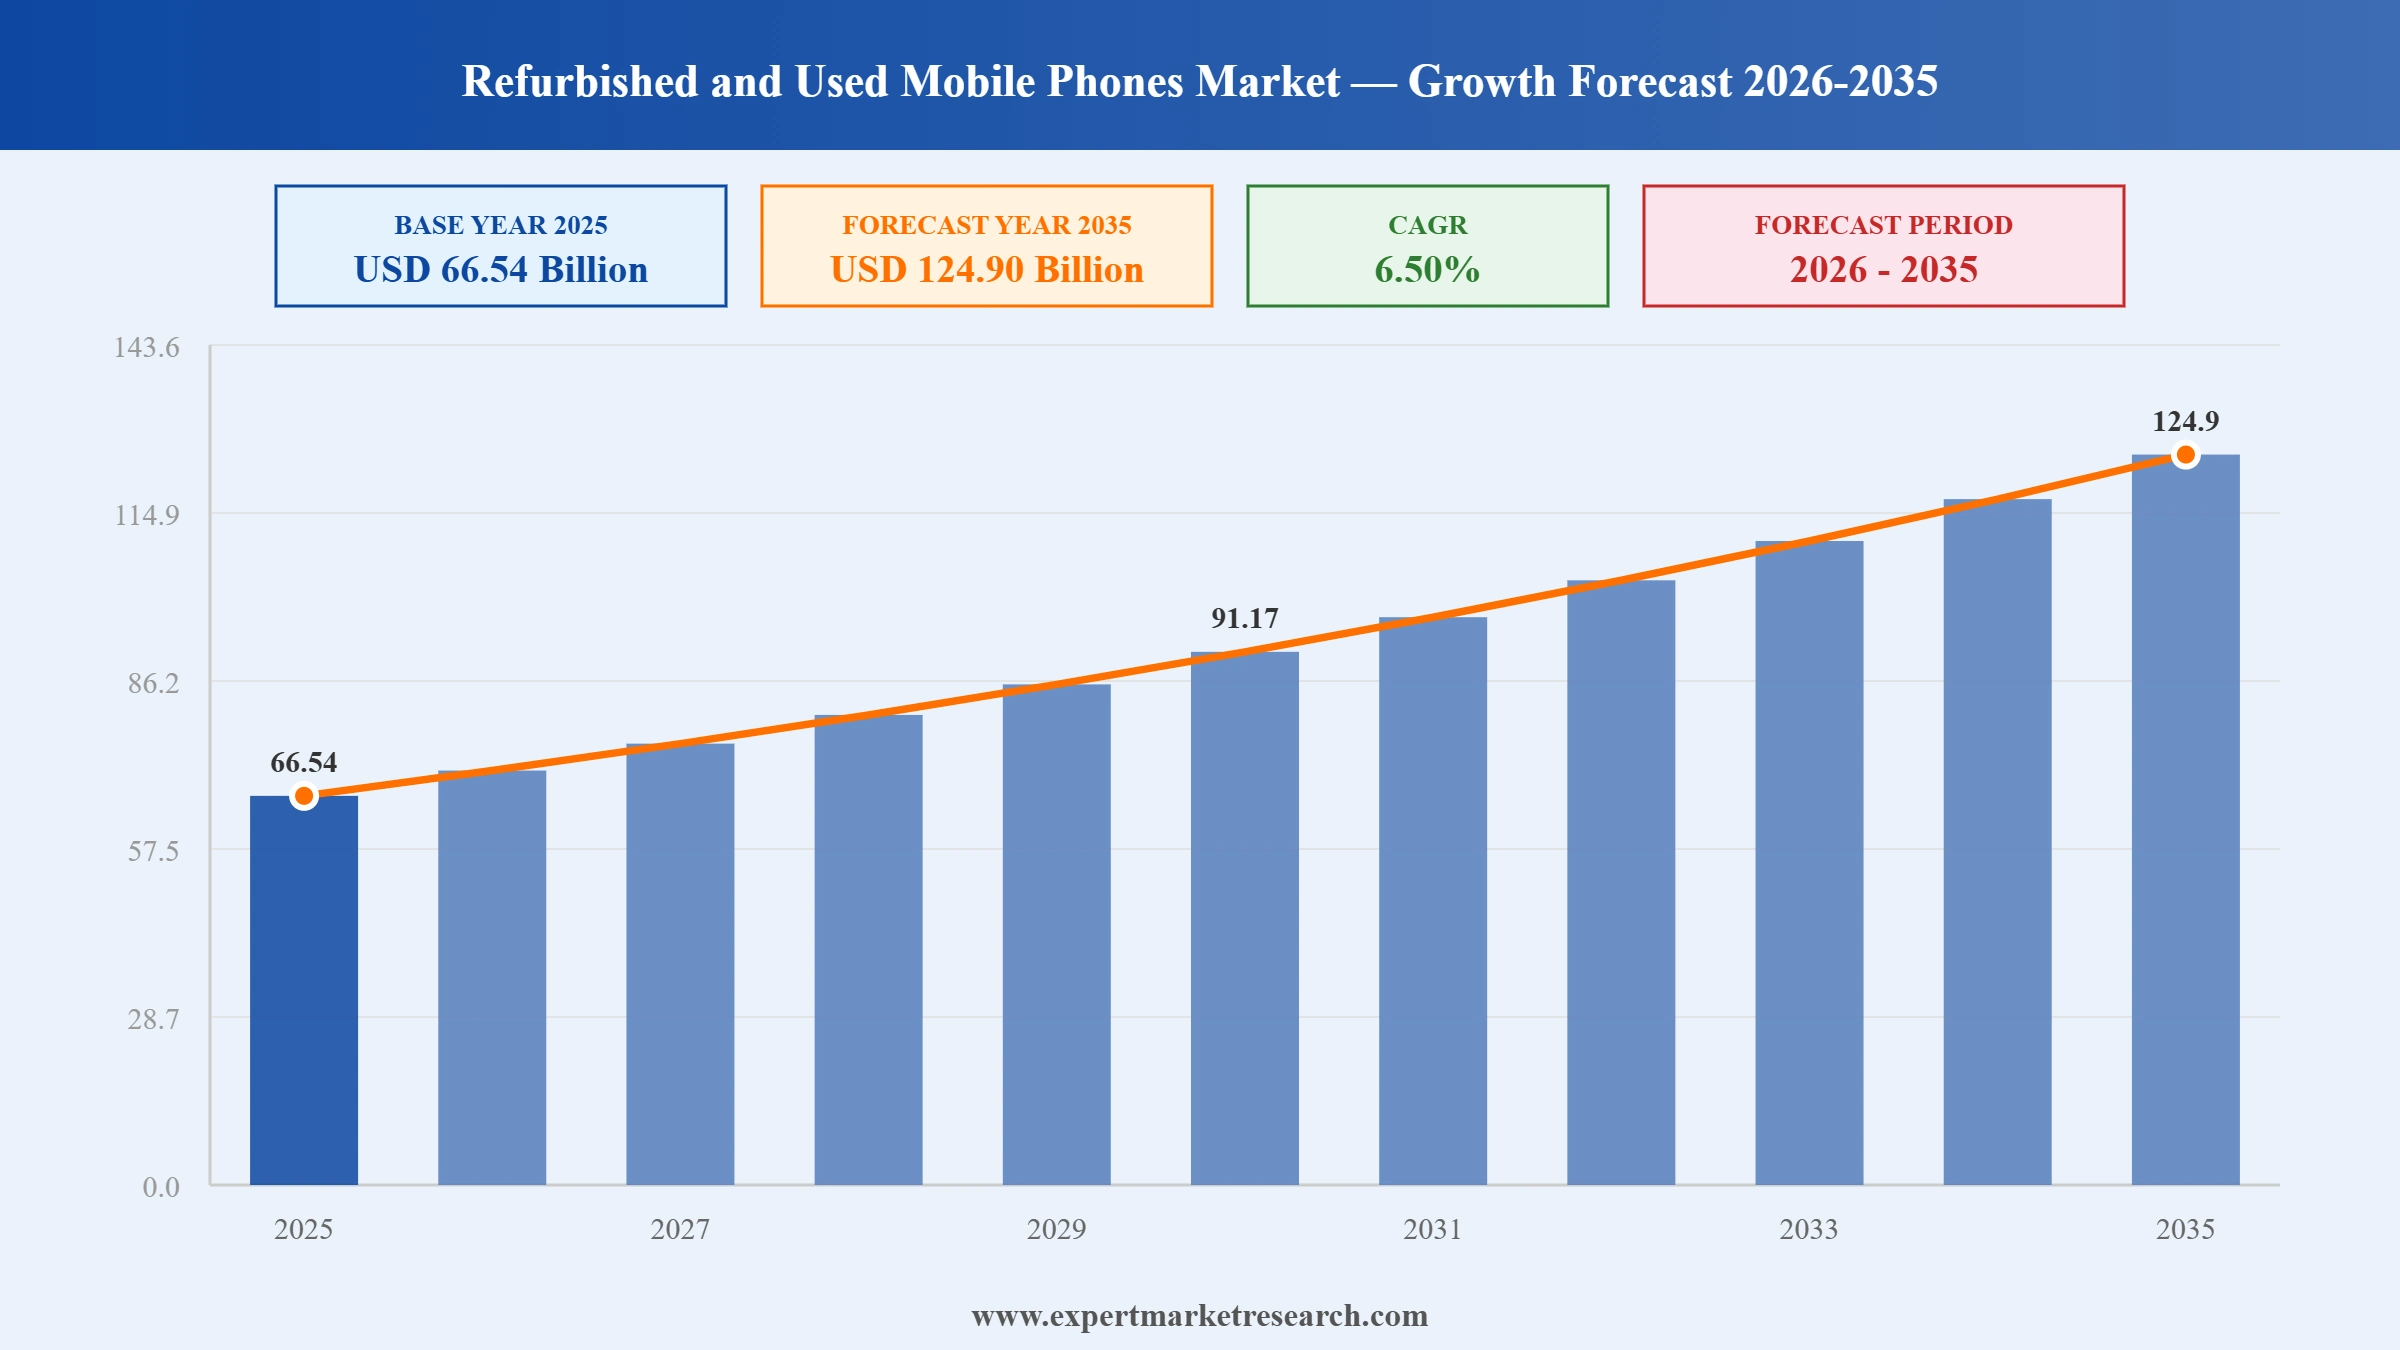
The global refurbished and used mobile phones market attained a value of USD 66.54 Billion in 2025 and is projected to expand at a CAGR of 6.50% through 2035. The market is further expected to achieve USD 124.90 Billion by 2035. With growing enterprise buyback schemes for devices and technological advancements in the area of refurbishment based on artificial intelligence, certified resale systems are becoming more advanced.
Players in the refurbished and used mobile phones market are providing more stable supply chains, building customer trust, preventing e-waste, and promoting sustainability in procurement processes all around the world. Rapid development of certified trade-in systems connecting telecoms and online marketplaces leads to faster supply of premium smartphones through secondary markets. On top of that, with the growth of automated systems for diagnosis of dozens of hardware features in a matter of minutes, the process of refurbishment is becoming easier.
There is an increased enterprise involvement in the refurbished and used mobile phones market with the use of circular economy practices among device manufacturers and certified resellers. For example, in May 2025, Apple introduced additional devices to the Self Service Repair program along with availability of genuine parts which improves the after-market network while enhancing lifecycles of the products. Moreover, global second-hand smartphones market is observing shipment growth on year-on-year basis despite decreased demand for new devices showing that certified refurbishment is becoming an appealing business segment for device manufacturers, telecom providers, and organized retailing organizations.
Increased sustainability and affordability of devices is changing the competitive landscape of the refurbished and used mobile phones market. Leading enterprises are investing in AI-based diagnostic tools, grading processes, and battery health assessment technologies to standardize the quality of refurbishment process. For example, in September 2025, Vodafone and Recommerce launched a refurbished smartphone partner shop offering 500 models, warranties, affordability, and sustainable device choices. Collaborations between e-commerce channels, telecom carriers, and buyback services are also leading to certified trade-in programs which assure steady supply of the devices along with higher consumer confidence. Such activities allow brands to minimize electronic waste and create sustainable revenues through extended warranties, data sanitization services and certification standards that can help them attract corporate procurement departments and value-oriented consumers.
Read more about this report - REQUEST FREE SAMPLE COPY IN PDF
Samsung launched the Certified Re-Newed program in India, selling refurbished Galaxy smartphones equipped with genuine spare parts, quality checks, warranties, and post-sales service. This shows that there is growing consumer trust in OEM-certified refurbishment services that deliver affordability, high performance, and quality assurance. Manufacturers can thus develop OEM-certified programs for refurbishment of smartphones with warranties and genuine components to boost consumer trust.
EE expanded its refurbished smartphone line with quality checks, warranties, and payment plans, giving consumers access to affordable yet high-quality products. This illustrates the growing engagement of telecom operators with circular smartphones. Telecom operators can incorporate certified refurbished smartphones in their programs of subscriptions and upgrades to retain more customers, accelerating demand in the refurbished and used mobile phones market.
Google collaborated with Cashify to sell certified refurbished Pixel smartphones in India. The partnership shows increasing efforts by OEMs to have a structured ecosystem for reselling products. It enables longer lifecycle management and helps in making smartphones affordable for more users. Smartphone manufacturers can partner with refurbishing experts to develop more certified reselling channels for reaching value-conscious customers.
Flipkart launched a quick-commerce platform for exchanging smartphones with the help of Prexo Technology which allows instant evaluation of the phone. Such moves will be helpful in promoting the use of circular electronics, besides facilitating quicker reselling cycles. eCommerce websites can utilize AI-driven platforms to facilitate quick trade-ins of smartphones, boosting the refurbished and used mobile phones market growth.
OEMs are building up their certified refurbishment business to leverage the benefits of the booming circular economy without damaging the brand image. Investments in factory grade refurbishments, genuine spare parts, and extended warranty offerings help them differentiate certified devices from the disorganized channels of resellers, boosting the refurbished and used mobile phones market growth. For example, Samsung is consistently launching a new range of Certified Re-New smartphones in various markets, while Apple is offering more repair capabilities via the Self-Service Repair program, which enhances access to genuine parts. Government policies such as the Right to Repair policy by the EU encourage manufacturers to improve repairability and product longevity. For instance, in December 2024, Swappie expanded refurbished smartphone adoption, reducing carbon emissions, conserving critical raw materials, and promoting affordable circular electronics across Europe.
AI technologies are revolutionizing the refurbished and used mobile phones market dynamics owing to rapid testing, battery health checks, cosmetic grading, and fraud detection. With automated testing platforms, fewer interventions from workers are needed and consistent results for large-scale refurbishing facilities are ensured. Major refurbishers are adopting machine learning models that can detect unseen flaws in order to minimize the number of warranty claims and expenses for refurbishing processes. In addition, Assurant and other lifecycle management companies keep making investments in AI-based diagnostics. In October 2025, Cashify launched its AI-powered Refurbia campaign, promoting refurbished gadgets, circular economy awareness, sustainable consumption, and second-life smartphone adoption
Mobile network operators are developing trade-in networks in order to ensure consistent inventories for refurbishment, along with urging smartphone upgrades. An increasing number of carriers are partnering with refurbishment experts and retailers in order to provide instant valuation, certified data wiping, and upgrade financing, boosting the refurbished and used mobile phones market growth. Exchange schemes developed by Verizon, AT&T, and Vodafone motivate users to trade their old smartphones, thus increasing the circularity of devices. The United States Federal Communications Commission is actively promoting affordable connectivity initiatives, which contribute to wider access to cheaper smartphones, including refurbished ones. In July 2026, BSNL launched a satellite phone delivering off-grid connectivity, emergency communication, rugged reliability, and nationwide remote-area coverage.
Policies of circular economy promoted by governments create an environment that encourages electronic devices reuse and recycle and, thus, positively affect the refurbished and used mobile phones market trajectory. The Circular Economy Action Plan of the European Union focuses on increasing the lifespan of products through repair, refurbishment, and reuse, decreasing the overall generation of electronic waste. Such policies inspire investment into the development of certified refurbishment centers, reverse logistics systems, and sustainable electronics management. International refurbishment companies are developing regional processing hubs in order to comply with environmental regulations. In July 2025, Omdia highlighted intensifying competition among smartphone brands, driven by AI innovation, premiumization, retail expansion, and evolving consumer demand.
Companies are integrating certified refurbished phones into their enterprise mobility strategy in order to reduce costs in terms of technology use while maintaining security and performance standards. Companies in the refurbished and used mobile phones market are now able to offer their services for use by large businesses including testing, secure data destruction certification, MDM compliance, and deployment warranty services. Amazon Renewed and Back Market are expanding their services in ways that make it easier for businesses to purchase large quantities of refurbished phones. Governments are also supporting sustainable procurement policies, which favor reuse of electronic products when it is possible.
The EMR’s report titled “Global Refurbished and Used Mobile Phones Market Report and Forecast 2026-2035” offers a detailed analysis of the market based on the following segments:
Market Breakup by Type
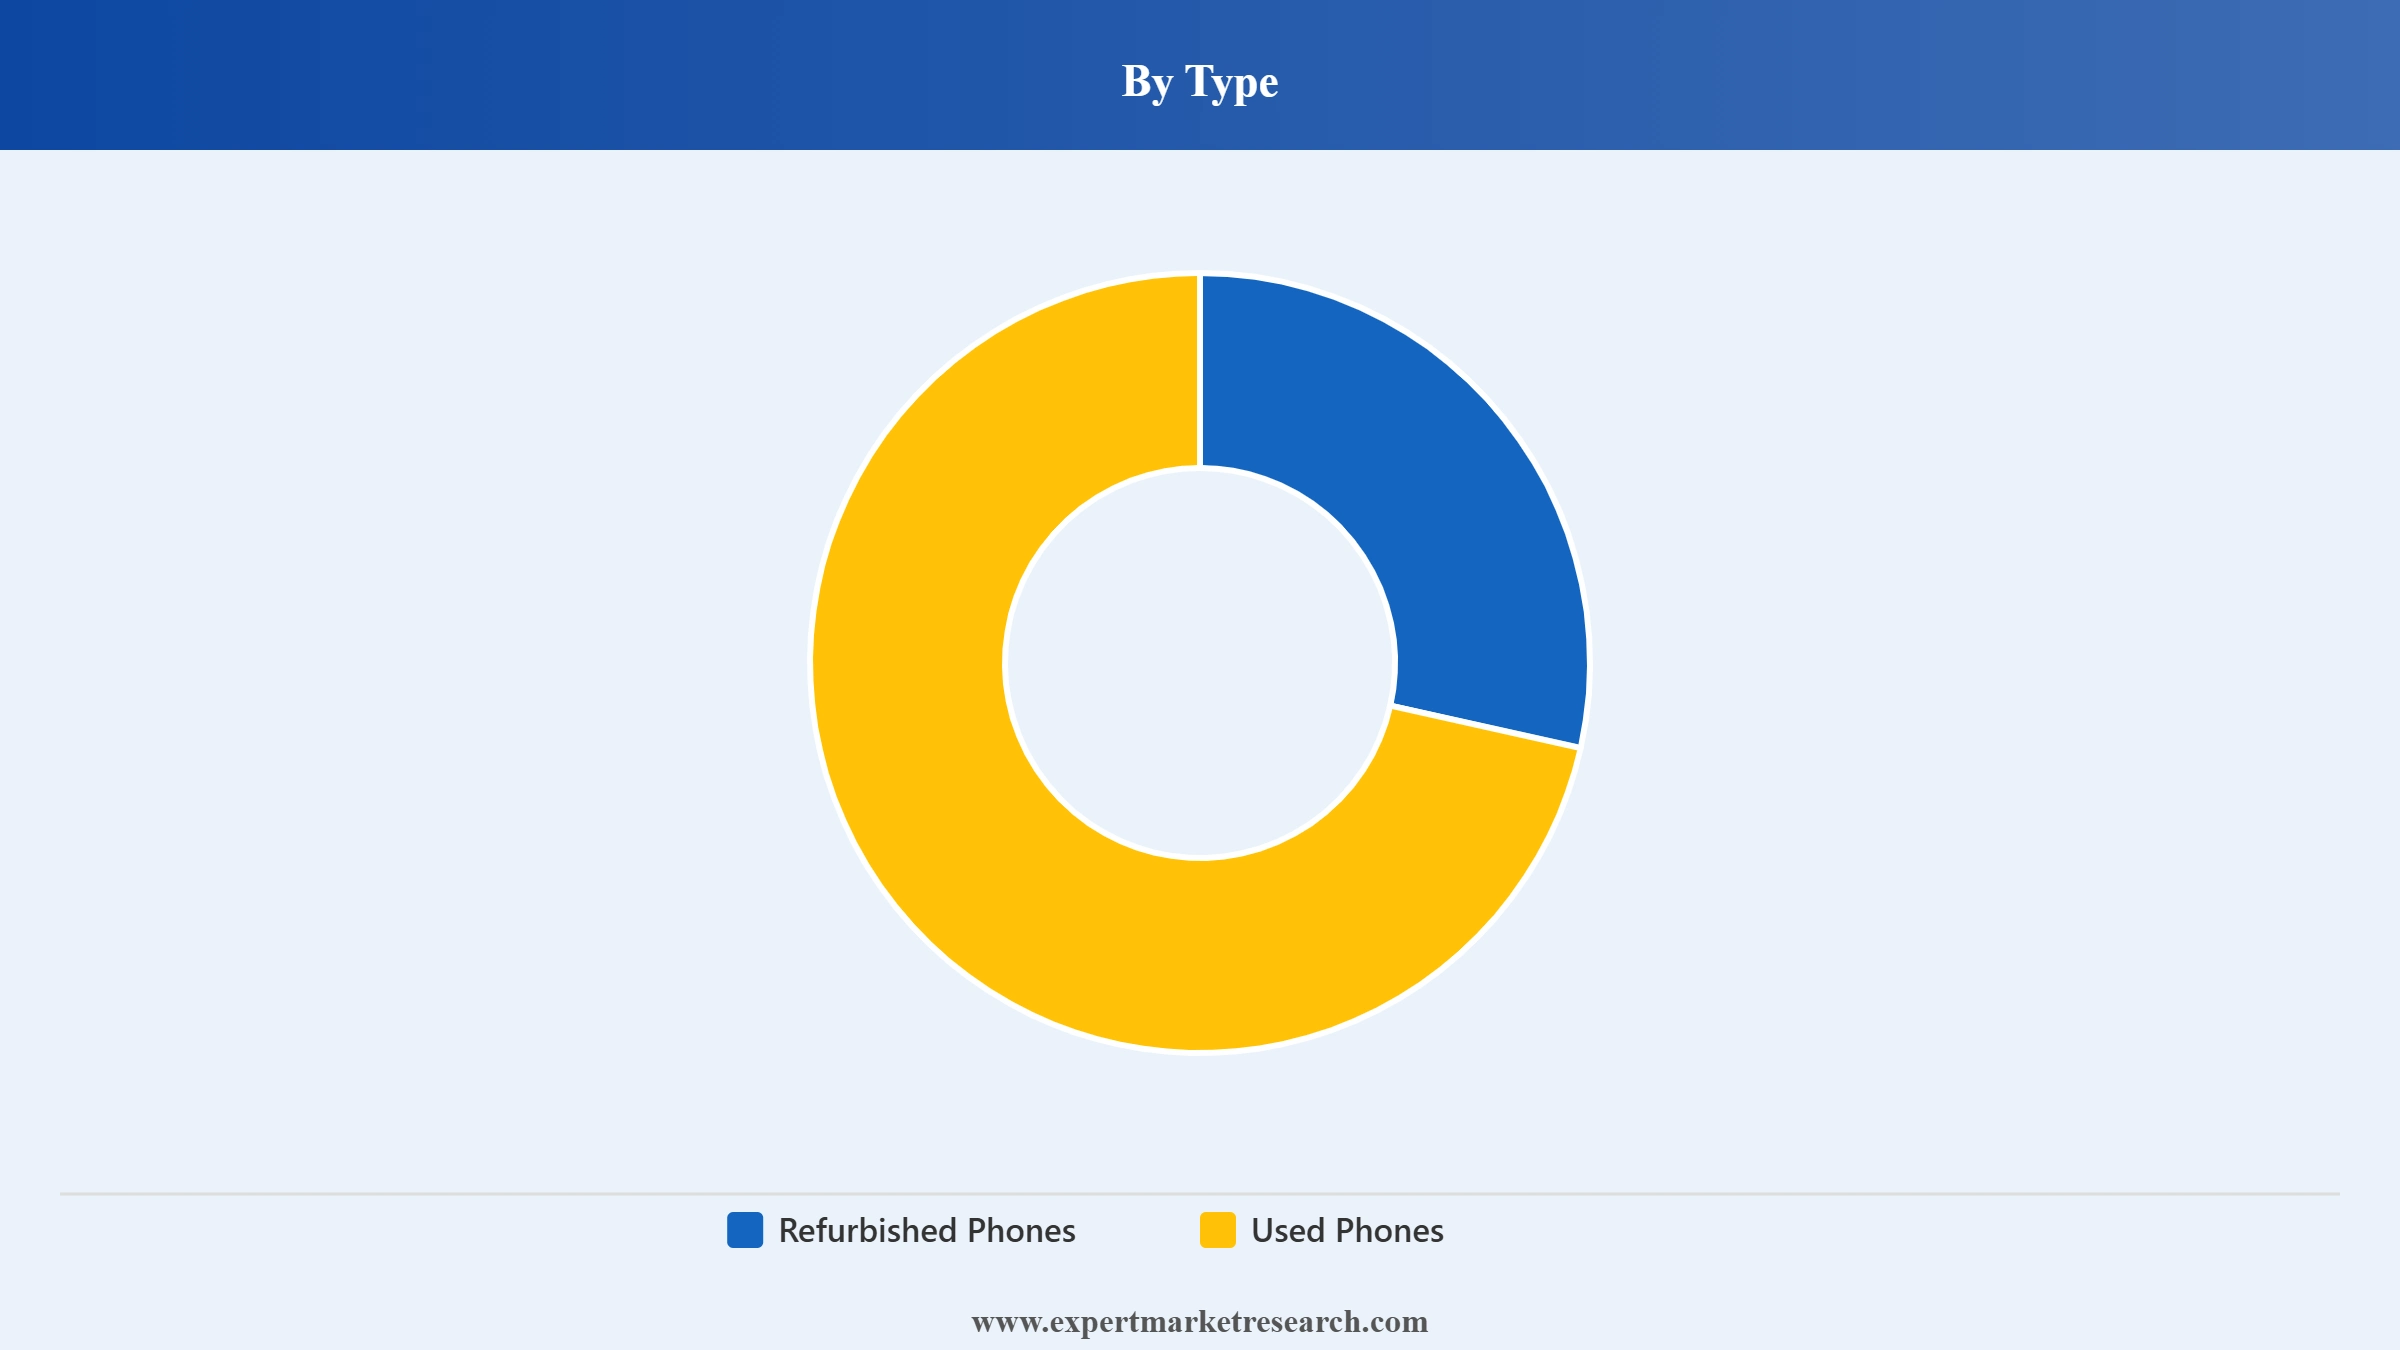
Key Insight: Demand trends in the refurbished and used mobile phones market are quite different between the two groups within the refurbished and used mobile phones sector. Refurbished mobiles are positioned at the forefront due to the guarantee on quality, warranty provisions, and the process of standardization of refurbishing. Used mobiles are gaining traction quickly due to affordability, improved e-commerce platforms, and shortened lifecycle of smartphones. The former attracts people who need dependable gadgets while the latter appeals to people looking for cheaper and functioning smartphones. In this way, both sectors complement each other in making the electronics industry eco-circular through maximizing device usage and sustainable consumption.
Market Breakup by Pricing Range
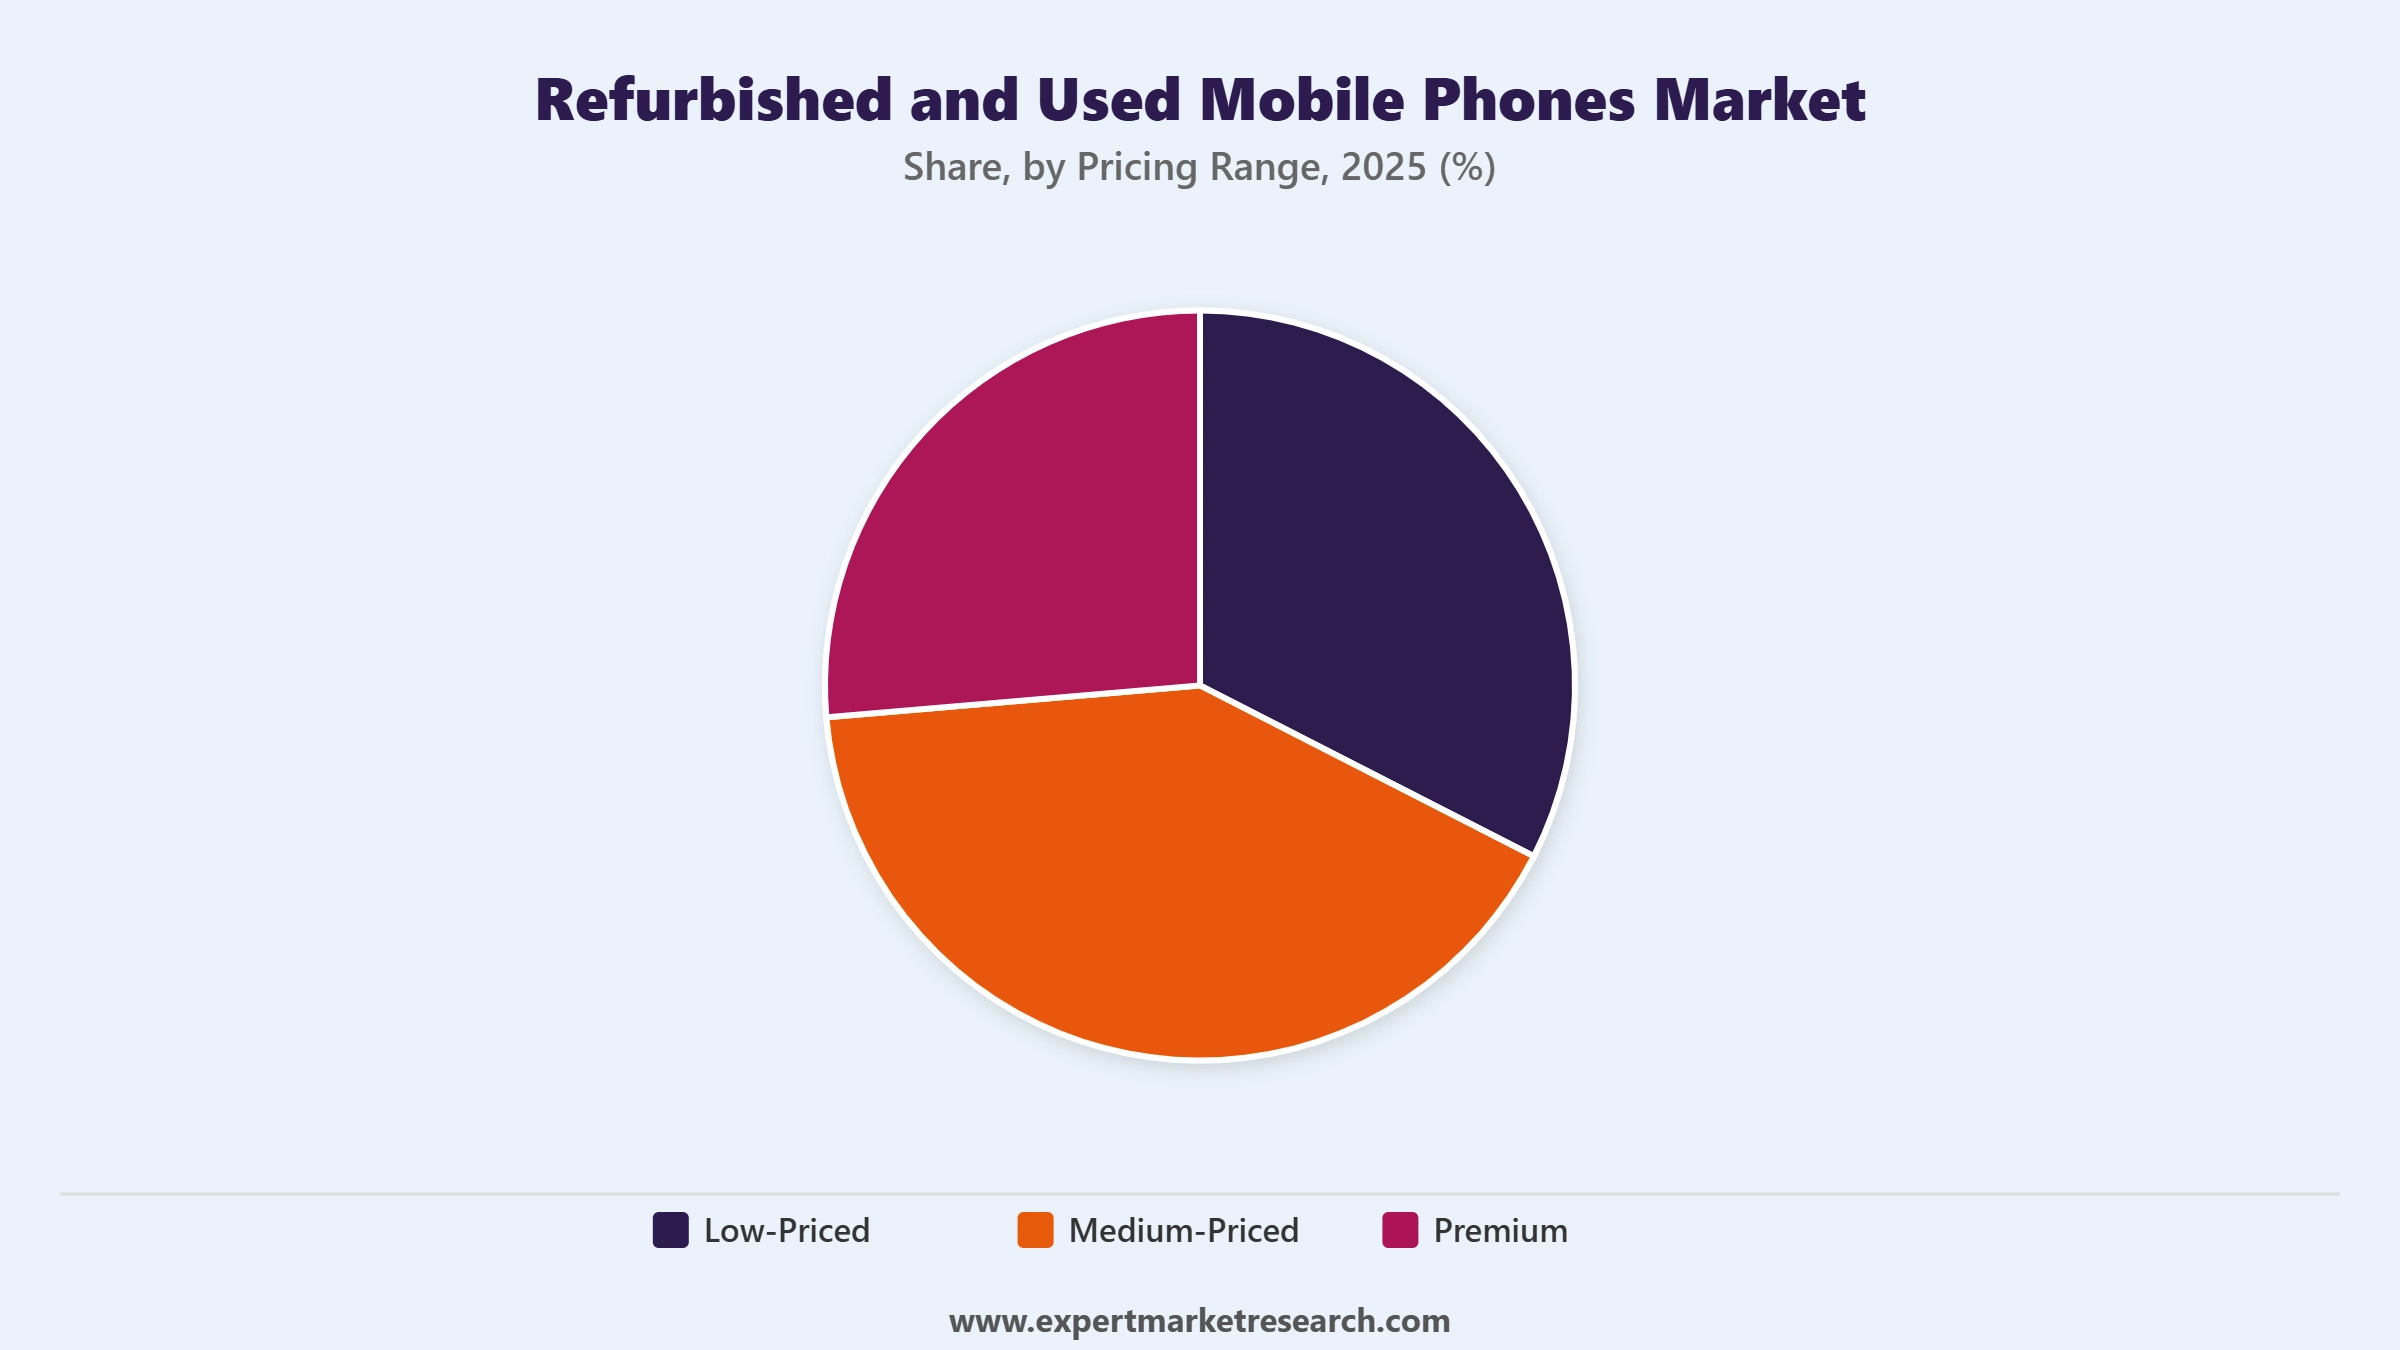
Key Insight: Pricing strategies are of great importance in making buying decisions within the refurbished and used mobile phones market. Cheaper smartphones continue being appealing to first-time buyers as well as budget customers needing the basic functionalities. Midrange smartphones are popular since they are able to balance costs and reliability and therefore can be used either personally or professionally. There is increased demand for premium refurbished smartphones due to certified refurbishment that ensures that even flagships technologies are available at cheaper prices than their new models.
Market Breakup by Distribution Channel
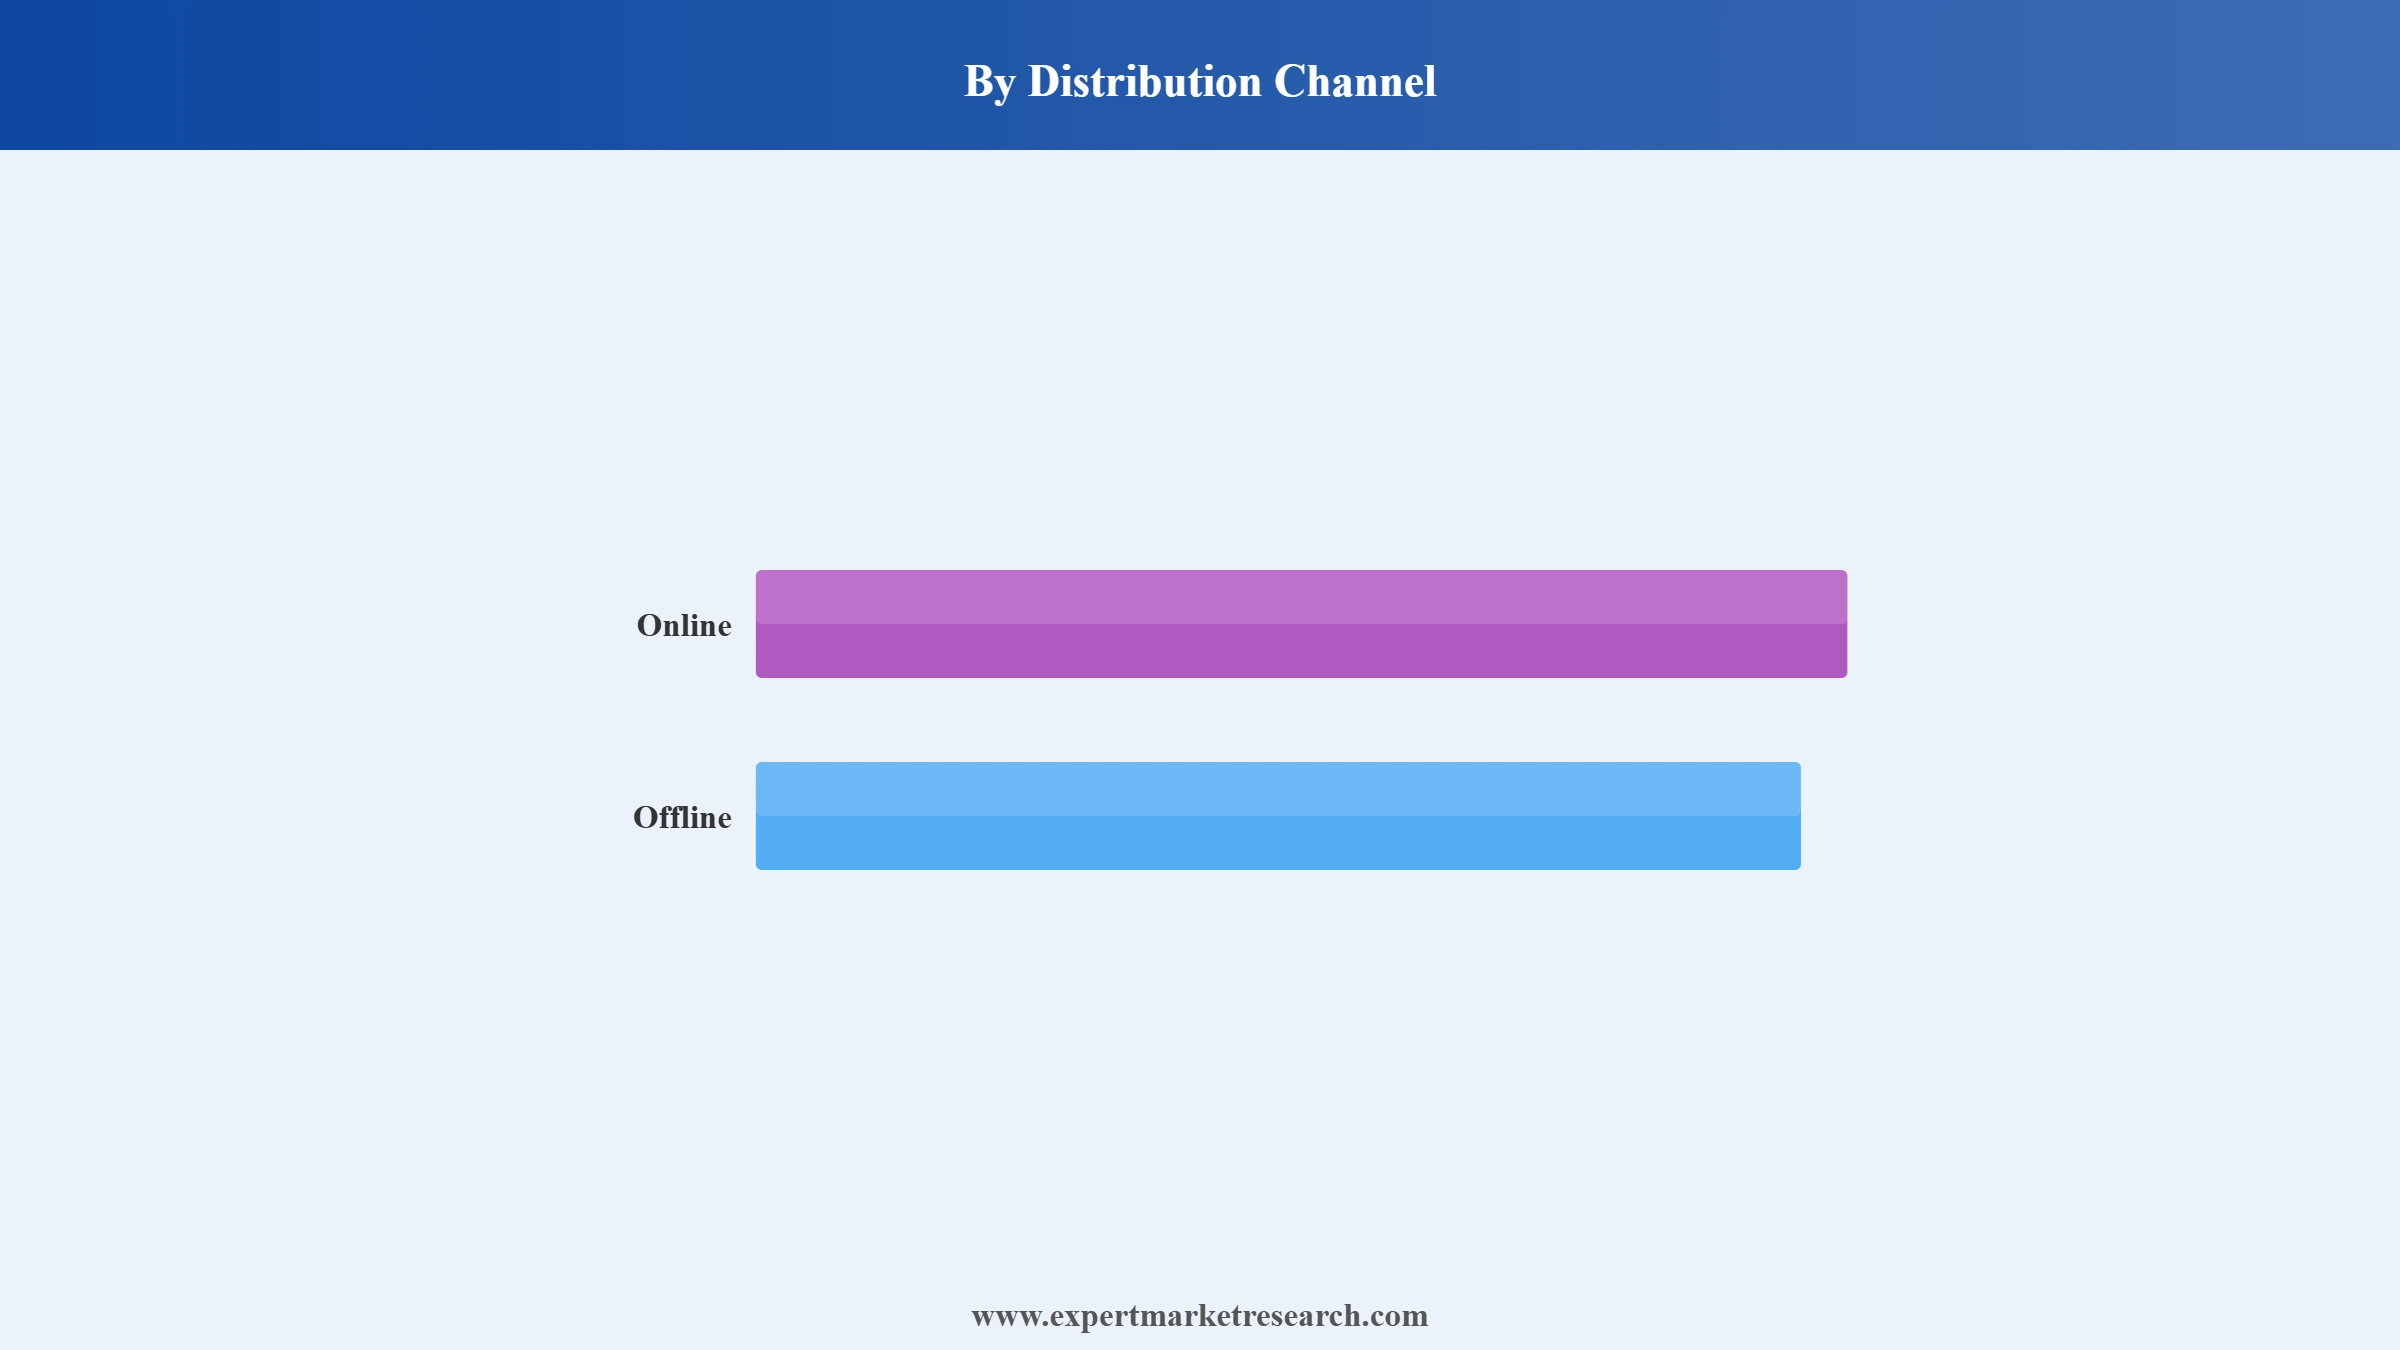
Key Insight: Distribution channels are now changing the entire refurbished and used mobile phones market dynamics in order to cater to various customer purchasing behaviors. This is because online distribution channels prevail owing to the advantages of higher product variety, pricing clarity, ease of digital access, and national coverage of certified refurbished smartphones. Meanwhile, offline distribution channels increase in numbers due to their ability to offer hands-on inspection, consultations, and immediate availability of products which builds buyer confidence. While digital marketplaces effectively cater to the needs of technologically savvy buyers and corporate buyers, offline stores attract customers who need personal contact prior to purchase.
Market Breakup by Region
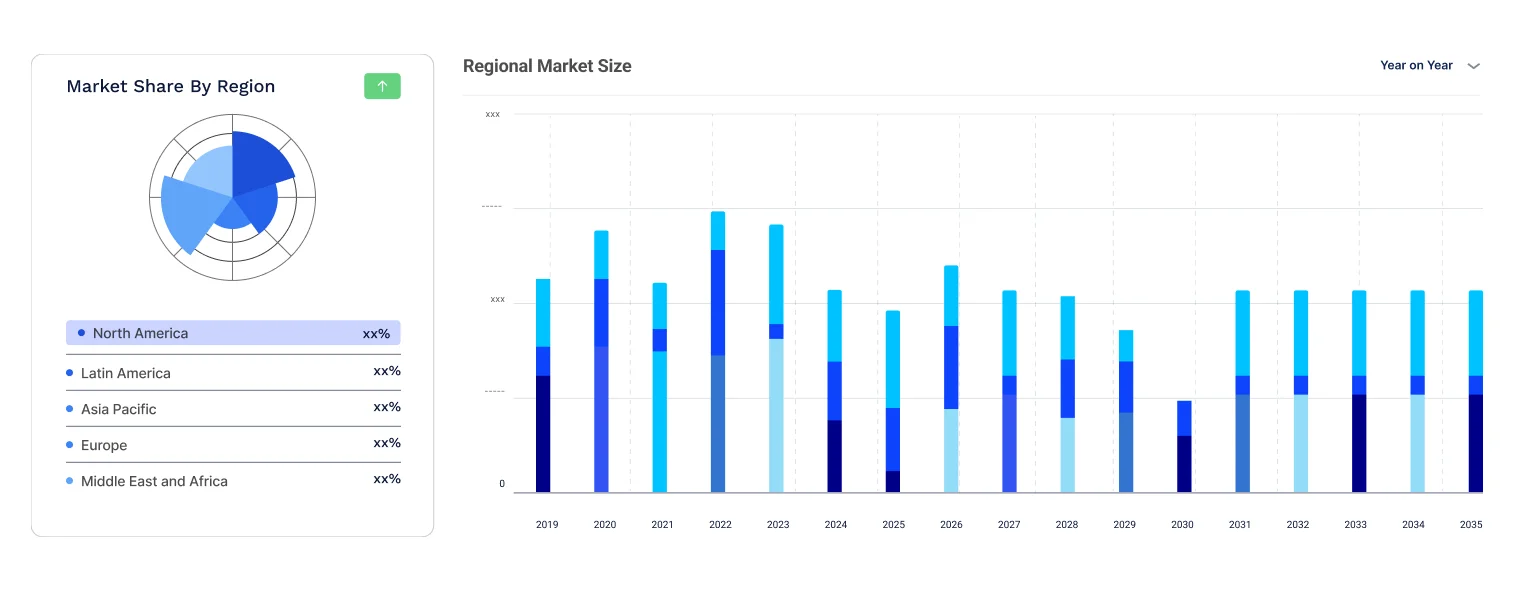
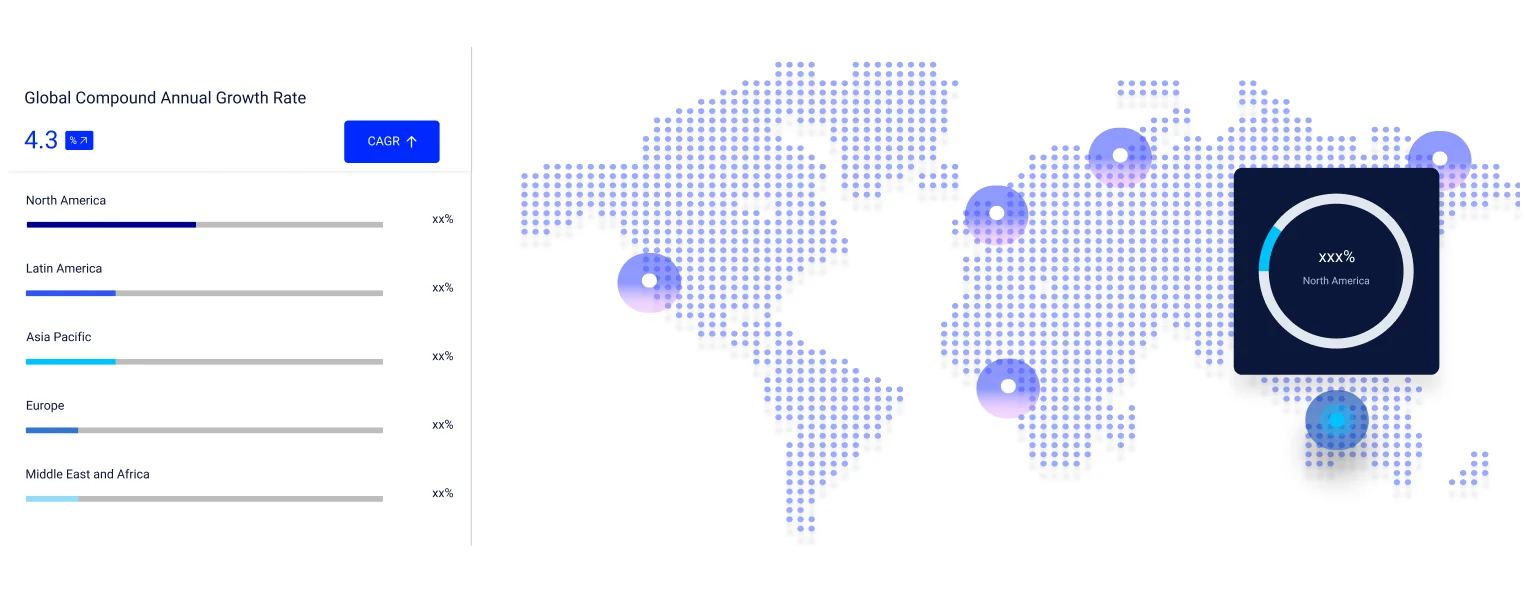
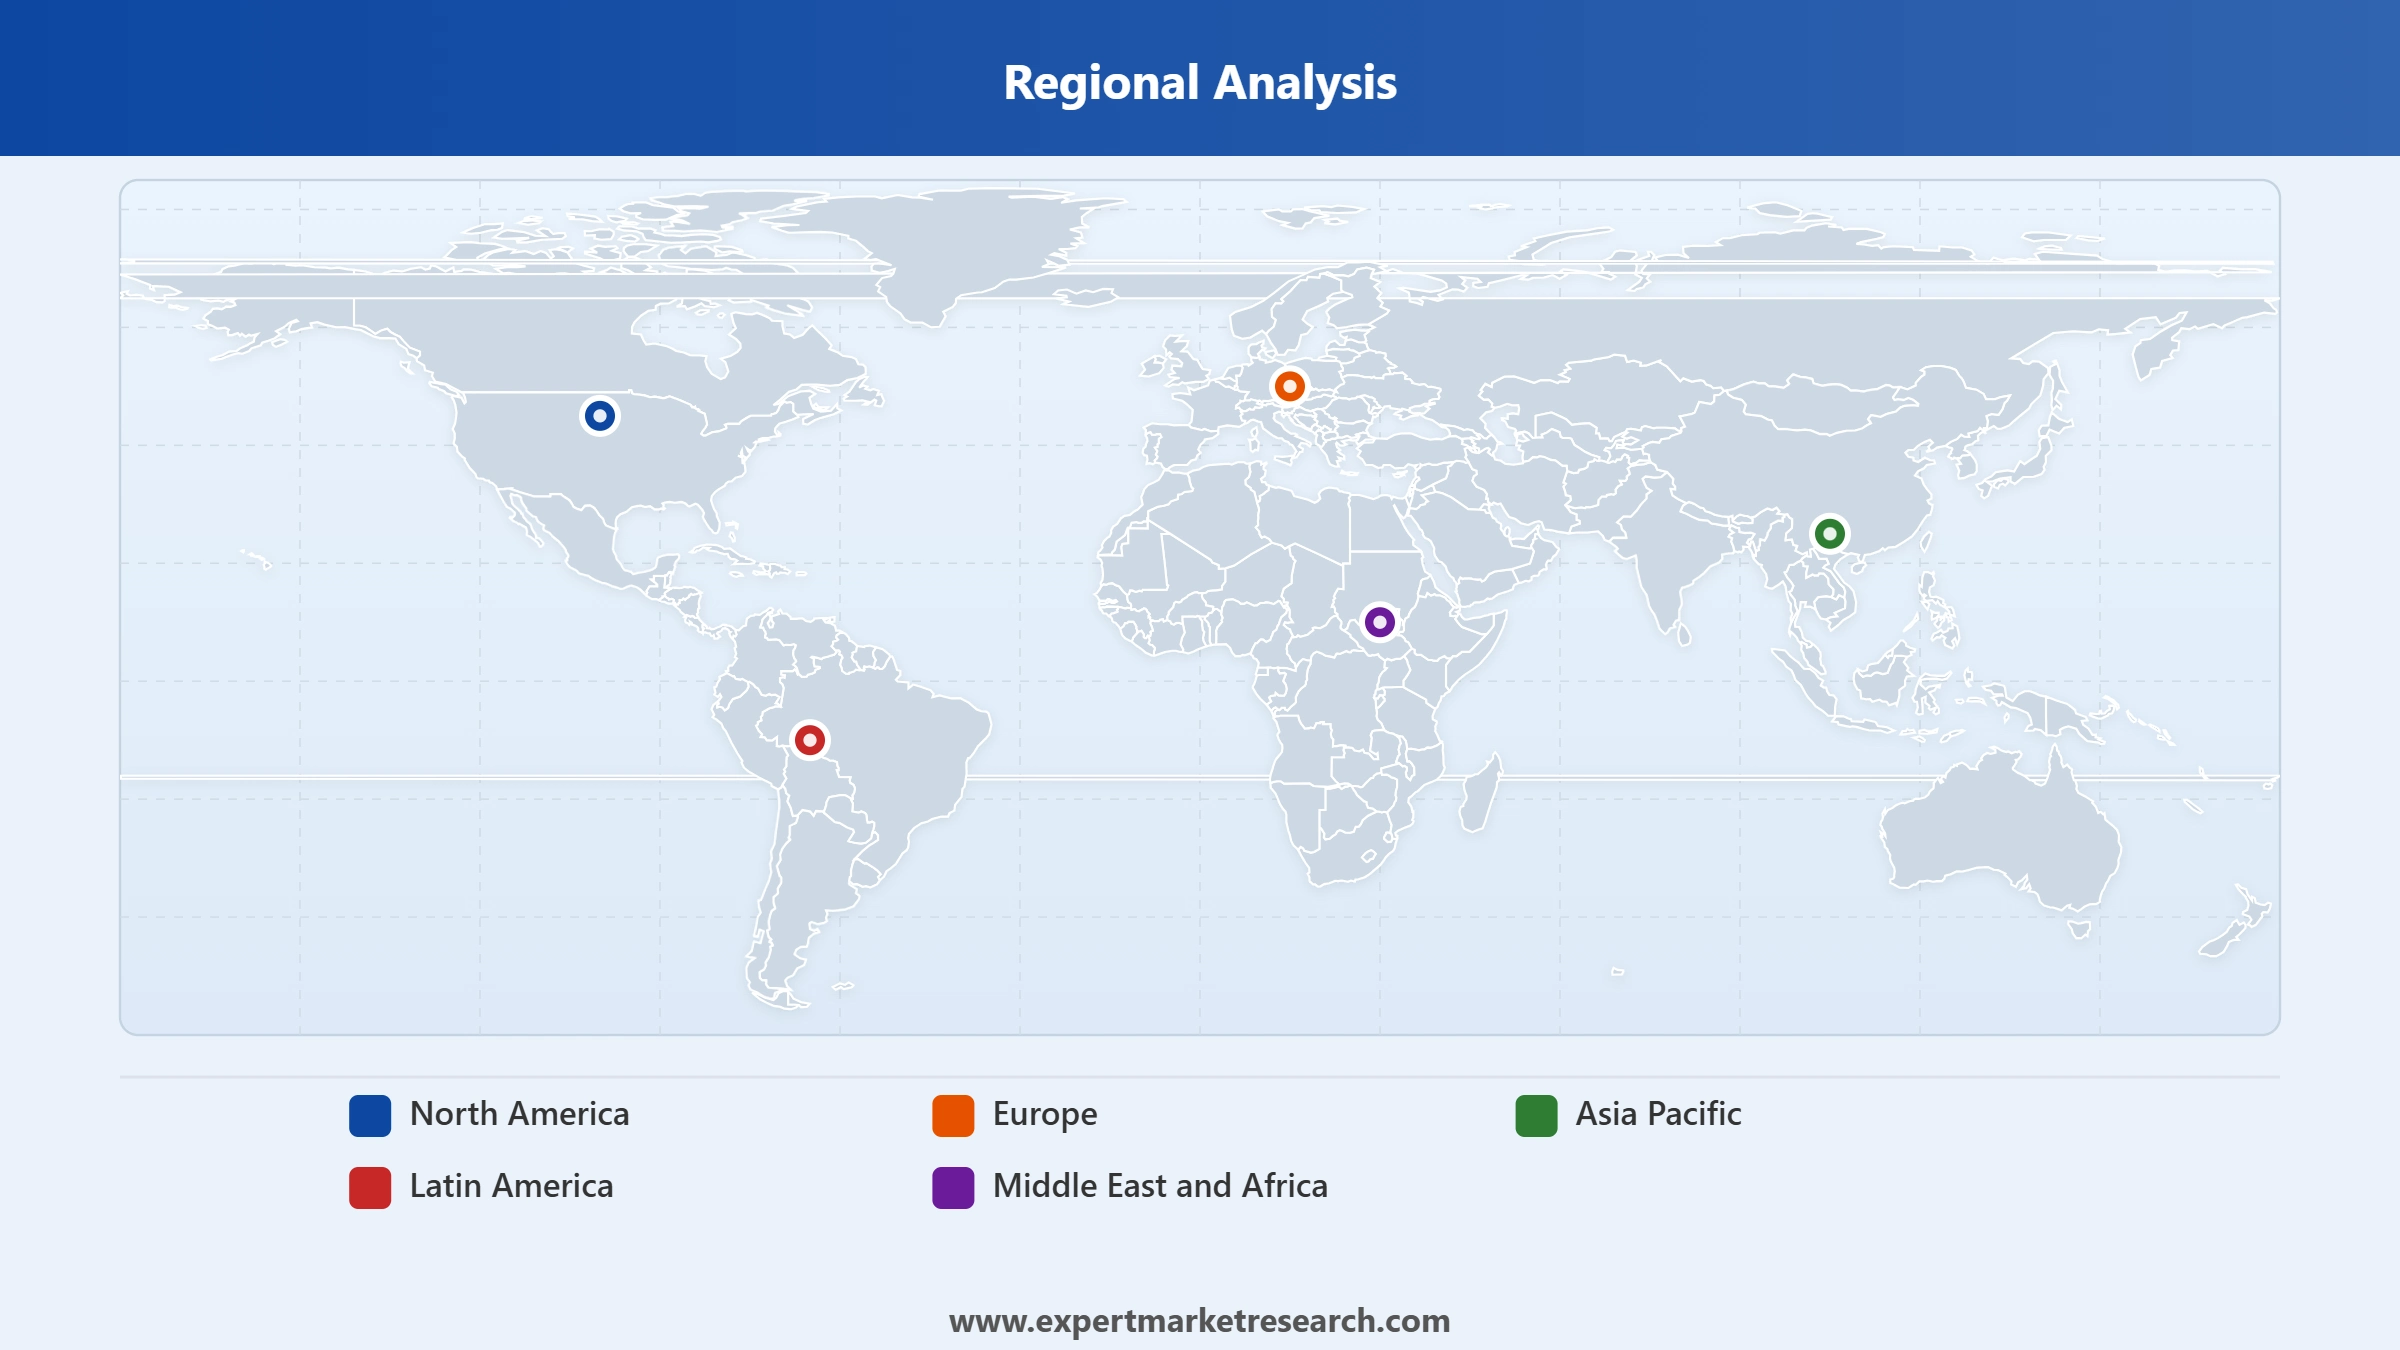
Key Insight: In North America, there is a well-developed trade-in ecosystem, retail organization, and enterprise mobility programs. Sustainability laws and repairs drive the European refurbished and used mobile phones market; moreover, the region is characterized by the development of certified refurbished electronics. Asia Pacific is a leader due to a large demand for smartphones, expanding refurbishment capabilities, and growing number of affordability-seeking customers. Latin America observes significant potential, while affordable smartphones are increasingly becoming necessary for digital inclusion. In turn, the Middle East and Africa regions have a slow but steady expansion due to increased smartphone penetration, improved retail, and demand for affordable mobile devices.
Read more about this report - REQUEST FREE SAMPLE COPY IN PDF
By type, refurbished phones dominate the market owing to certified quality assurance standards
Second-hand phones boast the largest share in the refurbished and used mobile phones market revenue as people are increasingly favoring professionally refurbished phones that are covered by warranties and have been tested for authenticity. The manufacturers, telecommunication companies, and refurbishing businesses are putting emphasis on using real spare parts, battery replacement, and artificial intelligence-based diagnostic processes for better durability of their products. Sustainability goals of companies and the concept of circular economy add fuel to this trend even further. The availability of the latest phone models but with a much lower price point is especially appealing to businesses, education sector, and eco-conscious buyers. As per reports published in December 2025, Cashify sold over 300,000 refurbished smartphones in 2025, expanding circular economy adoption while aiming to prevent 2.4 million devices from reaching landfills in 2026.
Read more about this report - REQUEST FREE SAMPLE COPY IN PDF
Used phones are experiencing the most rapid development in the refurbished and used mobile phones market owing to the emergence of peer-to-peer marketplaces, online trade-in platforms, and rising demand for affordable phones in emerging economies. Low-price segments attract an increasing number of buyers, whereas the security of the buying process is ensured by means of digital technologies. Independent vendors and small-scale businesses also benefit from easier resale processes. Higher replacement rates for the latest flagships is expected to facilitate the availability of quality used phones.
Medium-priced smartphones lead the market through balanced affordability and premium features
The medium-priced smartphones make up the biggest share in the refurbished and used mobile phones market as they offer an optimum balance between performance, reliability, and cost of purchase. The users get access to state-of-the-art processors, good camera modules, and software support for longer than they would pay full retail prices. The enterprises also prefer to buy these products for employee smartphones provision since the devices offer a proper balance of procurement costs and performance. Certified refurbishment provides even more trust and makes the medium-priced smartphones preferable both for educational institutions, enterprise mobility initiatives, and individual users. In July 2026, Cashify showcased refurbished POCO M2 Pro, highlighting affordability, quality checks, warranty coverage, reliable performance, and sustainable smartphone ownership.
Read more about this report - REQUEST FREE SAMPLE COPY IN PDF
The fastest growth in the refurbished and used mobile phones market is observed from the premium refurbished smartphone category due to increasing demand for flagship smartphones. The specialized refurbishing companies are offering bigger inventory of premium smartphones that undergo certified battery replacement and quality checks and provide additional guarantees for them. Manufacturers and telecom companies are implementing more trade-in programs to guarantee a constant supply of premium devices to secondary markets. The businesses are also choosing premium refurbished smartphones for executive mobility initiatives due to higher security level and performance.
By distribution channel, the online category dominates the market through wider product selection and transparent price comparison
Online platforms hold the majority of refurbished and used mobile phones market share due to a broad range of available products, certified refurbishment possibilities, transparency in pricing, warranty, and reviews from other users. Specific marketplaces and manufacturer websites allow consumers to make a comparison of devices in accordance with the grading system, battery conditions, and specifications. The protection of digital transactions, door-to-door delivery services, and trade-ins provide additional conveniences during the purchasing process. Companies also buy their devices via enterprise-specific websites that help in easier purchasing and managing inventories. In August 2025, TRAI considered initiatives promoting second-hand devices, accelerating digital inclusion, affordability, smartphone reuse, and circular economy adoption in India.
Read more about this report - REQUEST FREE SAMPLE COPY IN PDF
Offline sales are gaining momentum in terms of boosting the refurbished and used mobile phones market penetration through organized retail channels setting up special departments for refurbished smartphones with physical checking, immediate activation, and technical assistance. Users prefer the possibility to check the condition of the device personally and have access to warranty services right away. Retail franchises are partnering with certified refurbishing companies to increase the credibility and quality of products and services. Expanding franchises and electronics retail networks in developing countries are enhancing offline sales even further.
Asia Pacific clocks in the leading market position through massive smartphone ownership and expanding refurbishment ecosystems
The Asia Pacific region leads as the largest regional refurbished and used mobile phones market owing to the large pool of smartphone users, digital connectivity, and organized refurbishment market. The presence of strong manufacturing abilities, vibrant trade-in markets, and increasing requirements of affordability help fuel the demand for certified refurbished smartphones in the market. The presence of certified refurbishers, e-commerce websites, and telecom companies in nations like India, China, and Southeast Asia add to the emergence of this trend. Urbanization and digital inclusion campaigns help drive the adoption of secondary smartphones in the region. In June 2026, Recello launched a smartphone recommerce platform offering transparent buyback pricing, doorstep pickup, faster payments, and refurbished device resale.
The fastest growth is observed in the European refurbished and used mobile phones market owing to regulations that promote sustainability and Right to Repair campaigns which help in driving demand for certified refurbished smartphones. Increasing use of certified refurbished smartphones in business sustainability programs and green consumerism are helping to boost the demand for certified refurbished smartphones in the market. Certified refurbishment providers continue to invest in standardized testing and extended warranty services to meet regional quality standards.
Read more about this report - REQUEST FREE SAMPLE COPY IN PDF
The global industry is expected to see a more structured competitive landscape emerging due to the efforts made by refurbished and used mobile phone companies, telecom operators, and digital marketplaces to develop certified resell eco-systems. The major companies are concentrating on developing AI-enabled device diagnostics, automated cosmetic grading, certification of battery status, and safe data erasure to boost client confidence and decrease returns. In addition, the firms are growing their trade-in schemes and reverse logistics operations in order to receive a reliable supply of high-quality smartphones for refurbishment.
Leading refurbished and used mobile phones market players find another growth area associated with enterprise mobility services as many companies purchase certified and refurbished devices in order to keep their costs for IT low while achieving sustainability goals. Blockchain-based device traceability, certified resale programs, and regional refurbishment facilities are used by the firms to differentiate themselves from their competitors. Moreover, the growth of right-to-repair initiatives and circular economy movements might compel the companies to collaborate with retailers, logistic firms, and banks to provide flexible payment solutions, subscription services, and lifecycle management options.
Since its establishment in 1976 in Cupertino, California, United States, Apple has enhanced its operations within the refurbished and used mobile phones market through its Apple Certified Refurbished range of products, trade-in certified programs, and repairs. The company emphasizes real replacement parts, secure software support, durability of the battery, and high-quality customer experience, as well as prolonging the life cycles of the products.
Samsung was founded in 1969 in Suwon, South Korea, and caters to the refurbished smartphone market through the Certified Re-New smartphone range of products. Samsung concentrates on factory tested products, quality assurance, extended software updates, and sustainable product life cycle management.
Formed in 1994 and located in Seattle, Washington, United States, Amazon is part of the market via Amazon Renewed, providing professionally inspected and tested refurbished phones by certified retailers. This platform provides warranty-protected purchasing, quality verification process, product grading, and wide-range distribution abilities. It gives an online marketplace for businesses and consumers to obtain certified devices with reliable delivery and cost-efficient prices.
Founded in 1885 and located in Dallas, Texas, United States, AT&T enhances the secondary phone market with its trade-in services and certified pre-owned phone services. The company provides refurbished devices by collecting older devices through upgrade programs and partnering with specialized refurbishment service providers to restore them for resale. This activity helps to increase circular device usage along with providing affordable phones with network coverage and warranty protection.
Other key players in the market include Flipkart Internet Private Limited, Reboxed Limited, FoneGiant.com, Verizon, Kempf Enterprises Limited, and Nippon Telephone Inc., among others.
*Please note that this is only a partial list; the complete list of key players is available in the full report. Additionally, the list of key players can be customized to better suit your needs.*
Unlock the latest insights with our refurbished and used mobile phones market trends 2026 report. Discover regional growth patterns, consumer preferences, and key industry players. Stay ahead of competition with trusted data and expert analysis. Download your free sample report today and drive informed decisions in the market.


Upto 15% Off
USD
$2499 $2249
$3999 $3599
$4999 $4249
$5999 $5099


*While we strive to always give you current and accurate information, the numbers depicted on the website are indicative and may differ from the actual numbers in the main report. At Expert Market Research, we aim to bring you the latest insights and trends in the market. Using our analyses and forecasts, stakeholders can understand the market dynamics, navigate challenges, and capitalize on opportunities to make data-driven strategic decisions.*
At 2025, the market reached an approximate value of USD 66.54 Billion.
The market is projected to grow at a CAGR of 6.50% between 2026 and 2035.
The market is estimated to witness a healthy growth in the forecast period of 2026-2035 to reach USD 124.90 Billion by 2035.
Key strategies driving the market include forming OEM-logistics-tech alliances, investing in AI refurb chains, localising diagnostic hubs, embedding carbon analytics, and developing region-specific B2B bundles with compliance and ESG guarantees to scale trust and impact.
Key trends aiding market expansion include the rising costs of new smartphones, availability of refurbished and used mobile phones on online platforms, and reduction in feature-upgrades in new mobile phones.
The major regions in the market are North America, Europe, the Asia Pacific, Latin America, and the Middle East and Africa.
The market based on pricing range is segmented into low-priced, medium-priced, and premium.
The lifespan of a refurbished or used mobile phone depends upon multiple factors, such as the manufacturing date, durability, and condition of the mobile phone. Refurbished mobile phones may last longer as their quality has been checked and repairs made.
The primary distribution channels in the market are online and offline.
The key players include Apple Inc., Samsung Electronics Co. Ltd, Amazon.com, Inc., AT&T Inc., Flipkart Internet Private Limited, Reboxed Limited, FoneGiant.com, Verizon, Kempf Enterprises Limited, Nippon Telephone Inc., and Others.
The key challenges are inconsistent global regulations, lack of standardised grading systems, warranty management complexity, and limited consumer trust in used devices.
Explore our key highlights of the report and gain a concise overview of key findings, trends, and actionable insights that will empower your strategic decisions.
| REPORT FEATURES | DETAILS |
| Base Year | 2025 |
| Historical Period | 2019-2025 |
| Forecast Period | 2026-2035 |
| Scope of the Report |
Historical and Forecast Trends, Industry Drivers and Constraints, Historical and Forecast Market Analysis by Segment:
|
| Breakup by Type |
|
| Breakup by Pricing Range |
|
| Breakup by Distribution Channel |
|
| Breakup by Region |
|
| Market Dynamics |
|
| Competitive Landscape |
|
| Companies Covered |
|
Datasheet
One User
USD 2,499
USD 2,249
tax inclusive*
Single User License
One User
USD 3,999
USD 3,599
tax inclusive*
Five User License
Five User
USD 4,999
USD 4,249
tax inclusive*
Corporate License
Unlimited Users
USD 5,999
USD 5,099
tax inclusive*
*Please note that the prices mentioned below are starting prices for each bundle type. Kindly contact our team for further details.*
Flash Bundle
Small Business Bundle
Growth Bundle
Enterprise Bundle
*Please note that the prices mentioned below are starting prices for each bundle type. Kindly contact our team for further details.*
Flash Bundle
Number of Reports: 3
20%
tax inclusive*
Small Business Bundle
Number of Reports: 5
25%
tax inclusive*
Growth Bundle
Number of Reports: 8
30%
tax inclusive*
Enterprise Bundle
Number of Reports: 10
35%
tax inclusive*
How To Order

Select License Type
Choose the right license for your needs and access rights.

Click on ‘Buy Now’
Add the report to your cart with one click and proceed to register.

Select Mode of Payment
Choose a payment option for a secure checkout. You will be redirected accordingly.
Strategic Solutions for Informed Decision-Making
Gain insights to stay ahead and seize opportunities.

Get insights & trends for a competitive edge.

Track prices with detailed trend reports.

Analyse trade data for supply chain insights.

Leverage cost reports for smart savings

Enhance supply chain with partnerships.

Connect For More Information
Our expert team of analysts will offer full support and resolve any queries regarding the report, before and after the purchase.
Our expert team of analysts will offer full support and resolve any queries regarding the report, before and after the purchase.
We employ meticulous research methods, blending advanced analytics and expert insights to deliver accurate, actionable industry intelligence, staying ahead of competitors.
Our skilled analysts offer unparalleled competitive advantage with detailed insights on current and emerging markets, ensuring your strategic edge.
We offer an in-depth yet simplified presentation of industry insights and analysis to meet your specific requirements effectively.




