

Consumer Insights
Uncover trends and behaviors shaping consumer choices today
Procurement Insights
Optimize your sourcing strategy with key market data
Industry Stats
Stay ahead with the latest trends and market analysis.
The global retail analytics market reached a value of about USD 13.21 Billion in 2025. The industry is further expected to grow at a CAGR of about 23.70% in the forecast period of 2026-2035 to reach a value of around USD 110.82 Billion by 2035.
Compound Annual Growth Rate
23.7%
Value in USD Billion
2026-2035
Read more about this report - REQUEST FREE SAMPLE COPY IN PDF
| Global Retail Analytics Market Report Summary | Description | Value |
| Base Year | USD Billion | 2025 |
| Historical Period | USD Billion | 2019-2025 |
| Forecast Period | USD Billion | 2026-2035 |
| Market Size 2025 | USD Billion | 13.21 |
| Market Size 2035 | USD Billion | 110.82 |
| CAGR 2019-2025 | Percentage | XX% |
| CAGR 2026-2035 | Percentage | 23.70% |
| CAGR 2026-2035 - Market by Region | Asia Pacific | 27.3% |
| CAGR 2026-2035 - Market by Country | India | 29.8% |
| CAGR 2026-2035 - Market by Country | China | 26.2% |
| CAGR 2026-2035 - Market by Solution | Software | 26.1% |
| CAGR 2026-2035 - Market by Function | Customer Management | 27.0% |
| Market Share by Country 2025 | UK | 3.3% |
Retail analytics is the intelligence solution that focuses on providing analytical modelling on various crucial processes in the retail industry. It aids in the decision-making process of the retailers by providing consumer insights and scope of product marketing and procurement. The increase in the number of social media users enables retailers to understand the demographic data and design their promotional and market growth strategies.
The increasing adoption of digitalisation, online shopping, and the proliferation of smartphones are major factors driving the retail analytics market expansion. The rise of e-commerce and social commerce has led to the generation of vast amounts of customer data, which retailers are leveraging to gain meaningful business insights and improve their operations. Retailers are increasingly adopting advanced technologies like artificial intelligence, machine learning, and big data analytics to extract insights, automate decision-making, enhance customer experiences, and optimise inventory and supply chain management. Additionally, the growing focus on improving customer relationships through personalised marketing, loyalty programs, and targeted promotions is further propelling the demand for retail analytics solutions.
Adoption of AI and ML in retail analytics, focus on shelf space allocation, and shift towards data-driven decision making have resulted in retail analytics market development
The Estée Lauder Companies (ELC) and Microsoft are expanding their global strategic relationship by creating an AI Innovation Lab. Microsoft's generative AI tools and expertise will help ELC leverage its data to create more personalised experiences, faster insights, and better consumer connections.
Oracle Corporation Japan plans to invest over USD 8 billion in cloud computing and AI infrastructure in Japan over the next decade. This strategic move underscores Oracle's commitment to meeting the evolving demands of the Japanese market and strengthening its position in cloud computing services.
IBM and SAP partnered to create innovative AI solutions for the FMCG and retail industries, focusing on supply chain, finance, sales, and services enhancements using generative AI. This collaboration integrates IBM WatsonX and AI assistants into SAP solutions for product portfolio management.
IBM collaborated with AWS to introduce a new cloud database offering, merging IBM Db2 database with Amazon RDS. This collaboration aims to assist businesses in managing data with flexibility, security, and scalability to optimise data management for AI workloads.
By using AI and ML, retailers can analyse the vast amounts of data generated by them. This integration enables retailers to gain deeper insights into customer behaviour, optimise operations, personalise marketing campaigns, and enhance the overall customer experience.
Retail analytics tools are being utilised to ensure that products are placed strategically, in the right quantity, and at the right location to meet customer demand effectively. This trend aids retailers in minimising inventory costs, reducing out-of-stock situations, and optimising store layouts.
The adoption of Industry 4.0 technologies, such as Internet of Things (IoT) and automation, in the retail sector is a notable trend shaping the global retail analytics market outlook. A leading retailer, IKEA, has implemented IoT-enabled smart shelves to monitor inventory levels and optimise stock replenishment in its stores.
Retailers are increasingly leveraging retail analytics to create personalised marketing campaigns based on customer preferences and behaviour patterns. A popular e-commerce platform, Amazon, uses AI-powered algorithms to offer product recommendations to its customers based on their purchasing history.
Trends like efficient inventory management and shelf space allocation contribute to better profit margins and enhanced customer satisfaction. A leading fashion retailer, Zara, uses data analytics to optimise its inventory levels and shelf space allocation, allowing it to quickly respond to changing fashion trends.
The adoption of AI and ML in retail analytics is expected to drive retail analytics market growth by improving decision-making processes and operational efficiency. Walmart, a leading retail giant, has successfully implemented AI-powered chatbots to improve customer service and reduce wait times in its stores. Similarly, Target, another prominent retailer, has leveraged AI-driven analytics to optimise its inventory management and reduce stockouts.
Moreover, by utilising data analytics, retailers can identify customers interested in specific products, tailor marketing strategies accordingly, and enhance customer engagement. A leading beauty retailer, Sephora, uses data analytics to create personalised product recommendations and loyalty programs, resulting in increased customer loyalty and sales.
Read more about this report - REQUEST FREE SAMPLE COPY IN PDF
The EMR’s report titled “Retail Analytics Market Report and Forecast 2026-2035” offers a detailed analysis of the market based on the following segments:
Market Breakup by Solution
Market Breakup by Deployment Mode
Market Breakup by Function
Market Breakup by Region
Cloud models are high in demand due to its capacity of storing large amount of data and records
Cloud deployment models simplify scalability, allowing businesses to quickly increase the number of servers they use, thereby enhancing future growth and simplifying data organisation, cleanup, and analysis. The availability of cloud solutions for mass users is likely to create significant opportunities for retail analytics market growth, especially in regions where cloud adoption is on the rise.
In contrast, on-premises solutions offer organisations more flexibility and control over customising their IT infrastructure, reducing dependency on the internet, and safeguarding critical company data from theft and fraud. This solution is preferred by organisations in the BFSI industry due to increased concerns about frauds like new account fraud and account takeovers, as on-premises solutions are less vulnerable to such frauds.
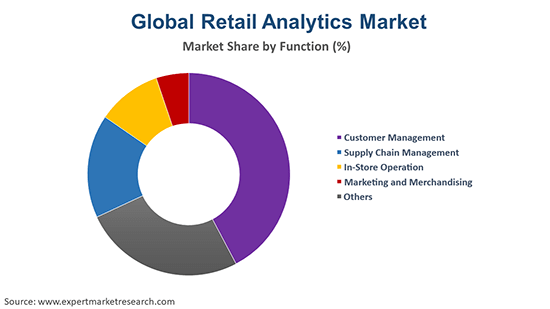
Customer management segment leads the market as retail analytics help determine customer preferences and enhance revenue
Customer management is expected to capture the maximum share in retail analytics market as retailers are increasingly implementing analytical tools to understand customer preferences and market trends, which is a key to driving sales and revenue. Such software helps measure customer loyalty, identify purchasing patterns, forecast demand, and optimise store layouts.
Retailers are using data analytics in supply chain management to examine the efficiency of marketing campaigns, better manage inventories, and enhance customer service. Analytical platforms offer meaningful insights and interactive dashboards, which can help retailers improve on-ground fleet management and logistics through route and network optimisation.
| CAGR 2026-2035 - Market by | Country |
| India | 29.8% |
| China | 26.2% |
| UK | 21.7% |
| USA | 21.1% |
| Germany | 19.5% |
| Canada | XX% |
| France | XX% |
| Italy | XX% |
| Japan | 16.3% |
| Australia | XX% |
| Saudi Arabia | XX% |
| Brazil | XX% |
| Mexico | XX% |
Market players are focused on expanding their market presence through partnerships and are investing in the development of innovative retail analytics solutions to gain a competitive edge
SAP SE, founded in 1972 and headquartered in Baden-Württemberg, Germany, is a multinational enterprise software company. SAP offers cloud-based retail analytics tools, which enable retailers to manage their operations, inventory, and customer relationships more effectively.
Oracle Corporation, founded in 1977 and headquartered in Texas, United States, is a leading provider of database software and enterprise software solutions. Its offerings help retailers optimise their pricing strategies and improve inventory management through personalised marketing campaigns.
Microsoft Corporation, founded in 1975 and headquartered in Washington, United States, is known for its software, consumer electronics, and personal computers. Microsoft's retail analytics solutions, integrated with its cloud computing platform, Azure, enable retailers to leverage data-driven insights to improve decision-making.
MicroStrategy Incorporated was founded in 1989. The company is headquartered in Virginia, United States. The company provides business intelligence (BI), mobile software, and cloud-based services, including artificial intelligence-powered enterprise analytics software and services.
*Please note that this is only a partial list; the complete list of key players is available in the full report. Additionally, the list of key players can be customized to better suit your needs.*
Other key players in the global retail analytics market include QlikTech International A.B., RetailNext, Inc., Solvoyo, Altair Engineering Inc., SAS Institute Inc., and Teledyne Flir LLC, among others.


Read more about this report - REQUEST FREE SAMPLE COPY IN PDF
North America to significantly boost the market growth due to its extensive deployment of cloud-based data analytics
The North American region accounts for a major share in the market owing to the large investments made by huge enterprises to deploy advanced technologies and gain a competitive edge in the market. The early adoption of analytical and cloud-based solutions by large enterprises across the region has significantly contributed to the industry growth.
The Asia Pacific region is experiencing significant growth in the retail analytics market share, driven by the rise in the penetration of social media, growth in e-commerce, and the presence of developing and emerging economies offering substantial opportunities for retail stores and technology advancement. The region’s growth is further fuelled by the increasing demand for retail analytics in inventory management, strategic planning, and customer behavior analysis.
Upto 15% Off
USD
$3999 $3599
$2499 $2249
$4999 $4249
$5999 $5099


*While we strive to always give you current and accurate information, the numbers depicted on the website are indicative and may differ from the actual numbers in the main report. At Expert Market Research, we aim to bring you the latest insights and trends in the market. Using our analyses and forecasts, stakeholders can understand the market dynamics, navigate challenges, and capitalize on opportunities to make data-driven strategic decisions.*
In 2025, the retail analytics market reached an approximate value of USD 13.21 Billion.
The market is expected to grow at a CAGR of 23.70% between 2026 and 2035.
The market is estimated to witness a healthy growth in the forecast period of 2026-2035 to USD 110.82 Billion by 2035.
The growing adoption of innovative and advanced technologies by retailers to leverage consumer insights and store huge data volumes is a major driver of the market.
The key trends in the market are growing penetration of internet and the increasing adoption of cloud-based services.
Regions considered in the market are North America, Europe, the Asia Pacific, Latin America, and the Middle East and Africa.
The different solutions of retail analytics are software and service.
The various segments based on function considered in the market report are customer management, supply chain management, in-store operation, and marketing and merchandising, among others.
Key players in the market are MicroStrategy Incorporated, SAP SE, Oracle Corp, Microsoft Corporation, QlikTech International A.B., RetailNext, Inc., Solvoyo, Altair Engineering Inc., SAS Institute Inc., and Teledyne Flir LLC, among others.
Explore our key highlights of the report and gain a concise overview of key findings, trends, and actionable insights that will empower your strategic decisions.
| REPORT FEATURES | DETAILS |
| Base Year | 2025 |
| Historical Period | 2019-2025 |
| Forecast Period | 2026-2035 |
| Scope of the Report |
Historical and Forecast Trends, Industry Drivers and Constraints, Historical and Forecast Market Analysis by Segment:
|
| Breakup by Solution |
|
| Breakup by Deployment Mode |
|
| Breakup by Function |
|
| Breakup by Region |
|
| Market Dynamics |
|
| Competitive Landscape |
|
| Companies Covered |
|
| Report Price and Purchase Option | Explore our purchase options that are best suited to your resources and industry needs. |
| Delivery Format | Delivered as an attached PDF and Excel through email, with an option of receiving an editable PPT, according to the purchase option. |
Single User License
One User
USD 3,999
USD 3,599
tax inclusive*
Datasheet
One User
USD 2,499
USD 2,249
tax inclusive*
Five User License
Five User
USD 4,999
USD 4,249
tax inclusive*
Corporate License
Unlimited Users
USD 5,999
USD 5,099
tax inclusive*
*Please note that the prices mentioned below are starting prices for each bundle type. Kindly contact our team for further details.*
Flash Bundle
Small Business Bundle
Growth Bundle
Enterprise Bundle
*Please note that the prices mentioned below are starting prices for each bundle type. Kindly contact our team for further details.*
Flash Bundle
Number of Reports: 3
20%
tax inclusive*
Small Business Bundle
Number of Reports: 5
25%
tax inclusive*
Growth Bundle
Number of Reports: 8
30%
tax inclusive*
Enterprise Bundle
Number of Reports: 10
35%
tax inclusive*
How To Order

Select License Type
Choose the right license for your needs and access rights.

Click on ‘Buy Now’
Add the report to your cart with one click and proceed to register.

Select Mode of Payment
Choose a payment option for a secure checkout. You will be redirected accordingly.
Strategic Solutions for Informed Decision-Making
Gain insights to stay ahead and seize opportunities.

Get insights & trends for a competitive edge.

Track prices with detailed trend reports.

Analyse trade data for supply chain insights.

Leverage cost reports for smart savings

Enhance supply chain with partnerships.

Connect For More Information
Our expert team of analysts will offer full support and resolve any queries regarding the report, before and after the purchase.
Our expert team of analysts will offer full support and resolve any queries regarding the report, before and after the purchase.
We employ meticulous research methods, blending advanced analytics and expert insights to deliver accurate, actionable industry intelligence, staying ahead of competitors.
Our skilled analysts offer unparalleled competitive advantage with detailed insights on current and emerging markets, ensuring your strategic edge.
We offer an in-depth yet simplified presentation of industry insights and analysis to meet your specific requirements effectively.


