

Consumer Insights
Uncover trends and behaviors shaping consumer choices today
Procurement Insights
Optimize your sourcing strategy with key market data
Industry Stats
Stay ahead with the latest trends and market analysis.
The global rough ruby market was valued at USD 1.59 Billion in 2025. The market is expected to grow at a CAGR of 5.00% during the forecast period of 2026–2035 to reach a value of USD 2.59 Billion by 2035. Growing demand for colored gemstones, increasing luxury jewelry consumption, and rising investments in precious stones are driving the overall growth in the market.
Compound Annual Growth Rate
5%
Value in USD Billion
2026-2035
Read more about this report - REQUEST FREE SAMPLE COPY IN PDF
The global rough ruby market is defined by finite geological supply, a concentration of premium production in Mozambique, and an auction-led price discovery system that sets the reference benchmarks for documented stones. Recent activity has centred on Gemfields' periodic Montepuez auctions, the commissioning of a second processing plant, and a broader coloured-gemstone demand softening, even as fine-quality material continues to command resilient pricing.
In February 2026, Gemfields generated USD 53 million from a Mozambique rough ruby auction, the first to include output from Montepuez Ruby Mining's second processing plant, with fine and fluorescent material drawing strong demand and 121 of 135 lots sold.
In January 2026, Gemfields reported full-year 2025 auction revenue of USD 129 million, down 34% from USD 196 million in 2024, reflecting a broad coloured-gemstone slowdown while its second Montepuez ruby processing plant neared final commissioning.
In October 2025, Gemfields raised USD 11 million from a Bangkok rough ruby mini-auction at an average of USD 59.43 per carat, then deferred its year-end sale to early 2026 as illegal mining disrupted Montepuez plant commissioning.
In June 2025, Gemfields' rough ruby auction in Mozambique realised USD 31.7 million, down from USD 68.7 million in June 2024, signalling softer premium demand even as fine-quality Montepuez material continued to command resilient per-carat pricing worldwide.
Gemfields' Montepuez operation has produced repeated record auction results, proving the deposit yields vivid-red rubies rivalling Burmese material. Myanmar sanctions since the 2021 coup redirect documented premium demand toward Mozambican stones, reinforcing Africa's structural role in global rough ruby supply.
Source-mine, chain-of-custody, and heat-treatment documentation has shifted from voluntary practice to commercial requirement. Jewellery houses and institutional collectors demand traceability, so undocumented stones face discount pressure, while Responsible Jewellery Council certification underpins global rough ruby market growth across premium segments.
High-net-worth individuals, family offices, and wealth managers increasingly treat rubies as portable, dense-value alternative assets. Auction results from exceptional stones provide the price-discovery evidence advisers use, expanding the addressable buyer base for the finest rough ruby material beyond traditional channels.
Consumer markets for crystal healing and astrology products create a new demand layer that was negligible in earlier periods. These buyers favour sub-8-carat stones, prioritising colour and size over gemological grade, absorbing commercial-quality material without competing for premium investment stones.
India imported 27,698 ruby shipments in 2023, the world's highest, feeding Jaipur and Surat cutting houses that export USD 12.9 billion in precious stones. Thailand's Chanthaburi and Kanchanaburi dominate heat treatment, anchoring Asia Pacific's processing leadership across the supply chain.
The report by Expert Market Research, titled “Global Rough Ruby Market Report and Forecast 2026-2035”, offers a detailed analysis of the market based on the following segments:
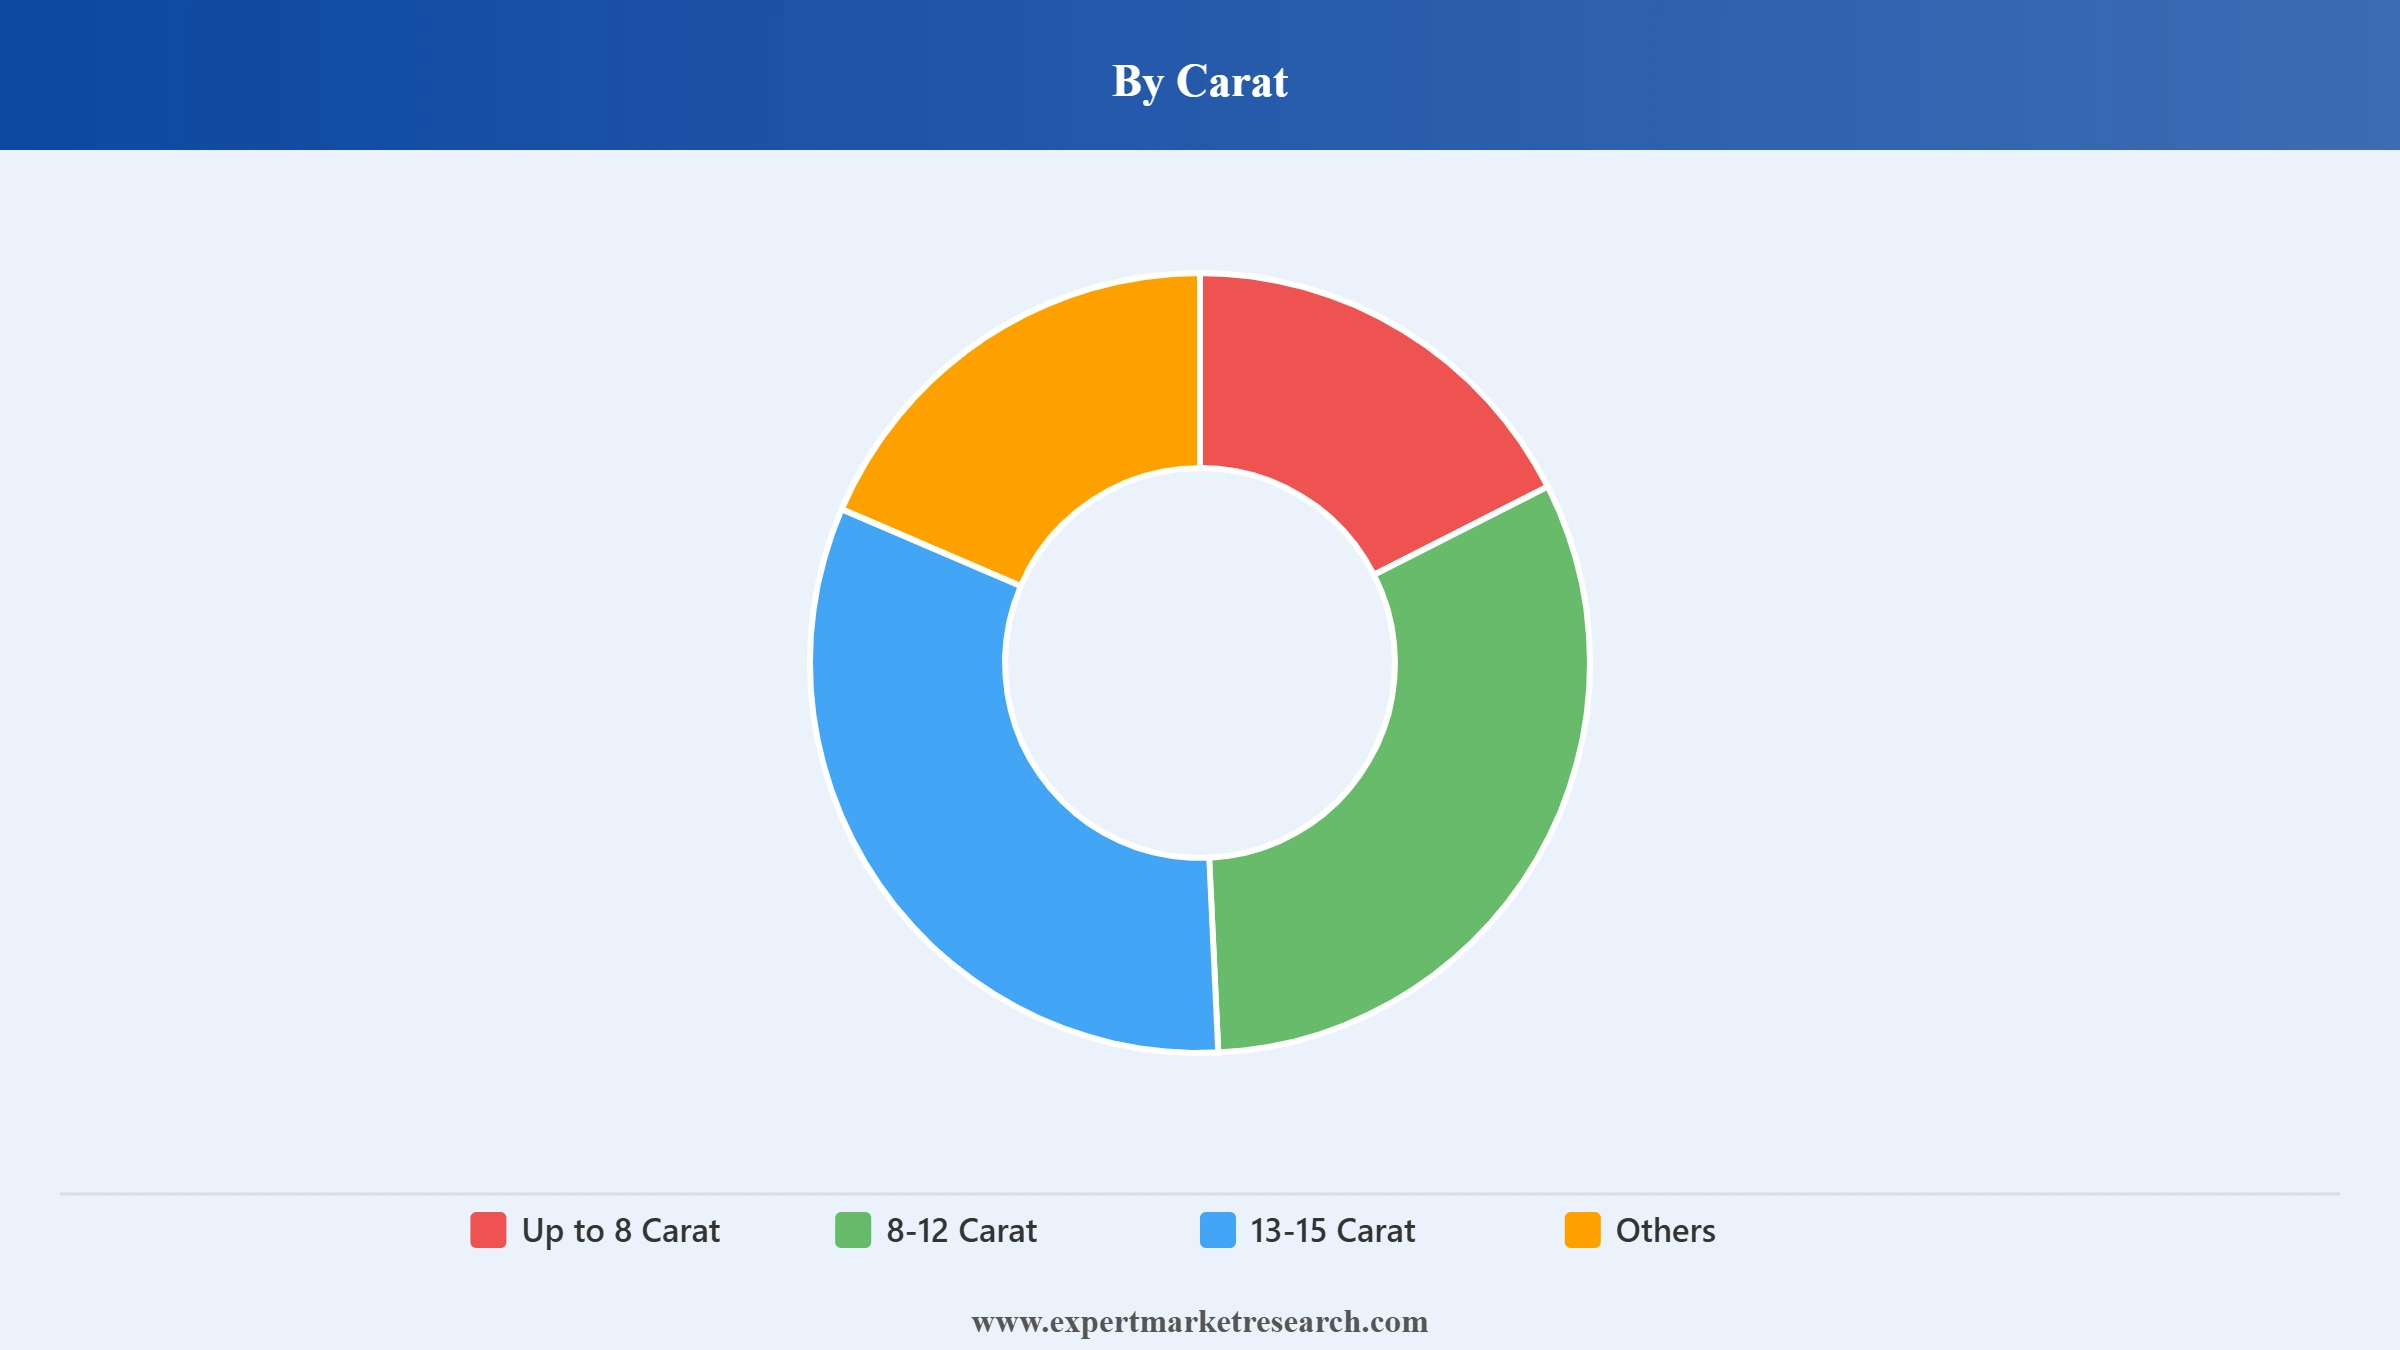
Market Breakup by Carat
Key Insight: The Up to 8 Carat tier is the highest-volume segment, serving commercial jewellers and fast-growing crystal-healing and astrology buyers, where price accessibility matters more than exceptional quality. The 8-12 Carat segment is where provenance documentation and heat-treatment status carry significant commercial weight. The 13-15 Carat segment is rare enough that stones are tracked, with premiums reaching USD 100,000 or more per carat, while the Others category above 15 carats includes market-defining specimens such as the Estrela de Fura.
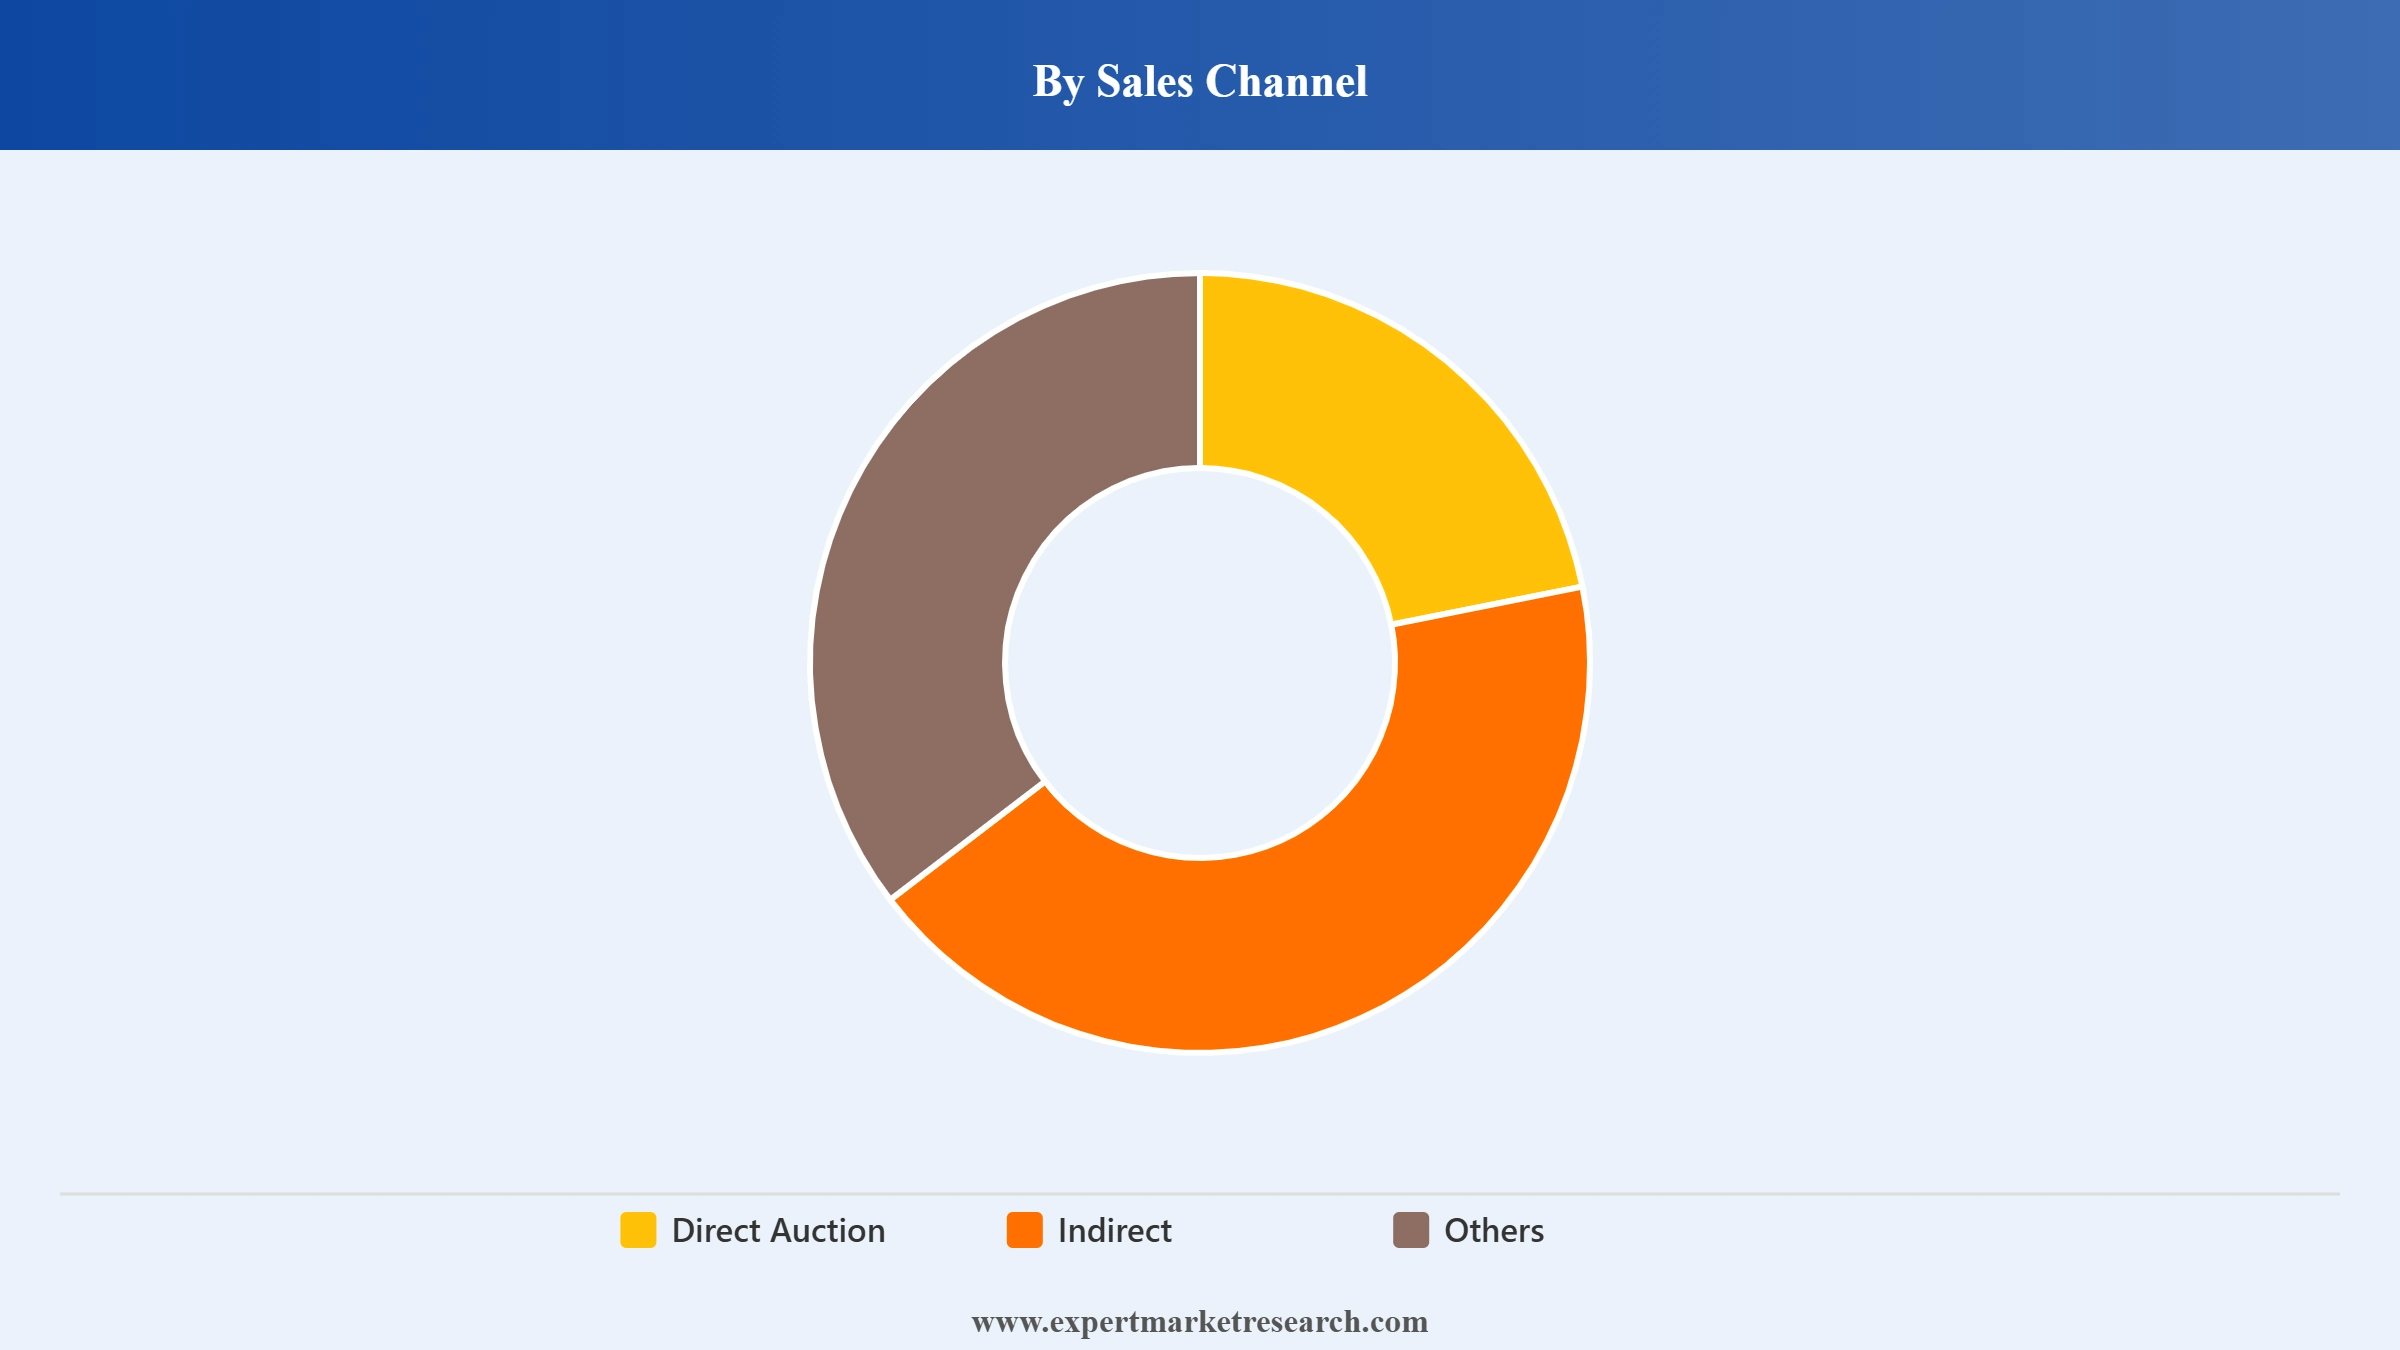
Market Breakup by Sales Channel
Key Insight: Direct Auction is the premium price-discovery mechanism, used by Gemfields for its periodic Mozambique production sales and by Sotheby's and Christie's for exceptional stones, consistently achieving higher realised prices than private treaty for well-documented material. The Indirect channel handles the majority of transaction volume through gem traders, wholesalers, and dealer networks that connect mine-level supply with the cutting and polishing industries of India and Thailand and with international jewellery manufacturers.
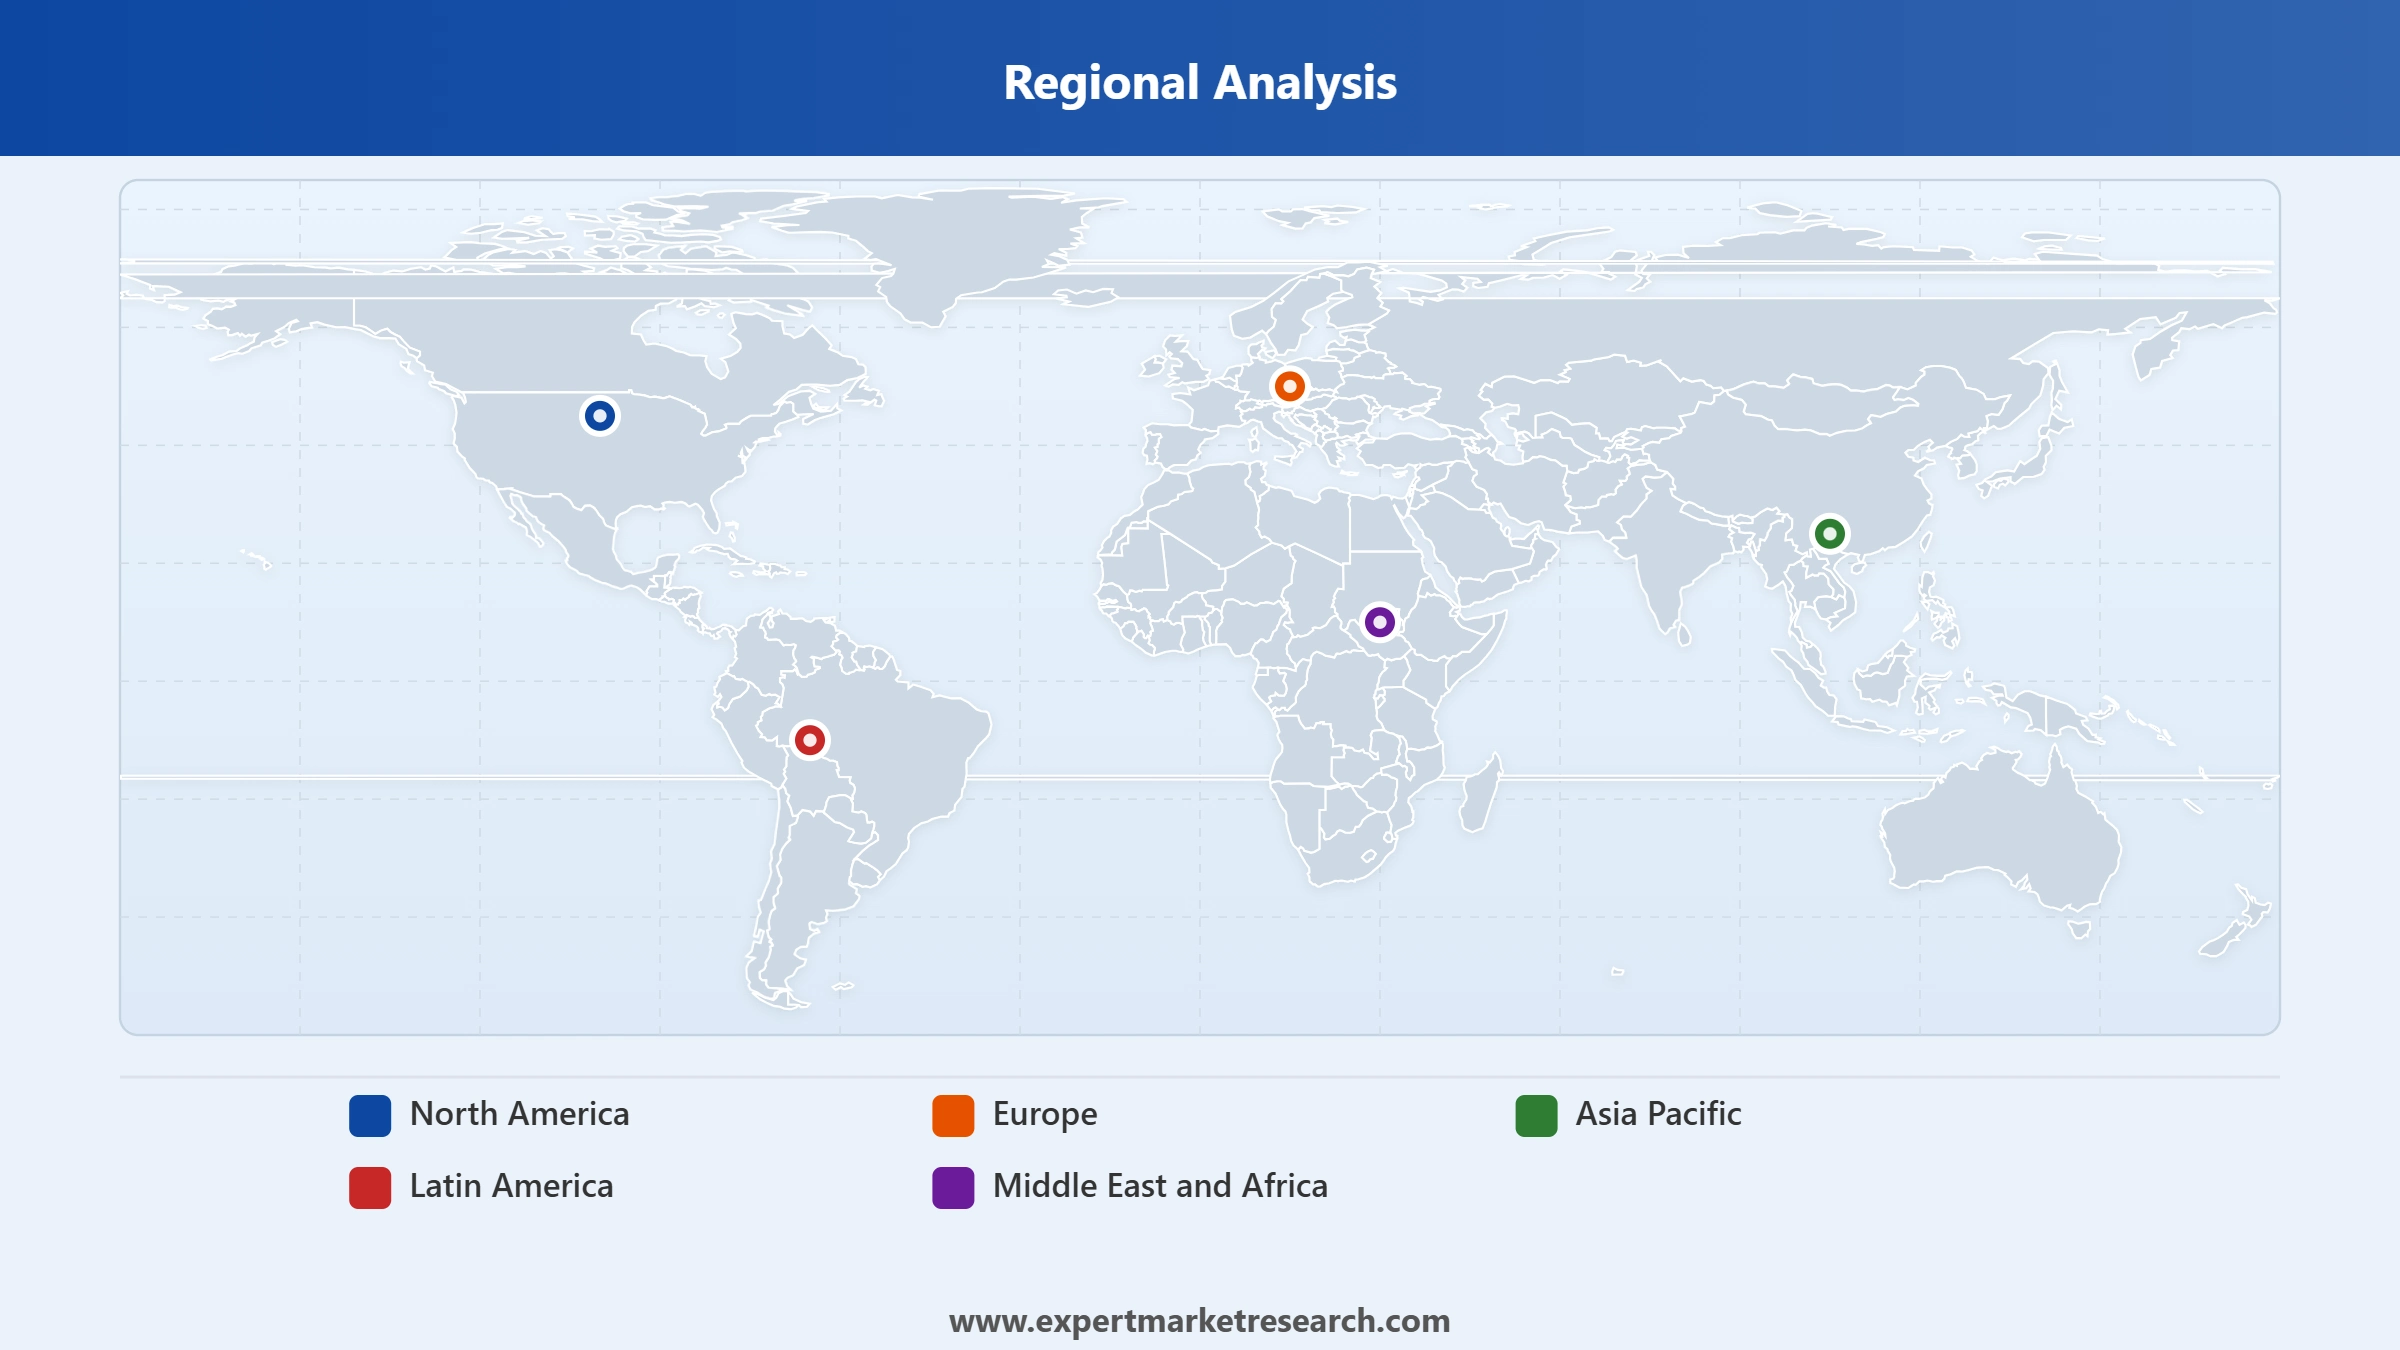
Market Breakup by Region
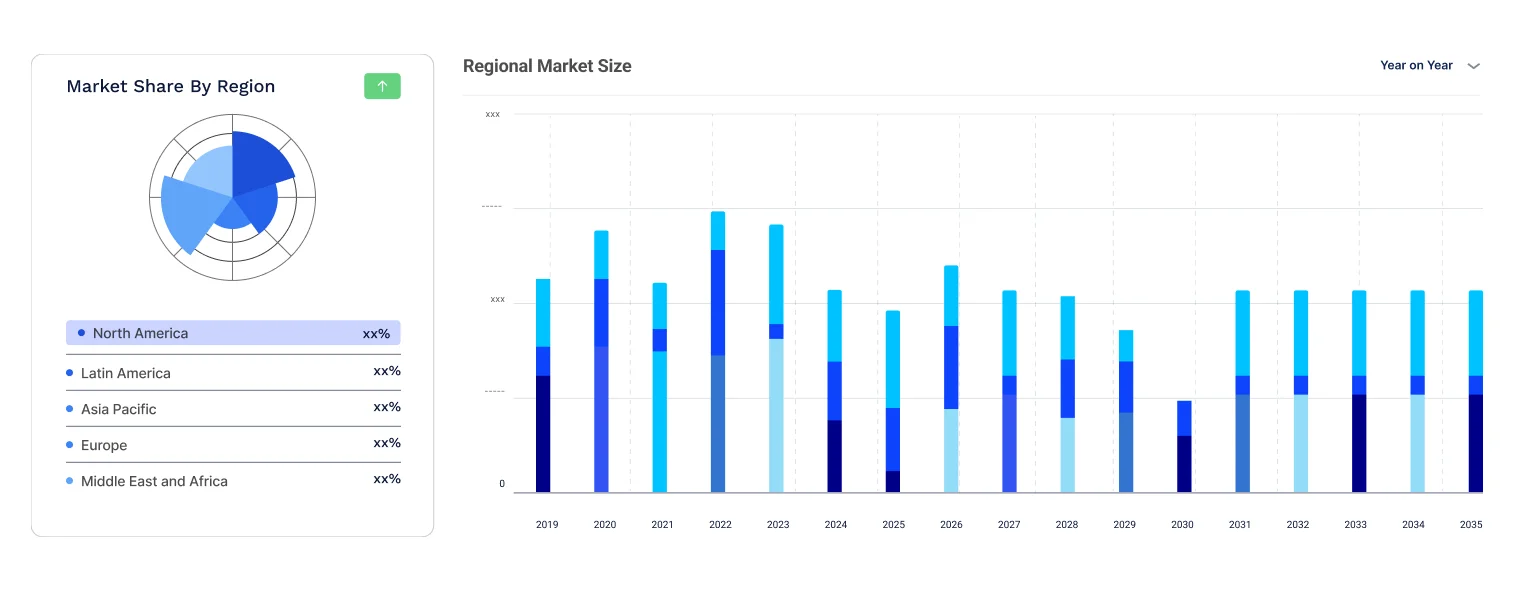
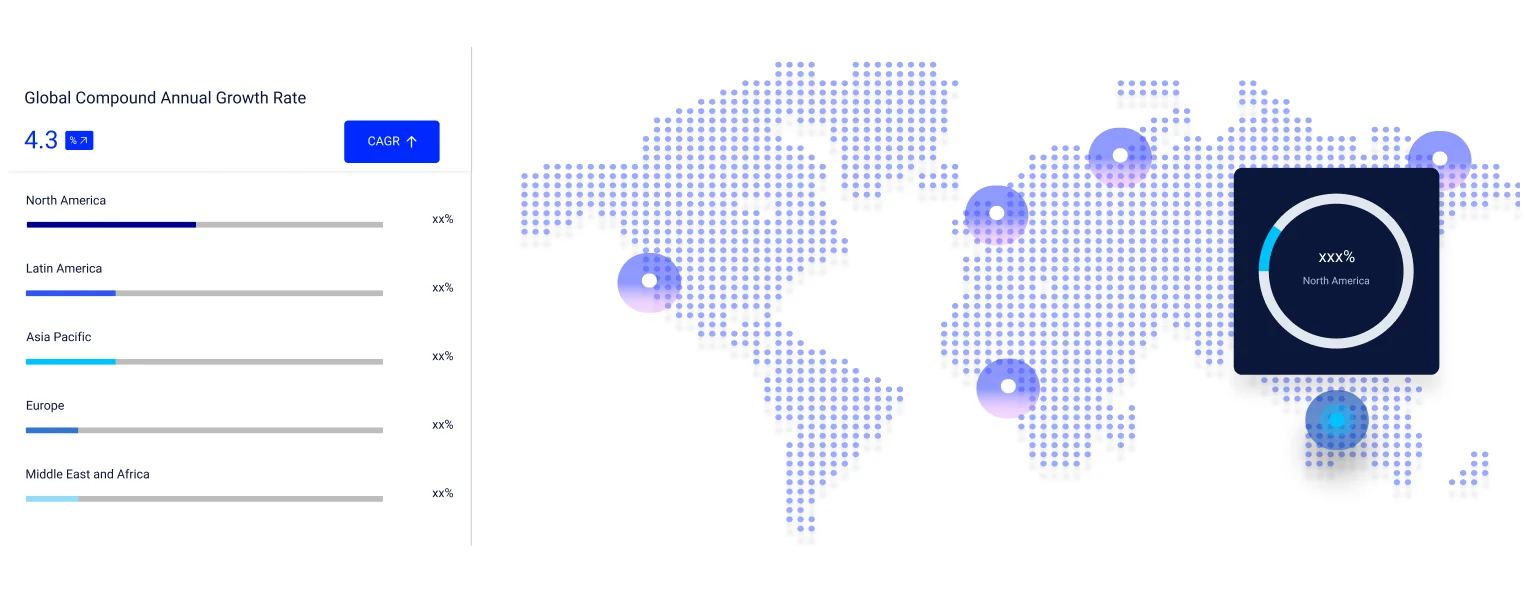
Key Insight: Asia Pacific dominates rough ruby import volume, with India leading globally at 27,698 shipments in 2023. North America is the most important consumer market by auction value, with Sotheby's and Christie's New York achieving multiple records. Europe's jewellery trade sustains significant buyer activity through London and Geneva. Middle East and Africa is the highest-growth region, encompassing Mozambique and Tanzania as primary producers and the UAE as the emerging gemstone exhibition and trading hub.
Read more about this report - REQUEST FREE SAMPLE COPY IN PDF
By carat, the Up to 8 Carat tier dominates by transaction volume while larger stones carry disproportionate value
The Up to 8 Carat segment holds the dominant share of global rough ruby transaction volume, reflecting the broad commercial-jeweller and specialist-collector buyer population at this accessible size and price range. Its high transaction count sustains the market's operational infrastructure of dealers, traders, and cutting houses. The crystal-healing and astrology buyer base reinforces this volume layer, absorbing commercial-quality rough material at accessible price points without competing for premium stones.
Read more about this report - REQUEST FREE SAMPLE COPY IN PDF
The 8-12 Carat segment holds the second-largest share by value, as individual stone transaction values are materially higher and documentation premiums become commercially significant. The 13-15 Carat and larger segments hold a small share by transaction count but a disproportionate share by value per stone. This architecture, spanning a fine-quality benchmark near USD 1,000 per carat up to roughly USD 630,000 per carat for exceptional specimens, is unique among global commodity markets and reflects ruby's scarcity and quality premium.
By sales channel, the indirect channel leads by volume while direct auction holds a disproportionate value share
The Indirect channel holds the dominant share of rough ruby transactions by volume, connecting the broad supply of commercial rough material from Africa and Asia with the cutting and jewellery-manufacturing industries concentrated in India and Thailand. Gem traders, wholesalers, and dealer networks provide liquidity, hold inventory across market cycles, and give buyers multi-origin access without requiring direct mine relationships, making this channel the operational backbone of everyday rough ruby commerce.
Read more about this report - REQUEST FREE SAMPLE COPY IN PDF
Direct Auction holds a smaller transaction share but a disproportionate value share, as exceptional specimens transacted through auction consistently achieve the market's highest per-carat prices. The channel's value share is growing as Gemfields expands its periodic production-sales model and investment buyers increase auction participation. In February 2026, Gemfields generated USD 53 million from a single Mozambique rough ruby auction, illustrating the channel's outsized contribution to value despite limited volume.
Asia Pacific is the rough ruby market's dominant import and processing hub.
Asia Pacific dominates rough ruby market with India's 27,698 shipments in 2023 make it the world's largest rough ruby importer, reflecting the scale of Jaipur's and Surat's cutting and polishing industries, which export around USD 12.9 billion in precious stones annually. Thailand's Chanthaburi and Kanchanaburi serve as the primary heat-treatment and trading centres, while Japan and China are important finished-gem consumer markets with growing investment-buyer communities across the region.
Read more about this report - REQUEST FREE SAMPLE COPY IN PDF
The Middle East and Africa contains both the primary new-supply story and the emerging-infrastructure story for the forecast period. Mozambique's Montepuez Ruby Mining operation delivers consistent, auction-validated production, Tanzania's Winza deposit produced the Burj Alhamal, and Kenya's ruby sector is developing as a secondary African source. The UAE has established Dubai as a premier gemstone exhibition venue. In February 2026, Gemfields' USD 53 million Mozambique auction underscored the region's central role in global rough ruby supply.
The rough ruby competitive landscape is a small universe of high-barrier operators concentrated at the mine-operator tier. Gemfields holds the structural advantage of controlling the market's most documented and auction-validated premium supply source, while the trading and auction tier has more participants but requires deep sourcing relationships and buyer-network access that take years to build.
Lab-grown ruby competition is growing in the commercial mid-market tier but has not penetrated the natural premium market, where documented provenance and natural origin remain the product's defining value. Supply-side competition among Mozambican miners continues to improve overall auction price discovery.
Gemfields is the benchmark operator in documented, ethically-sourced African coloured gemstones. Its Montepuez Ruby Mining operation in Mozambique, in which it holds a 75% interest, is the market's most commercially significant production asset and pioneered the periodic auction model that the industry uses as a price-discovery reference, supported by Responsible Jewellery Council certification.
Gem Bridge operates in the rough gemstone trading tier, connecting mine-level supply with international buyers across the jewellery, collector, and investment markets. Trading companies at this level provide market liquidity, maintain inventory across cycles, and give buyers multi-origin access without direct mine relationships, competing on sourcing relationships, quality-assessment expertise, and international buyer-network reach.
Mwriti Limitada operates in the Mozambican ruby mining sector and holds a 25% interest in the Montepuez Ruby Mining operation alongside Gemfields. As a partner in one of the world's most commercially significant ruby-producing geographies, it benefits from the internationally validated quality and the premium reputation that Mozambican origin now commands in the global rough ruby market.
FURA Gems discovered and promoted the 101-carat Mozambique rough ruby that yielded the Estrela de Fura. Its Dubai showcase strategy ahead of the Sotheby's New York auction demonstrated sophistication in building international buyer competition before public sale, positioning the company as a premium, transparency-focused Mozambican miner competing with Gemfields for the documented fine-ruby buyer community.
Other key players in the market are Gem Rock, and Others.
*Please note that this is only a partial list; the complete list of key players is available in the full report. Additionally, the list of key players can be customized to better suit your needs.*
Gain a complete picture of the global rough ruby market with our forecast report for 2026-2035. Whether you are a mining company evaluating African ruby development, a jewellery house assessing ethical supply chains, an auction house tracking price dynamics, or an investor weighing gemstones as an alternative asset, this report delivers the geological supply analysis, trade-flow intelligence, and competitive depth you need. Download your free sample today.


Upto 15% Off
USD
$2499 $2249
$3999 $3599
$4999 $4249
$5999 $5099


*While we strive to always give you current and accurate information, the numbers depicted on the website are indicative and may differ from the actual numbers in the main report. At Expert Market Research, we aim to bring you the latest insights and trends in the market. Using our analyses and forecasts, stakeholders can understand the market dynamics, navigate challenges, and capitalize on opportunities to make data-driven strategic decisions.*
The market is projected to grow at a CAGR of 5.00% between 2026 and 2035.
The major drivers of the market include the rising demand for jewellery and decorations featuring rubies and rising consumer disposable incomes.
The popularity of ruby stone in crystal healing, rising consumer belief in astrology, and growing demand of rough rubies in gemstone collections are the key trends propelling the growth of the market.
Regions considered in the market are North America, Europe, the Asia Pacific, Latin America, and the Middle East and Africa.
The value of a raw ruby depends upon the clarity and carat, with raw rubies of fine quality estimated to be worth USD 1,000 per carat.
The hue of the finest rubies ranges from bright, pure red to slightly purplish red. In most marketplaces, rubies with only red overtones sell for less money than those with orange and purple undertones.
Rubbing a rough ruby across a hard yet smooth surface such as glass can be an indication of authenticity as real rough rubies would not leave colour behind, whereas imitations may leave a colour residue.
Based on carat, the market can be segmented into up to 8 carat, 8-12 carat, and 13-15 carat, among others.
Based on sales channel, the market is segmented into direct auction and indirect, among others.
The key players include Gemfield Plc, Gem Bridge, Mwriti Limitada, FURA Gems, Gem Rock, and Others.
Asia Pacific dominates as the primary import and processing region with India leading global ruby imports at 27,698 shipments in 2023. Middle East and Africa is the highest-growth region as Mozambique and Tanzania supply development accelerates and the UAE establishes itself as a premium gemstone exhibition hub.
In 2025, the rough ruby market reached an approximate value of USD 1.59 Billion.
The market is expected to witness sustained growth and reach a value of USD 2.59 Billion by 2035.
Explore our key highlights of the report and gain a concise overview of key findings, trends, and actionable insights that will empower your strategic decisions.
| REPORT FEATURES | DETAILS |
| Base Year | 2025 |
| Historical Period | 2019-2025 |
| Forecast Period | 2026-2035 |
| Scope of the Report |
Historical and Forecast Trends, Industry Drivers and Constraints, Historical and Forecast Market Analysis by Segment:
|
| Breakup by Carat |
|
| Breakup by Sales Channel |
|
| Breakup by Region |
|
| Market Dynamics |
|
| Competitive Landscape |
|
| Companies Covered |
|
Datasheet
One User
USD 2,499
USD 2,249
tax inclusive*
Single User License
One User
USD 3,999
USD 3,599
tax inclusive*
Five User License
Five User
USD 4,999
USD 4,249
tax inclusive*
Corporate License
Unlimited Users
USD 5,999
USD 5,099
tax inclusive*
*Please note that the prices mentioned below are starting prices for each bundle type. Kindly contact our team for further details.*
Flash Bundle
Small Business Bundle
Growth Bundle
Enterprise Bundle
*Please note that the prices mentioned below are starting prices for each bundle type. Kindly contact our team for further details.*
Flash Bundle
Number of Reports: 3
20%
tax inclusive*
Small Business Bundle
Number of Reports: 5
25%
tax inclusive*
Growth Bundle
Number of Reports: 8
30%
tax inclusive*
Enterprise Bundle
Number of Reports: 10
35%
tax inclusive*
How To Order

Select License Type
Choose the right license for your needs and access rights.

Click on ‘Buy Now’
Add the report to your cart with one click and proceed to register.

Select Mode of Payment
Choose a payment option for a secure checkout. You will be redirected accordingly.
Strategic Solutions for Informed Decision-Making
Gain insights to stay ahead and seize opportunities.

Get insights & trends for a competitive edge.

Track prices with detailed trend reports.

Analyse trade data for supply chain insights.

Leverage cost reports for smart savings

Enhance supply chain with partnerships.

Connect For More Information
Our expert team of analysts will offer full support and resolve any queries regarding the report, before and after the purchase.
Our expert team of analysts will offer full support and resolve any queries regarding the report, before and after the purchase.
We employ meticulous research methods, blending advanced analytics and expert insights to deliver accurate, actionable industry intelligence, staying ahead of competitors.
Our skilled analysts offer unparalleled competitive advantage with detailed insights on current and emerging markets, ensuring your strategic edge.
We offer an in-depth yet simplified presentation of industry insights and analysis to meet your specific requirements effectively.




