

Consumer Insights
Uncover trends and behaviors shaping consumer choices today
Procurement Insights
Optimize your sourcing strategy with key market data
Industry Stats
Stay ahead with the latest trends and market analysis.


The Saudi Arabia silica sand market attained a volume of 757.87 KMT in 2025. The market is estimated to grow at a CAGR of 6.30% during 2026-2035. The growth of the construction, glass, and foundry industries is aiding the market to attain a volume of 1396.13 KMT by 2035.
Compound Annual Growth Rate
6.3%
Value in KMT
2026-2035
Read more about this report - REQUEST FREE SAMPLE COPY IN PDF
Silica sand contains 95% SiO2 and less than 0.6% iron oxide. Its high melting point, exceptional chemical stability, and low thermal expansion make it an ideal material for high-quality glass production. In November 2023, Zoujaj Glass received approval from its board of directors to set up a sixth line for glass container production at its facility in Riyadh, Saudi Arabia. The facility is projected to increase the plant’s annual capacity by approximately 25,000 MT.
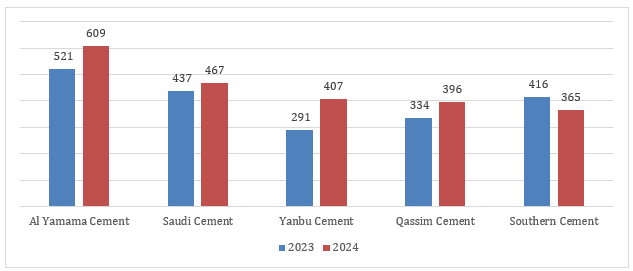
Figure: Domestic Cement Sales (Thousand Tons) of Leading Producers in Saudi Arabia, 2023-24
In glass manufacturing, silica sand is used as the primary source of silicon dioxide. It accounts for about 12-14% of the total batch cost in glass manufacturing. Key glass manufacturers in Saudi Arabia include Saudi Arabian Glass Co. Ltd., Safa Taiba Glass Factory Company, and Alsaeed Glass Company Factory.
Silica sand is used as a filler material and in the production of cement, mortars, and asphalt mixtures in the construction sector. The development of ongoing mega projects like the USD 500 billion Neom, USD 23.6 billion Red Sea Global, and USD 9.8 billion Qiddiya, influence the Saudi Arabia silica sand market dynamics and trends.
In the construction sector, silica sand is used in the production of concrete that is a mixture of cement, water, aggregates (such as sand), and other admixtures. Silica sand, used as a fine aggregate in concrete, enhances the strength and durability of the final product. Its consistent particle size and shape ensure a uniform mix, contributing to a solid and reliable concrete structure.
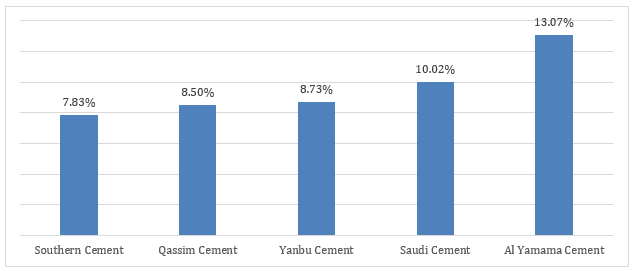
Figure: Market Share of Top 5 Cement Producers in Saudi Arabia, 2023-24
The demand for high quality casting metal is gaining popularity due to the expansion of industrial sectors. As per 2024 data, Saudi Arabia is home to 19 Foundries, a 5.56% increase from 2023. The top three states with the most Foundries are Riyadh, Eastern Province, and Makkah Region. In the oil and gas market, silica sand is used as a proppant in hydraulic fracturing to increase the flow rate of natural gas and oil. In July 2024, Aramco awarded USD 25 billion in contracts to expand upstream unconventional gas production, targeting a 60% increase in Saudi Arabia’s gas output from 2021 levels.
In the oil and gas market, silica sand is used as a proppant in hydraulic fracturing to increase the flow rate of natural gas and oil. In July 2024, Aramco awarded USD 25 billion in contracts to expand upstream unconventional gas production, targeting a 60% increase in Saudi Arabia’s gas output from 2021 levels. The expansion of the oil and gas sector in Saudi Arabia is further pushing the Saudi Arabia silica sand market growth.
Increased solar energy generation, expanding oil and gas sector and growth in the construction sector, drive Saudi Arabia silica sand market growth.
Mohammed Hadi Al Rashid & Partners Company - Al Rashid announced that it had secured a mining license for a high-percentage silica mine, granted by the Ministry of Industry and Mineral Resources in the Riyadh region under license number 1446632. The company stated in a Tadawul filing that the license, which spans 9.6 million square meters, is valid for 20 years, from July 9, 2024, to July 8, 2044.
According to 2024 report, the Kingdom operates 204 wastewater treatment plants and is the third-largest water reuse market globally. Saudi Arabia aims to achieve 100% reuse of treated urban wastewater by 2025, repurposing it for urban green spaces, irrigation, and industrial use, aiding the demand for silica sand.
Saudi Arabia had an installed cement capacity of 85Mt/year with 17 players that operate 22 active cement plants. Key cement producers in Saudi Arabia include Al Yamama Cement, Saudi Cement, and Yanbu Cement.
Saudi Aramco awarded National Energy Services Reunited Corp. (NESR) a contract in Saudi Arabia for drilling services worth USD 300 million. Saudi Aramco awarded the three-year contract for integrated rig-less stimulation and testing. The contract also includes an option for a two-year extension. The contract covers fracturing, testing, wireline, coiled tubing, slickline services, and the associated logistics and site services.
Solar energy is absorbed and stored by silica sand, which serves as a heat transfer fluid in concentrated solar power (CSP) plants. During 2022–early 2024, Saudi Arabia added about 2.1 gigawatts (GW) of renewable power capacity, a 300% increase from the 700 megawatts (MW) added between 2012 and 2022. The Renewable Energy Project Development Office (Repdo) of Saudi Arabia has laid out plans to develop 58.7GW of renewable energy capacity by 2030. Additionally, the renowned NEOM project is estimated to require between 20 and 40 GW of solar and wind power capacity to meet its energy requirements when it becomes operational in 2025, significantly supporting the Saudi Arabia silica sand market expansion.
Silica sand enhances oil and gas flow in hydraulic fracturing. Saudi Arabia is developing its unconventional gas reserves using advanced extraction methods. As per 2024 report, Jafurah gas field in Riyadh is positioned as the Middle East’s largest shale gas field with 229 trillion cubic feet of gas reserves. Additionally, it is the largest potential shale gas development, outside the USA.
The physical properties of silica sand, such as its high strength, low absorption rate, and thermal resistance, make it a crucial material in the construction sector. As per the Saudi Arabia silica sand market report, the construction market in Saudi Arabia has emerged as a leader in the Middle East and North Africa with a projected value of USD 70.33 billion in 2024, driven by Saudi Arabia’s Vision 2030 National Development Plan.
Silica sand is chemically inert, ensuring it does not react with the chemicals used in water treatment processes. This characteristic prevents the introduction of undesirable substances into the water supply, thereby maintaining the quality and safety of the treated water. Saudi Arabia is actively enhancing and expanding its desalination infrastructure to address the increasing water demand, given the Kingdom's limited natural water resources, supporting the Saudi Arabia silica sand market development. In August 2023, Saudi Arabia’s National Water Co (NWC) revealed its infrastructure plan, launching work on 12 major desalination projects valued at more than USD 1.3 billion across areas including Dammam, Al Khobar, Jubail, Al Ahsa, and Qatif. Additionally, according to the Saudi Water Authority (SWA), the country’s total desalinated water capacity will reach 13.3 million cubic meters per day by the end of 2024.
As per 2021 statistics, Saudi Arabia has the presence of high purity silica sand reserves (>98%), with 1 billion tons of reserves along with adequate energy and infrastructure. Moreover, in Saudi Arabia, there is an abundance of high-grade silica sand deposits located near Jeddah industrial city, the main glass manufacturing centre in the country.
Silica sand plays a significant role in the oil and gas sector, particularly as a proppant in hydraulic fracturing operations. The adoption of silica sand enables the increase of production rates in the oil and gas sector, further meeting the growing demand for energy resources, and boosting the Saudi Arabia silica sand market.
According to 2024 data, the Jafurah gas field is estimated to contain resources amounting to 229 trillion standard cubic feet of raw gas and 75 billion stock tank barrels of condensate. The proven reserves are reported at 15 trillion standard cubic feet of raw gas and two billion stock tank barrels of condensate.
Silica sand plays a crucial role in the production of automobile components, such as tires and brake pads. In the production of tires, it is used as a filler material and reinforcing agent. Silica sand enhances the grip, fuel efficiency, and overall performance of tires, which is especially essential in wet and slippery conditions.
As per the Saudi Arabia silica sand market analysis, in automotive paint formulation, silica sand is often used as a filler material and performance-enhancing additive. Their inclusion improves the scratch resistance and durability of paints. Silica sand’s versatility makes it an indispensable material in improving the overall performance of modern vehicles. By 2030, Saudi Arabian government aims to have 3-4 OEMs producing over 400,000 passenger vehicles. Further, by 2030, the automotive industry in Saudi Arabia is expected to grow at a rate of 12%, driven by the country’s Vision 2030 program and its ambitious goals for clean mobility and autonomous mobility.
Silica sand is used in a diverse range of applications for water filtration, including potable and wastewater treatment, sewage treatment plants, swimming and leisure, brewing, paper processing, chemical processes, and power generation. This is significantly increasing the Saudi Arabia silica sand market share.
A key concern associated with silica mining is the generation of fine silica dust, referred to as respirable crystalline silica (RCS). During the processes of crushing, grinding, and handling silica ore, RCS particles are released into the air, posing an inhalation risk to workers and nearby communities. Prolonged exposure to RCS can lead to severe respiratory conditions, including silicosis, lung cancer, and chronic obstructive pulmonary disease (COPD). Furthermore, silica sand mining can lead to environmental degradation, air pollution, water contamination, and socio-economic disruptions, hampering the Saudi Arabia silica sand market.
“Saudi Arabia Silica Sand Market Report and Forecast 2026-2035” offers a detailed analysis of the market based on the following segments:
Based on form, the market can be bifurcated into:
On the basis of type, the market can be divided into:
On the basis of application, the market can be divided into:
Read more about this report - REQUEST FREE SAMPLE COPY IN PDF
Market Analysis by Form
Extensive applications of wet sand, aid silica sand demand.
Expanding end-use sectors provide an opportunity for dry silica sand:
Market Analysis by Type
As per the Saudi Arabia silica sand market analysis, Jafurah is Saudi Arabia’s largest unconventional non-oil associated gas field, and it is potentially the biggest shale gas development outside of the United States. In February 2024, an additional 15 trillion standard cubic feet of gas was proven at the Jafurah field, with total reserves at Jafurah reaching 229 trillion cubic feet of gas and 75 billion barrels of condensates.
In August 2024, the National Company for Glass Industries (Zoujaj) announced that its subsidiary, Saudi Guardian International Float Glass Company (Gulf Guard), has approved a plan to build a float and insulating glass factory, estimated at USD 215 million. The Gulf Guard 2 plant will be located in the Royal Jubail Industrial Commission and is expected to have a production capacity of 750 tonnes per day.
Market Analysis by Application
For glass production, silica sand must have a chemical purity of 95% SiO2, precise grain size ranging between 0.075mm and 1.18mm, and specific colour requirements. In October 2024, Saudi Arabia's Obeikan Glass Company has announced the development of a second float glass production line at Yanbu facility, with a production capacity of 650 tonnes per day.
As per the Saudi Arabia silica sand market report, silica sand is a key proppant in hydraulic fracturing, used to extract oil and gas from deep rock formations. Superior quality frac sand is characterised by high purity, round shape for smooth transport, and durability to resist crushing forces. In July 2024, Saudi Aramco awarded USD 25 billion in contracts to boost the Jafurah Shale gas production and expand the Master Gas System, targeting a 60% increase in Saudi Arabia's gas output by 2030, compared to 2021 levels.
Silica sand is a vital component in construction materials like cement, flooring, asphalt, and mortars, boosting their strength and durability. In 2023, Saudi Arabia had an installed cement capacity of 85 million tonnes per year with around 17 producers operating 22 active cement plants. Key producers include Saudi Cement, Southern Province Cement, Yanbu Cement, and Yamama Cement.
Silica sand's high melting point make it ideal for foundries, as it can withstand extreme heat and preserves moulds for quality casting. In January 2022, Doosan Heavy Industries and Construction Co., signed a preliminary agreement to build Saudi’s largest steel castings and forgings plant. It will have an annual capacity of 60,000 tons once completed in Q1 2025.
Silica sand's high purity and low levels of clay, silt, and organic matter make it an excellent water filtration medium, ensuring clean output. Its durability under high pressure, enables the long-term use of silica sand, cutting replacement needs, and minimising the maintenance costs. Such properties are favouring the Saudi Arabia silica sand market.
An expanding chemical sector in Saudi Arabia, drives the demand for silica sand. As part of Vision 2030, Saudi Arabia’s chemical sector aims to contribute USD 121 billion to the country’s GDP by 2030, up from USD 95 billion in 2023. This growth will be driven by investments in crude-to-chemicals (COTC) projects, downstream diversification, and sustainability-focused innovations.
Silica sand enhances paint durability and finish, serving as a key filler to boost tint strength and dirt resistance. Its oil-absorbing qualities create a pigment-rich, resilient coating, making it ideal for wear-resistant applications in paints and coatings.

Read more about this report - REQUEST FREE SAMPLE COPY IN PDF
The key players in Saudi Arabia silica sand market are focused on improving the reliability of supply, price, customer relationships, processing quality, and product performance and characteristic. The development of the sector, support from the government, and market conditions all affect the rise of major market participants. Therefore, the vendors are concentrating on improving services and growing regionally.
Founded in 2007, MUADINOON is a progressive corporation involved in the mining and sale of minerals and raw material to a wide range of industries. Contributing in the Saudi economy, Muadinoon is one the country important suppliers of minerals such as industrial silica and iron.
Al Salam Al Ma’asi Co. (ASAMCO), a member of the Almarbaie Group, is a leader in mining and construction services. The company excels in surface mining across diverse terrains, managing its own mines and offering contract mining solutions.
Delmon Group, Saudi Arabia, is a multifaceted conglomerate specializing in manufacturing, engineering, trading, and marketing. The group offers a diverse range of services, including oil and gas supplies, chemical production, gasket manufacturing, and transportation. With extensive experience in both local and international mega projects, Delmon Group is a trusted partner in the industry.
Al-Rasheed Silica Plant is a leading manufacturer of silica sand, silica flour, and frac sand in the Middle East. Founded in 2000, Al-Rasheed Silica Plant's operations cater to both local markets and international exports, highlighting its extensive demographic reach.
*Please note that this is only a partial list; the complete list of key players is available in the full report. Additionally, the list of key players can be customized to better suit your needs.*
Other key players in the Saudi Arabia silica sand market are Al-Zahid Industrial and Mining Group, Adwan Chemical Industries Co. Ltd, ad BMS Factories (Gharbalah industrial company) among others.
Asia Pacific Silica Sand Market
Latin America Silica Sand Market
Middle East Silica Sand Market
Australia Silica Sand Market
Brazil Silica Sand Products Market
Europe Silica Sand Market
Silica Sand Market
Upto 15% Off
USD
$2499 $2249
$3999 $3599
$4999 $4249
$5999 $5099


*While we strive to always give you current and accurate information, the numbers depicted on the website are indicative and may differ from the actual numbers in the main report. At Expert Market Research, we aim to bring you the latest insights and trends in the market. Using our analyses and forecasts, stakeholders can understand the market dynamics, navigate challenges, and capitalize on opportunities to make data-driven strategic decisions.*
In 2025, the Saudi Arabia silica sand market reached an approximate volume of 757.87 KMT.
The silica sand market is assessed to grow at a CAGR of 6.30% between 2026 and 2035.
The Saudi Arabia silica sand market is estimated to witness healthy growth in the forecast period of 2026-2035 to reach a volume of around 1396.13 KMT by 2035.
The different forms of silica sand include dry and wet.
The applications of silica sand are glass industry, oil and gas, construction, foundry, filtration, chemical, ceramic and refractories, paint and coating, and others.
The types of silica sand are glass sand, frac sand, foundry and moulding sand, and other industrial sand.
The factors driving the silica sand market are increasing construction activities, presence of favourable government initiatives, a significant presence of silica sand deposits, and rising adoption of renewable energy in Saudi Arabia.
The key players in the Saudi Arabia silica sand market analysis include Muadinoon Mining Company, Al Salam Al Ma'asi Co. (ASAMCO), Delmon Group, Rashed Al Rashed & Sons Co., and BMS Factories (Gharbalah Industrial Company), among others.
Explore our key highlights of the report and gain a concise overview of key findings, trends, and actionable insights that will empower your strategic decisions.
| REPORT FEATURES | DETAILS |
| Base Year | 2025 |
| Historical Period | 2019-2025 |
| Forecast Period | 2026-2035 |
| Scope of the Report |
Historical and Forecast Trends, Industry Drivers and Constraints, Historical and Forecast Market Analysis by Segment:
|
| Breakup by Form |
|
| Breakup by Type |
|
| Breakup by Application |
|
| Market Dynamics |
|
| Competitive Landscape |
|
| Companies Covered |
|
| Report Price and Purchase Option | Explore our purchase options that are best suited to your resources and industry needs. |
| Delivery Format | Delivered as an attached PDF and Excel through email, with an option of receiving an editable PPT, according to the purchase option. |
Datasheet
One User
USD 2,499
USD 2,249
tax inclusive*
Single User License
One User
USD 3,999
USD 3,599
tax inclusive*
Five User License
Five User
USD 4,999
USD 4,249
tax inclusive*
Corporate License
Unlimited Users
USD 5,999
USD 5,099
tax inclusive*
*Please note that the prices mentioned below are starting prices for each bundle type. Kindly contact our team for further details.*
Flash Bundle
Small Business Bundle
Growth Bundle
Enterprise Bundle
*Please note that the prices mentioned below are starting prices for each bundle type. Kindly contact our team for further details.*
Flash Bundle
Number of Reports: 3
20%
tax inclusive*
Small Business Bundle
Number of Reports: 5
25%
tax inclusive*
Growth Bundle
Number of Reports: 8
30%
tax inclusive*
Enterprise Bundle
Number of Reports: 10
35%
tax inclusive*
How To Order

Select License Type
Choose the right license for your needs and access rights.

Click on ‘Buy Now’
Add the report to your cart with one click and proceed to register.

Select Mode of Payment
Choose a payment option for a secure checkout. You will be redirected accordingly.
Strategic Solutions for Informed Decision-Making
Gain insights to stay ahead and seize opportunities.

Get insights & trends for a competitive edge.

Track prices with detailed trend reports.

Analyse trade data for supply chain insights.

Leverage cost reports for smart savings

Enhance supply chain with partnerships.

Connect For More Information
Our expert team of analysts will offer full support and resolve any queries regarding the report, before and after the purchase.
Our expert team of analysts will offer full support and resolve any queries regarding the report, before and after the purchase.
We employ meticulous research methods, blending advanced analytics and expert insights to deliver accurate, actionable industry intelligence, staying ahead of competitors.
Our skilled analysts offer unparalleled competitive advantage with detailed insights on current and emerging markets, ensuring your strategic edge.
We offer an in-depth yet simplified presentation of industry insights and analysis to meet your specific requirements effectively.


