

Consumer Insights
Uncover trends and behaviors shaping consumer choices today
Procurement Insights
Optimize your sourcing strategy with key market data
Industry Stats
Stay ahead with the latest trends and market analysis.


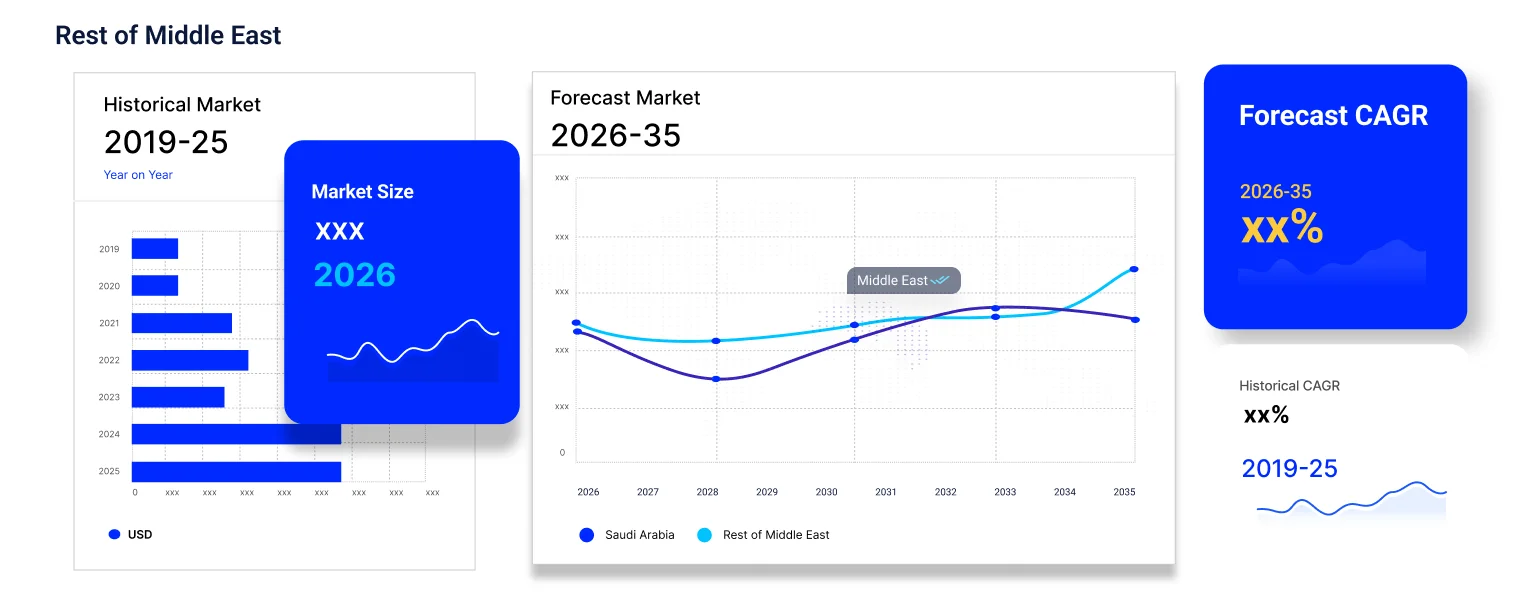
The Middle East silica sand market size reached around USD 434.39 Million in 2025. The market is estimated to grow at a CAGR of 6.80% between 2026 and 2035 to reach a value of USD 838.67 Million by 2035.
In 2020, Saudi Arabia was amongst the top exporters of silica sand globally.
Saudi Arabia has reserves of around 40 million tons of silica sand.
Rising construction activities and government investments in infrastructure development in the Middle East are anticipated to be beneficial for the market as silica sand is used as a building material for products like cement and roofing.
Compound Annual Growth Rate
6.8%
Value in USD Million
2026-2035
Whole grain silica sand is employed in the manufacture of roofing shingles, cement, mortars, asphalt mixtures, and other flooring materials. Its properties contribute to increased durability, and the role of functional extender is fulfilled by ground silica, an anti-corrosive material.
The construction sector in the Middle Eastern region has experienced rapid growth, and is anticipated to grow further, owing to government investments supporting the same. These developments are likely to aid the silica sand market in the region as it is widely used in the construction sector as an important material in the manufacture of mortars, concrete, and other building materials.
Besides construction, silica sand finds applications in various industries, including glass manufacturing, production of solar panels, and in the oil and gas sector as a proppant in the hydraulic fracturing process.
Read more about this report - REQUEST FREE SAMPLE COPY IN PDF
Expanding construction sector; growing glass manufacturing; increasing number of solar projects; and rapid growth of the oil and gas sector are the key trends impacting the Middle East silica sand market growth
Al Masane Al Kobra Mining Company (AMAK) announced the plan to set up a closed joint stock company with Esan and ARMICO-Fujairah to invest in industrial minerals and related manufacturing industries across Saudi Arabia.
Qatar Industrial Manufacturing Co. (QIMC) began its initial operations of glass containers plant, where the plant will use imported high-quality silica sand and also the local sand from the Qatar Sand Treatment Plant of QIMC.
The expanding construction sector in countries such as Saudi Arabia, Oman, Qatar, and the UAE owing to the surging investments in infrastructural development by governments and private players is expected to positively influence the demand for silica sand in the manufacturing of components such as mortars, aggregates, roofing, resins, and flooring materials.
The manufacturing of solar panels in the region is expected to strengthen the demand for high quality silica sand, a key element in the production of solar panels.
The increasing use of the hydraulic fracturing process in oil and gas recovery is expected to increase the demand for silica sand as a proppant.
Due to its unique chemical and physical properties, silica sand is extensively used in the manufacturing of glass.
The demand for silica sand in the Middle Eastern region is strengthened by a flourishing construction and land reclamation market, as well as increased utilisation of silica sand in glass manufacturing, sports and landscaping, and water filtration.
Oman is enriched with economically feasible silica sand, which is likely to expand its use in different end-use sectors. In 2021, the Public Authority for Mining in Oman planned to tender 15 to 20 pre-approved mining blocks to explore rich deposits of industrial rocks and minerals, like silica sand. In line with this, Oman has ambitious plans to build a rail network for transporting minerals to facilitate their processing and refining within the area.
Read more about this report - REQUEST FREE SAMPLE COPY IN PDF
“Middle East Silica Sand Market Report and Forecast 2026-2035” offers a detailed analysis of the market based on the following segments:
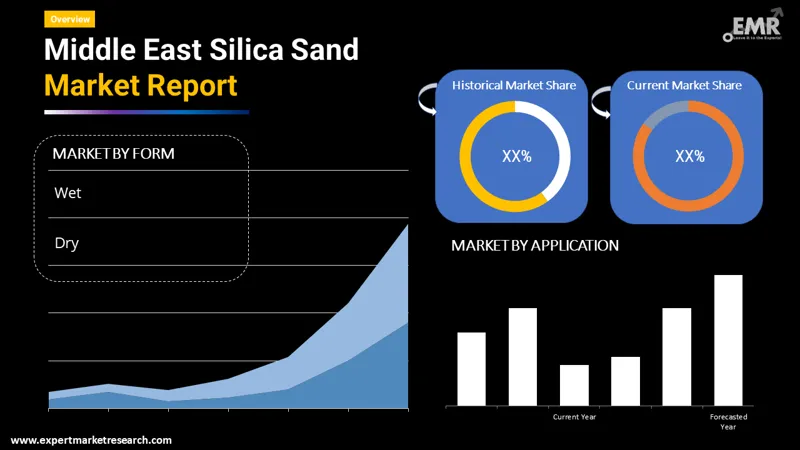
Market Breakup by Form
Market Breakup by Application
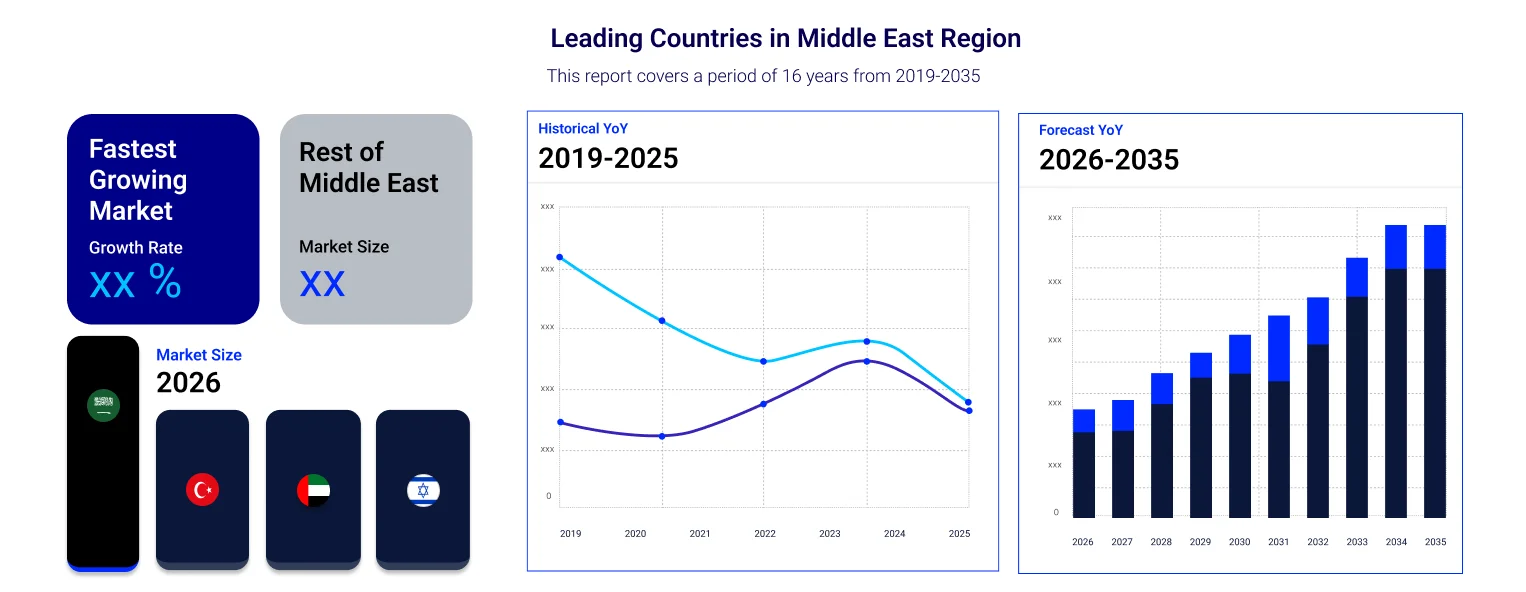
Market Breakup by Country
Based on application, the construction and land reclamation segment dominates the Middle East silica sand market share
With several construction projects under development, high-grade silica sand is widely used in construction chemicals manufacturing to produce sealants, adhesives for tiles, natural rock pavements, marbles, and sodium silicate. Projects involving extensive land reclamation in countries, including Saudi Arabia and Oman, are rising, owing to expanding infrastructural, commercial, and residential construction.
Other applications of silica sand include water filtration, integrated electronic circuits manufacturing, sports and landscaping, oil well drilling, and glass manufacturing, among others. Most countries in the Middle East region have abundant resources of silica sand ideal for the glassmaking market.
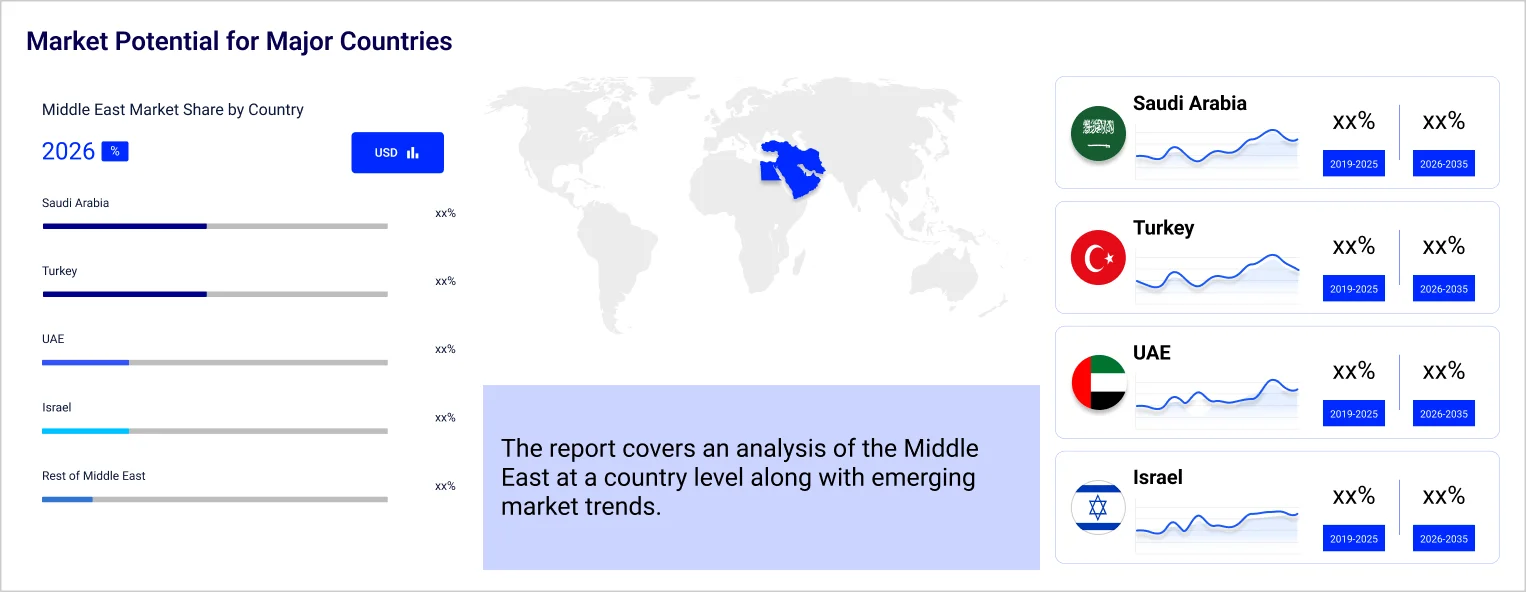
Saudi Arabia holds a significant share in the Middle East silica sand market and is rich in high-grade silica sand. Mining companies across the Middle East extract the purest ores of silica and treat them physically and chemically, producing differently sized silica sand granules to meet the needs of end use markets. The companies are also improving the quality of products offered to their clients by improving the washing and cleaning processes of the mined silica sand. Silica sand in Turkey is mined from the Thrace and Şile locations and is used in construction and glassmaking and as a filtration and moulding sand.
The market players are focusing on expanding their production operations to meet the growing demand from diverse sectors
Headquartered in Saudi Arabia, the company is a special manufacturer and supplier of water treatment filtration media and industrial raw materials.
With headquarters in Saudi Arabia, the company offers frac silica sand, washed silica sand, silica powder, and silica sand for use in wide range of sectors.
Headquartered in Riyadh, Saudi Arabia, the company provides silica flour, calcium carbonate, silica sand and salt.
DUBI CHEM Marine International is a chemical manufacturing company based in the UAE. The company’s warehouse in Fujairah has a storage capacity of more than 3600 MT.
*Please note that this is only a partial list; the complete list of key players is available in the full report. Additionally, the list of key players can be customized to better suit your needs.*
Other notable players operating in the Middle East silica sand market are At Al Raddadi Group, Asamco Group, Gulf Minerals & Chemicals L.L.C, Majd Al Muayad Trading Establishment, and Kivanc Kimya Industry and Trade Inc., among others.
Saudi Arabia Silica Sand Market
Asia Pacific Silica Sand Market
Upto 15% Off
USD
$2499 $2249
$3999 $3599
$4999 $4249
$5999 $5099


*While we strive to always give you current and accurate information, the numbers depicted on the website are indicative and may differ from the actual numbers in the main report. At Expert Market Research, we aim to bring you the latest insights and trends in the market. Using our analyses and forecasts, stakeholders can understand the market dynamics, navigate challenges, and capitalize on opportunities to make data-driven strategic decisions.*
The market attained a value of USD 434.39 Million in 2025.
The market is expected to grow at a CAGR of 6.80% between 2026 and 2035.
The market is estimated to witness a healthy growth in the forecast period of 2026-2035 to reach a value of USD 838.67 Million by 2035.
Silica sand is available in dry and wet forms.
The key countries are Saudi Arabia, the UAE, Qatar, Yemen, Oman, Turkey, Israel, and others.
The key factors driving the market include expansion of the construction sector, rising manufacture of glass, and the rapid growth of the oil and gas sector.
The major applications of silica sand include construction and land reclamation, and others.
The key players in the market include BMS FACTORIES (Gharbalah industrial company), Muadinoon Mining Company, Thrrat Factory For The Industry, DUBI CHEM Marine International, At Al Raddadi Group, Asamco Group, Gulf Minerals & Chemicals L.L.C, Majd Al Muayad Trading Establishment, and Kivanc Kimya Industry and Trade Inc., among others.
Explore our key highlights of the report and gain a concise overview of key findings, trends, and actionable insights that will empower your strategic decisions.
| REPORT FEATURES | DETAILS |
| Base Year | 2025 |
| Historical Period | 2019-2025 |
| Forecast Period | 2026-2035 |
| Scope of the Report |
Historical and Forecast Trends, Industry Drivers and Constraints, Historical and Forecast Market Analysis by Segment:
|
| Breakup by Form |
|
| Breakup by Application |
|
| Breakup by Region |
|
| Competitive Landscape |
|
| Companies Covered |
|
Datasheet
One User
USD 2,499
USD 2,249
tax inclusive*
Single User License
One User
USD 3,999
USD 3,599
tax inclusive*
Five User License
Five User
USD 4,999
USD 4,249
tax inclusive*
Corporate License
Unlimited Users
USD 5,999
USD 5,099
tax inclusive*
*Please note that the prices mentioned below are starting prices for each bundle type. Kindly contact our team for further details.*
Flash Bundle
Small Business Bundle
Growth Bundle
Enterprise Bundle
*Please note that the prices mentioned below are starting prices for each bundle type. Kindly contact our team for further details.*
Flash Bundle
Number of Reports: 3
20%
tax inclusive*
Small Business Bundle
Number of Reports: 5
25%
tax inclusive*
Growth Bundle
Number of Reports: 8
30%
tax inclusive*
Enterprise Bundle
Number of Reports: 10
35%
tax inclusive*
How To Order

Select License Type
Choose the right license for your needs and access rights.

Click on ‘Buy Now’
Add the report to your cart with one click and proceed to register.

Select Mode of Payment
Choose a payment option for a secure checkout. You will be redirected accordingly.
Strategic Solutions for Informed Decision-Making
Gain insights to stay ahead and seize opportunities.

Get insights & trends for a competitive edge.

Track prices with detailed trend reports.

Analyse trade data for supply chain insights.

Leverage cost reports for smart savings

Enhance supply chain with partnerships.

Connect For More Information
Our expert team of analysts will offer full support and resolve any queries regarding the report, before and after the purchase.
Our expert team of analysts will offer full support and resolve any queries regarding the report, before and after the purchase.
We employ meticulous research methods, blending advanced analytics and expert insights to deliver accurate, actionable industry intelligence, staying ahead of competitors.
Our skilled analysts offer unparalleled competitive advantage with detailed insights on current and emerging markets, ensuring your strategic edge.
We offer an in-depth yet simplified presentation of industry insights and analysis to meet your specific requirements effectively.


