

Consumer Insights
Uncover trends and behaviors shaping consumer choices today
Procurement Insights
Optimize your sourcing strategy with key market data
Industry Stats
Stay ahead with the latest trends and market analysis.
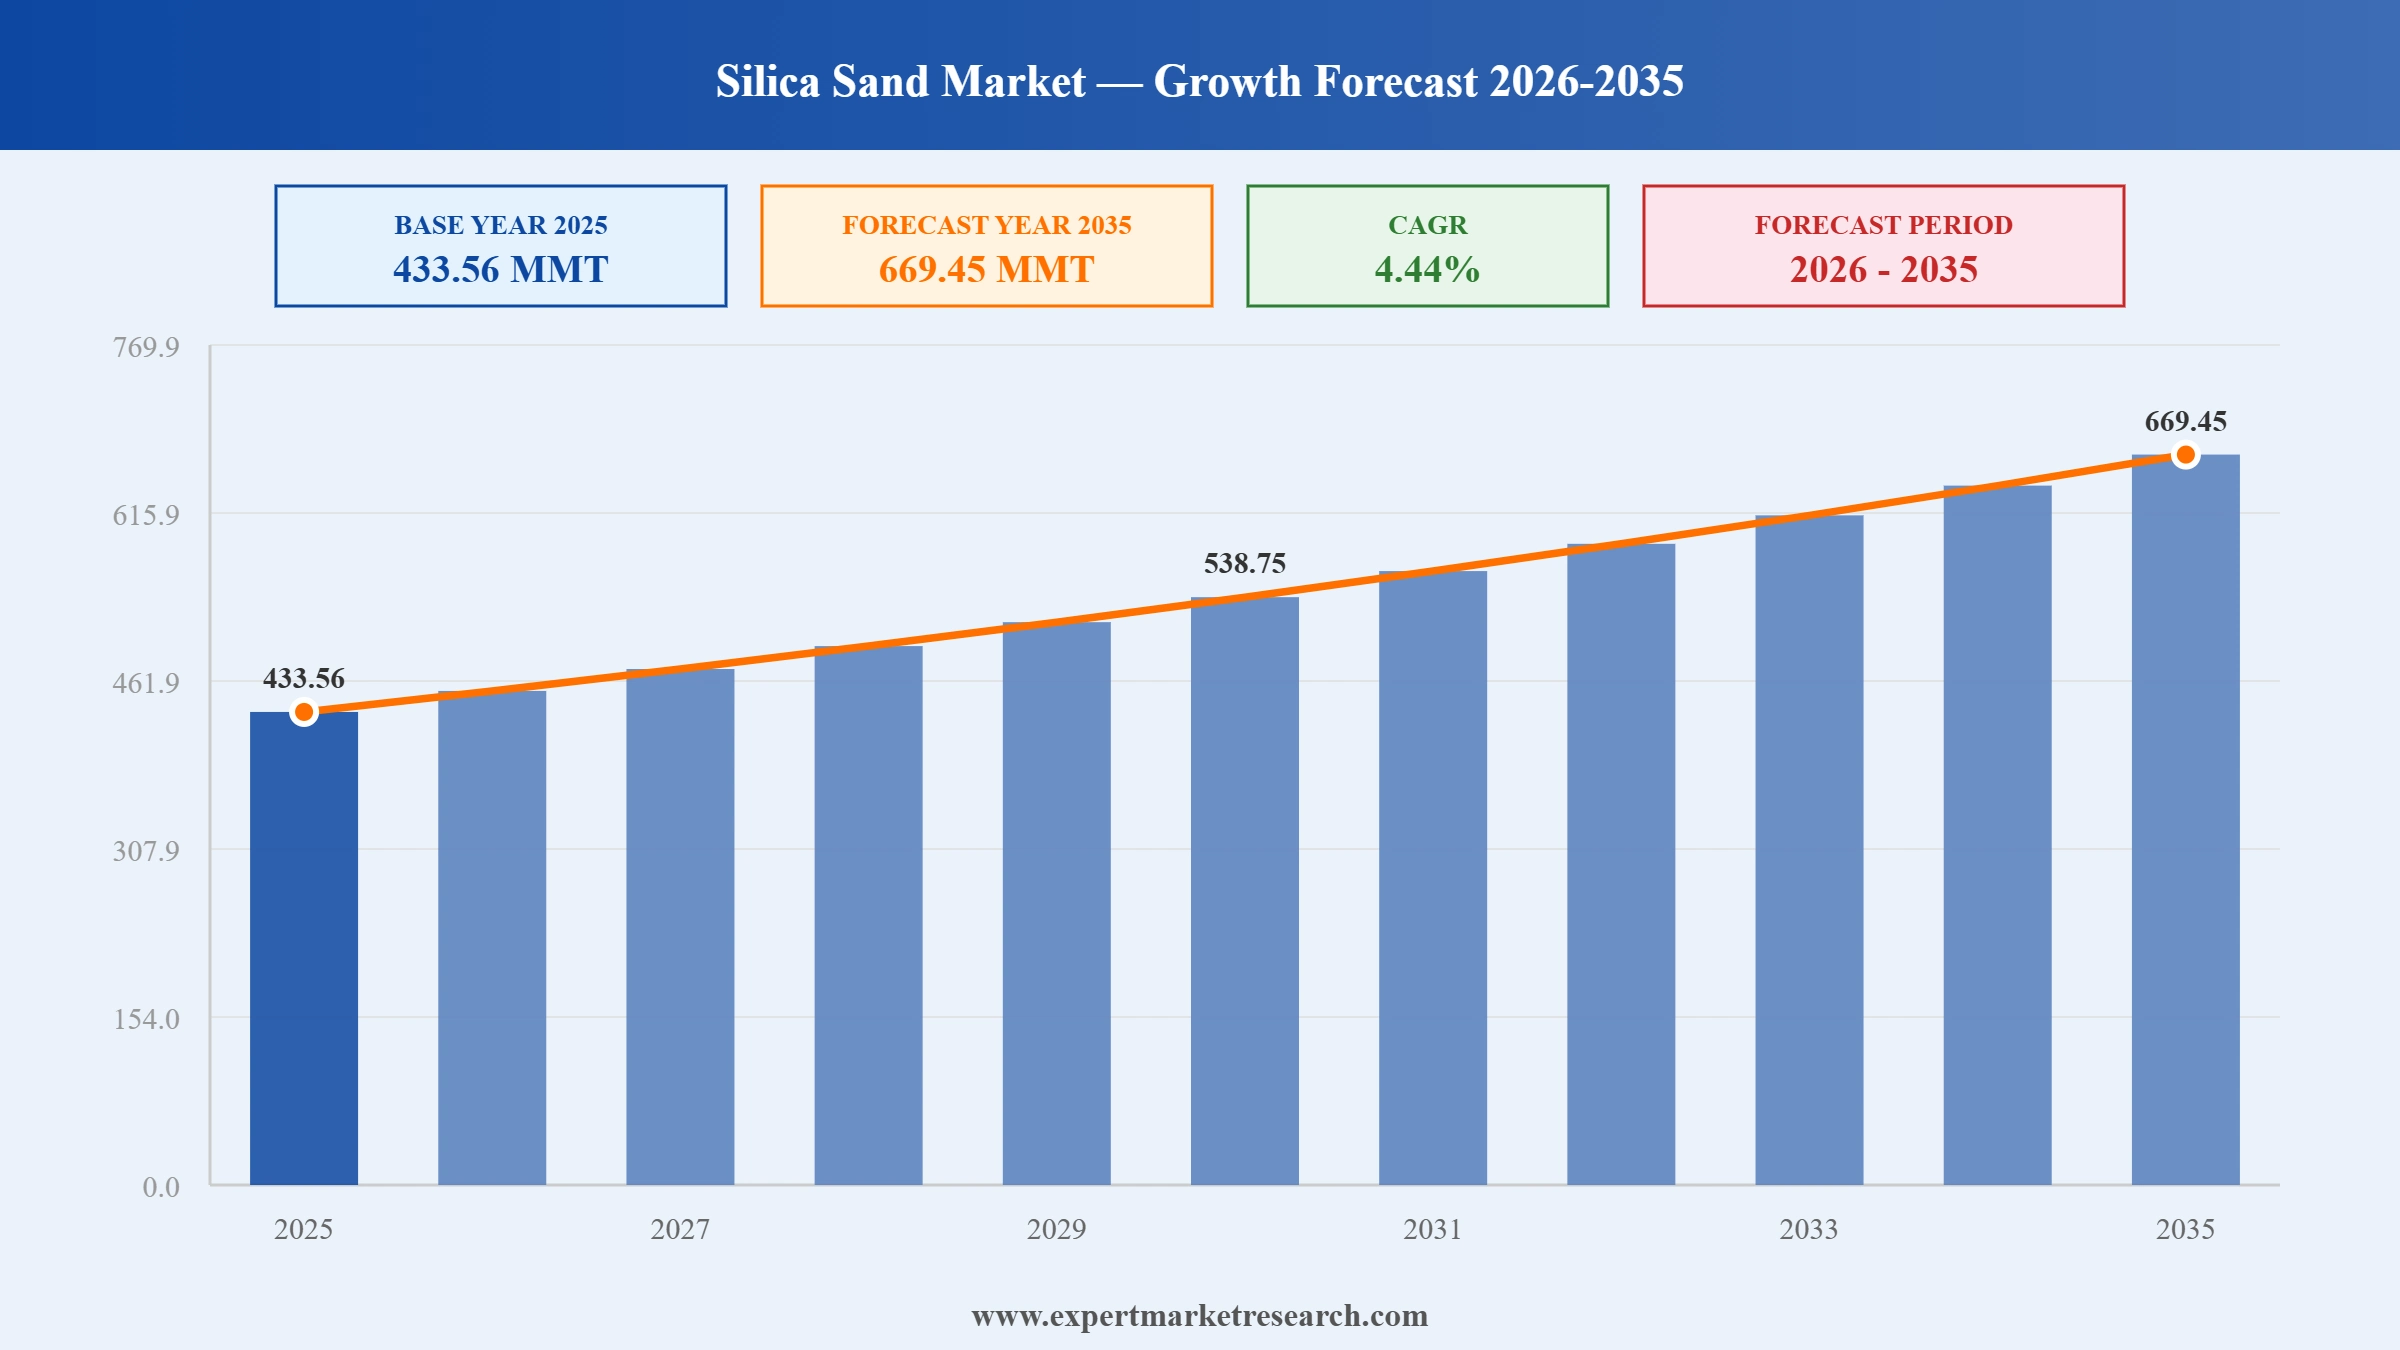
The global silica sand market reached a volume of 433.56 MMT in 2025, and is estimated to grow at a compound annual growth rate CAGR of 4.44% during the forecast period of 2026-2035 , reaching 669.45 MMT by 2035. The market's growth trajectory is underpinned by accelerating construction activity in emerging economies, the sustained energy production demands of North American shale formations, the global expansion of solar photovoltaic capacity, and the proliferation of semiconductor fabrication plants across Asia-Pacific and the United States. The global silica sand industry also referred to as the industrial silica sand or quartz sand market encompasses the worldwide production, processing, trade, and consumption of high-purity silicon dioxide granular material used across glass manufacturing, hydraulic fracturing, foundry casting, construction, water filtration, ceramics, and a rapidly expanding set of advanced industrial applications.

The competitive landscape of the global silica sand market is characterised by a mix of large vertically integrated multinationals, specialised regional producers, and commodity trading houses. The industry exhibits meaningful economies of scale in mining and logistics, making proximity to end-use demand centres and control over high-quality ore deposits critical competitive advantages. The market is moderately consolidated at the global level, with SCR-Sibelco NV, US Silica Holdings, and Covia Holdings among the most geographically diversified producers. Japanese conglomerates JFE Mineral & Alloy, Mitsubishi Corporation, and Tochu Corporation play a disproportionately important role in high-purity supply chains for the electronics and automotive sectors.
Read more about this report - REQUEST FREE SAMPLE COPY IN PDF
The global silica sand industry is undergoing a structural evolution driven by three converging megatrends: the imperative to decarbonise industrial supply chains, the accelerating pace of technological innovation in extraction and processing, and the broadening scope of industrial demand from traditional bulk applications toward high-value specialty end-uses. Each of these trends is reshaping competitive dynamics, pricing structures, and geographic production patterns across the market.
Sustainable Sourcing Practices: Environmental sustainability has moved from a peripheral concern to a central strategic priority across the silica sand value chain. Mining operators are investing in advanced dust suppression technologies, water recycling and zero-discharge systems, and progressive land rehabilitation programmes to address regulatory pressure, community relations, and increasingly stringent procurement standards from downstream customers in the glass, solar, and electronics sectors. ESG frameworks are compelling major glass manufacturers particularly flat glass producers serving the construction and automotive industries to require supply chain audits from silica sand suppliers, creating a de facto certification system for sustainable sourcing. In North America, the Occupational Safety and Health Administration (OSHA) has maintained strict silica dust exposure standards, accelerating investment in enclosed processing systems and personal protective equipment. In Europe, the REACH regulation and Industrial Emissions Directive create additional compliance burdens that incentivise best-practice mining and processing technology adoption. Several major producers, including Sibelco and US Silica, have published dedicated sustainability roadmaps covering carbon intensity reduction, water stewardship, and biodiversity commitments. These trends are expected to raise industry-wide compliance costs while simultaneously creating premium-pricing opportunities for certified sustainable silica products, particularly in the specialty and electronics segments.
Technological Advancements in Processing: Processing technology is a critical differentiator in the silica sand market, determining product purity, particle size consistency, moisture content, and, ultimately, the value realised per ton of extracted material. The transition from basic extraction to multi-stage beneficiation encompassing scrubbing, attrition, froth flotation, magnetic separation, acid leaching, and thermal treatment is enabling producers to serve the demanding quality requirements of the semiconductor and solar industries. Automated sensor-based sorting systems, artificial intelligence-driven quality control platforms, and continuous process monitoring are being adopted at scale by leading producers to reduce energy consumption, improve yield consistency, and minimise operator intervention. In hydraulic fracturing, resin-coated proppants that combine silica sand with polymer coatings are gaining traction as operators seek higher closure strength and reduced fines generation in deep, high-pressure wells. Advanced in-basin mining operations processing silica at the point of extraction rather than shipping raw sand to distant processing plants are reducing logistics costs and carbon footprints, particularly in Texas, Oklahoma, and West Virginia. High-purity processing for the semiconductor sector involves multi-stage acid leaching and thermal treatment to achieve SiO₂ purity levels exceeding 99.99%, generating significant value uplift over commodity-grade material.
Diversification of Applications: The application portfolio of silica sand is expanding far beyond its traditional anchors of glass making and construction. Several structurally significant new demand vectors have emerged in recent years. High-purity silica sand is a critical raw material in silicon wafer production for semiconductors, where the purity requirements are among the most exacting in the industrial minerals industry. The global semiconductor industry's aggressive capacity expansion with major new fabrication plants announced across the US (under the CHIPS Act), Europe (European Chips Act), and Asia is expected to materially increase demand for IOTA-grade and premium quartz sands. Solar photovoltaic glass, which accounts for the transparent front sheet of solar panels, requires ultra-clear, low-iron silica sand and is one of the fastest-growing glass subsegments globally, tracking the exponential growth of solar panel installations. Battery technology is creating an emerging application in silica-based anode materials for next-generation lithium-ion cells, where silicon-graphite composites offer significantly higher energy density than graphite-only anodes. Water treatment and filtration represent a stable, growing application segment, with silica sand's physical and chemical inertness making it the preferred filter media for municipal water treatment, industrial effluent polishing, and desalination pre-treatment particularly relevant given the UN's projection of acute global water scarcity for six billion people by 2035.
Multiple intersecting structural forces are driving sustained demand growth in the global silica sand market. These drivers operate across geographic markets and application segments, providing the market with resilience against single-sector cyclicality and supporting consistent growth through the forecast period.
Rising Demand in Construction Sector: Construction remains one of the most significant demand drivers for silica sand, with the material consumed extensively across concrete production, glass manufacturing, paints and coatings, and ceramic applications. Rapid urbanisation and large-scale infrastructure investment programmes across Asia-Pacific, the Middle East, and Latin America are generating exceptional and sustained demand for construction-grade silica sand. Government-backed initiatives such as India's National Infrastructure Pipeline, Saudi Arabia's Vision 2030 megaprojects, and the US Infrastructure Investment and Jobs Act continue to underpin robust regional consumption growth.
Technological Innovations in Extraction: Advances in mining, beneficiation, and logistics technology are expanding the commercially viable silica sand resource base while improving the economic and environmental performance of existing operations. Innovations including AI-powered geological interpretation, real-time geochemical sensing, and automated drilling systems are enabling producers to extract higher-purity material with greater efficiency and lower operational costs. In the hydraulic fracturing segment, in-basin processing networks and last-mile pneumatic delivery systems have significantly reduced the delivered cost of frac sand, supporting demand growth even in periods of moderate commodity pricing.
Regulatory Support for Mining Activities: Regulatory frameworks in key producing and consuming countries broadly support silica sand mining activity, recognising its strategic importance to downstream industries including glass, construction, and energy. The designation of industrial minerals as critical supply chain components under initiatives such as the US CHIPS Act and Australia's investment-grade mining policies is facilitating the licensing of new production capacity and attracting long-term capital. While environmental and occupational health regulations around silica dust and water discharge create compliance costs, they ultimately favour well-capitalised producers and contribute to gradual market consolidation.
Expanding Applications in Industrial Sectors: Silica sand is gaining commercial traction in a growing range of industrial applications beyond its traditional demand centres of glass manufacturing, construction, and hydraulic fracturing. The rapid global expansion of semiconductor fabrication, solar photovoltaic manufacturing, and advanced automotive glazing is creating specialised demand for ultra-high-purity quartz sand, a segment growing significantly faster than the overall market. Emerging applications in additive manufacturing, industrial filtration, and battery materials are further diversifying the demand base and adding structural resilience to long-term market growth.
Growing Awareness of Environmental Sustainability: Rising environmental awareness is simultaneously reshaping supply-side practices and creating new demand pathways for silica sand in green economy applications. Solar panel manufacturing, semiconductor production, and advanced water treatment systems all depend critically on high-purity silica sand, directly linking the global clean energy and technology transition to sustained market demand. Concurrently, green building certifications and ESG-driven procurement standards are raising quality benchmarks across the supply chain, creating a premium pricing environment for sustainably sourced, certified silica products.


Read more about this report - REQUEST FREE SAMPLE COPY IN PDF
“Silica Sand Industry Report and Forecast 2026-2035” offers a detailed analysis of the market based on the following segments:
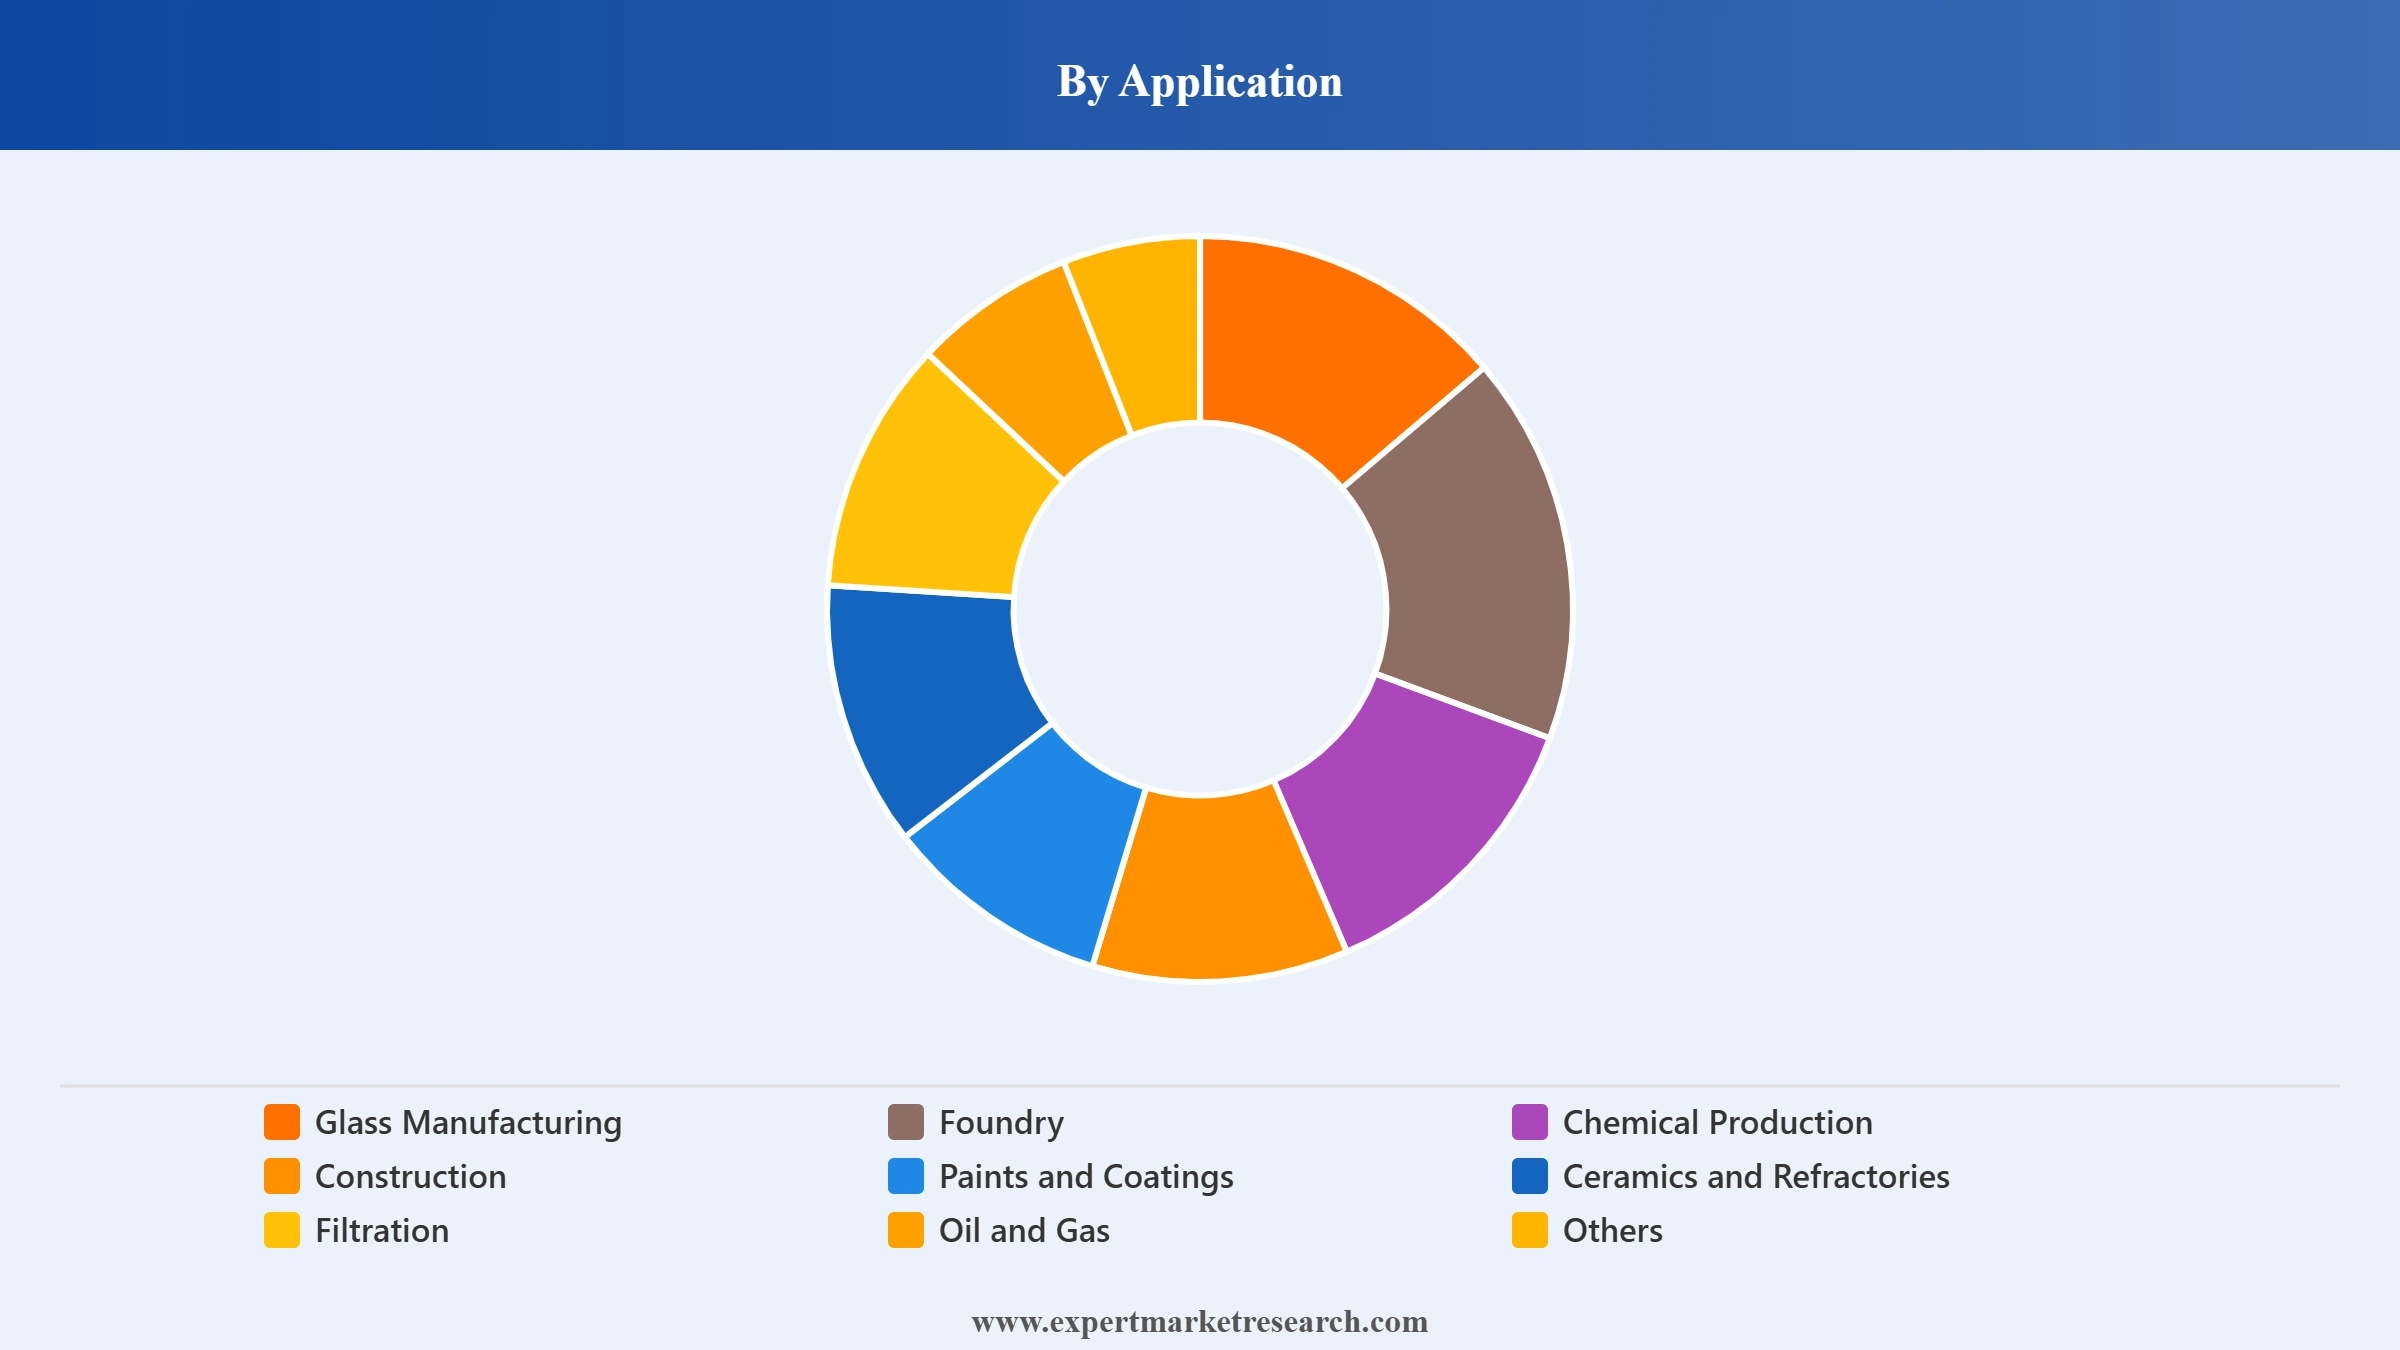
Market Breakup by Application
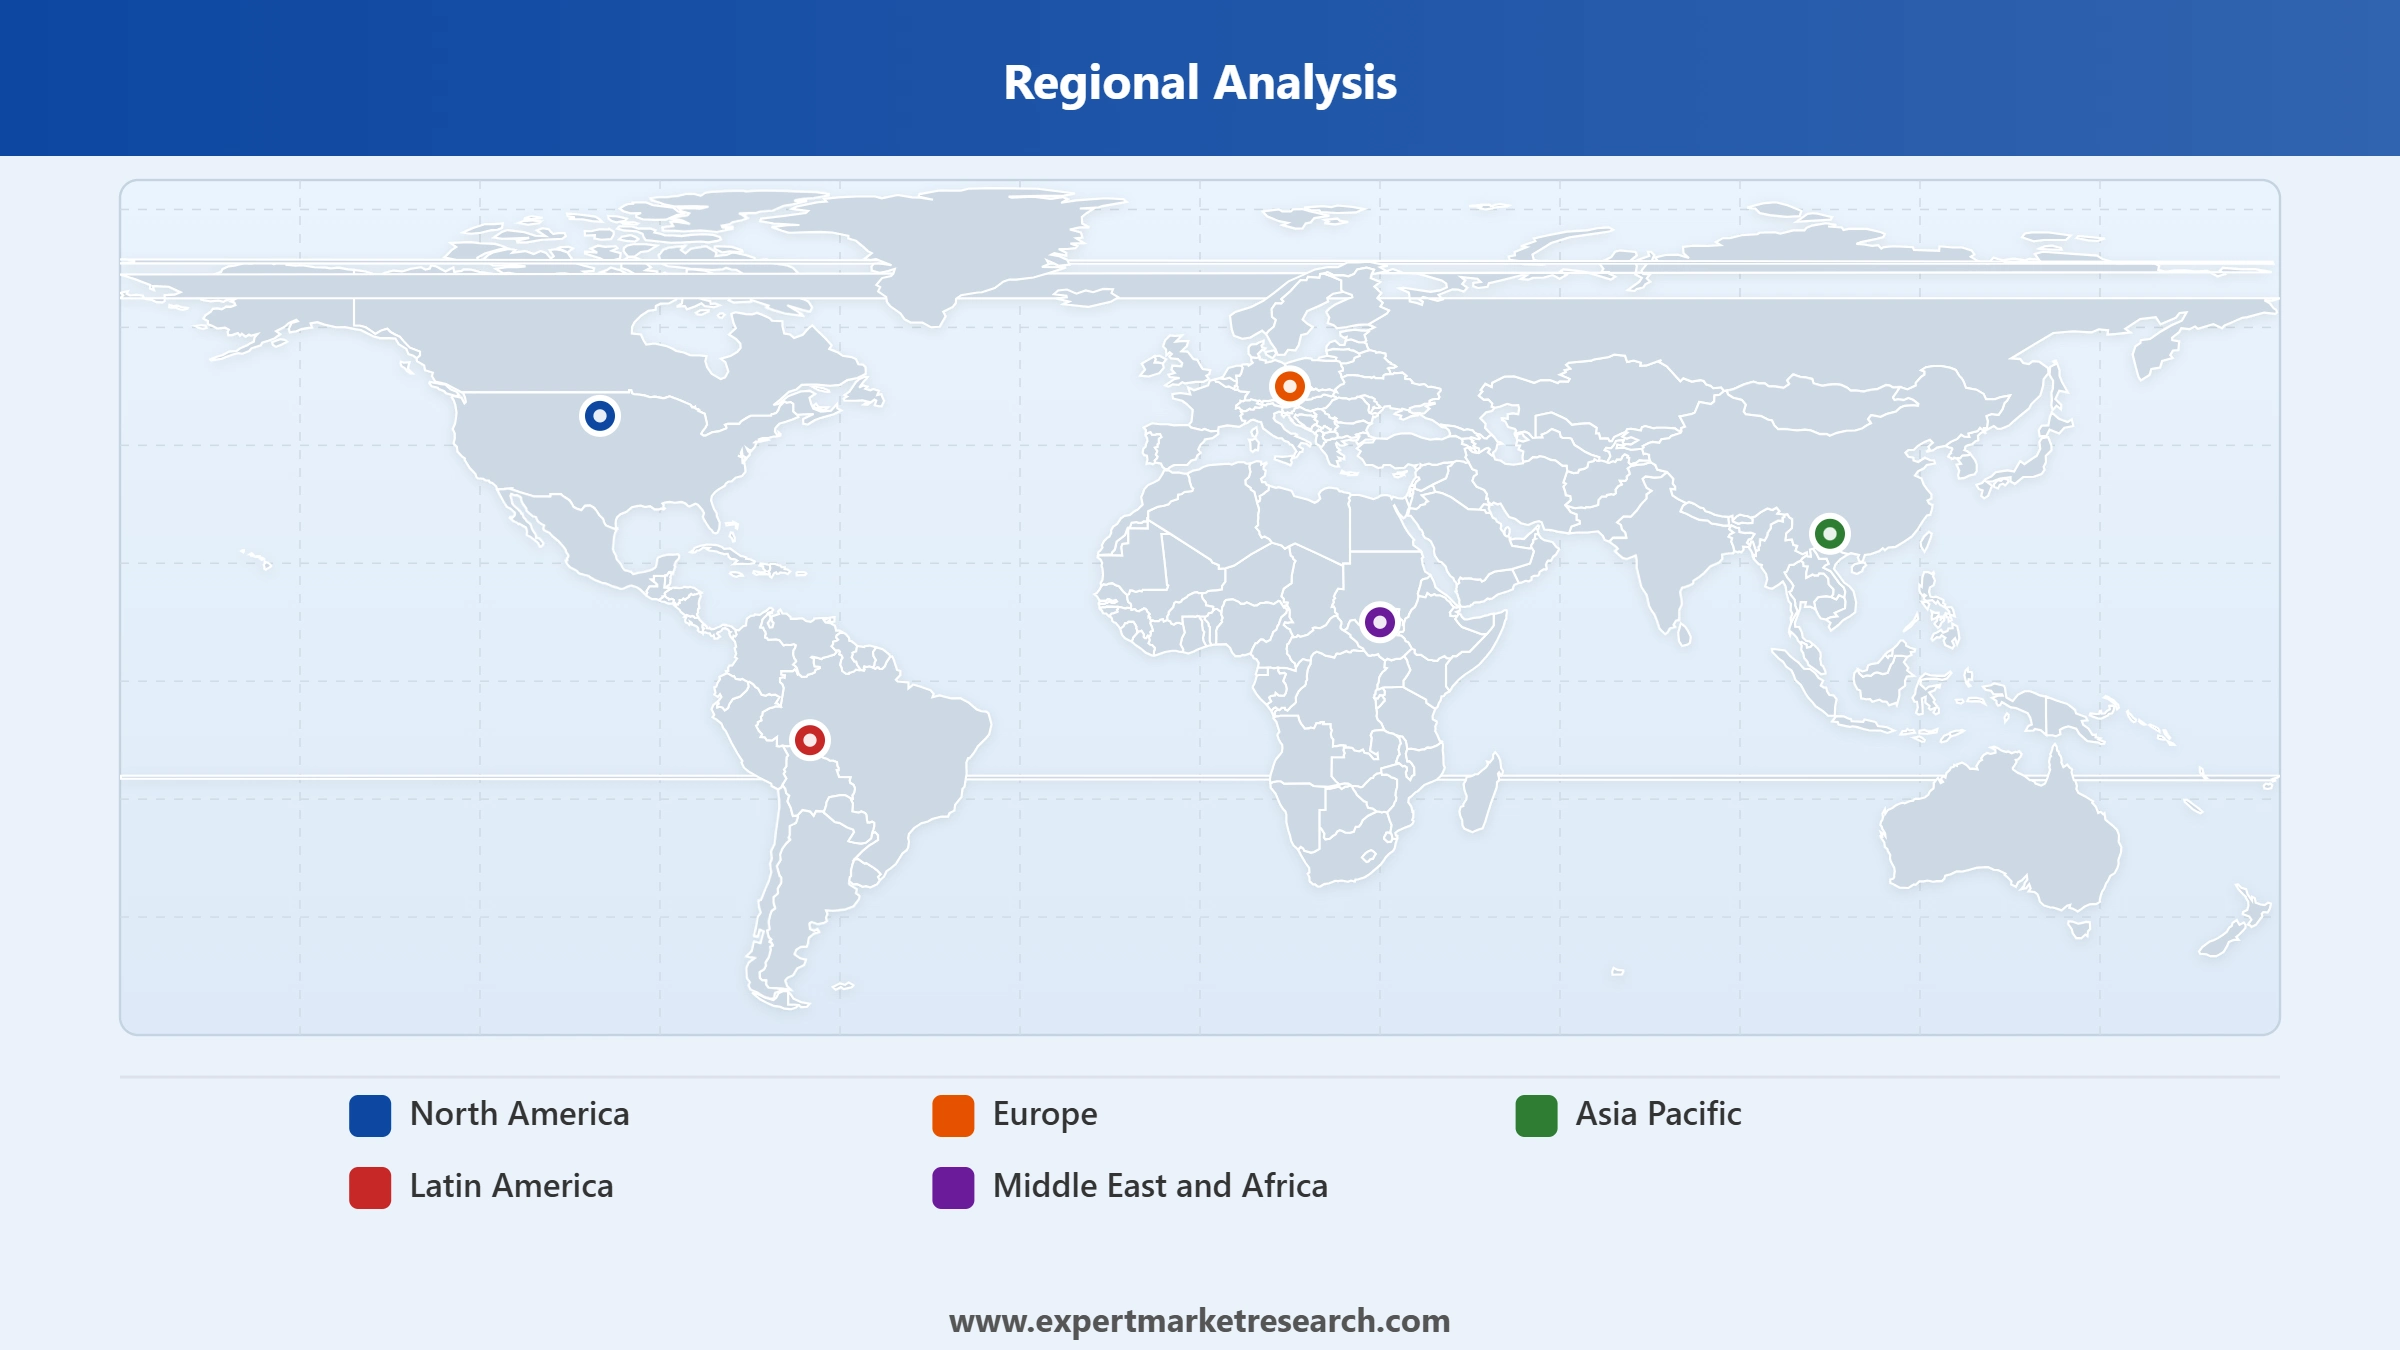
Market Breakup by Region
Glass manufacturing is growing due to high demand in construction and electronics.
As per silica sand market analysis, the demand for the silica sand will be high as glass manufacturing is pivotal in several industries, and hence, the attention for the segment will also be significant. Glass manufacturing will see growth at a CAGR of 5.2% during the forecast period. This growth is driven by increasing applications in construction, automotive, and electronics sectors.
Read more about this report - REQUEST FREE SAMPLE COPY IN PDF
Demand for silica sands is increasing through specific drivers in the different industries that use it. The foundry industries are facing an increase in demand because of the expansion in the manufacture of automobiles and industrial machinery, most of which require precision in metal castings. The chemical production industries are similarly experiencing growth on account of improved technology and growing demand for silicon-based chemicals that will increase demand for silica sand. Construction: Booming infrastructure development coupled with urbanization drive the demand for silica sand in concrete and asphalt mixtures. The paints and coatings industry has been facing increasing demand due to many industries focusing on durable and high-performance coatings. Ceramics and Refractories: High-temperature-resistant materials are increasingly demanded in aerospace, energy, and other similar industries along with advanced ceramics, pushing the growth of the silica sand industry.
As water and air qualities continue to degrade, the filtration industry is on the rise, thus increasing demand for effective filtration media like silica sand. Hydraulic fracturing to access previously unreachable reserves by the oil and gas industry is giving a tremendous boost to the demand for silica sand as a proppant. Lastly, in recreational and niche uses, the increasing popularity of sports and artistic leisure activities using sand is driving demand upward. Each of these sectors has its growth drivers, indicating the reliance on silica sand to meet the requirements of several industries and consumers.
North America Silica Sand Market Trends
According to the silica sand industry analysis, the crucial propellant factors for silica sand in North America include the growing oil and gas industry and infrastructural development. Hydraulic fracturing, which is being increasingly done to meet the demand for crude oil supply, has raised the demand for silica sand due to its use as a proppant. As an example, shale oil production in the United States has more than increased to over 9.6 million barrels per day in 2023, for which silica sand plays an essential role. In addition, infrastructure projects under schemes like the United States. The Infrastructure Investment and Jobs Act, which provided a funding of USD 1.2 trillion for its development, further supports the demand for building materials, one of which is silica sand. This powerful energy industry growth, alongside considerable investment in infrastructure, drives the silica sand market in North America.
Europe Silica Sand Market Insights
The demand in Europe is partly driven by the drive for high-quality glass products and the growth in the construction sector. The rise of sustainable building practices along with advancements in green technologies like energy-efficient windows and solar panels increases demand for specialised glass, which is often fabricated from high-purity silica sand. For instance, Europe's commitment to carbon emission reductions and improvements in energy efficiency has driven the use of advanced glass solutions in both building retrofits and new construction. Also, large infrastructure projects at the helm of investment plans by the European Union further drive the silica sand industry in Europe. This combination of technological advancements in the production of glass, and the extension of infrastructure development across Europe, is driving the market.
Asia Pacific Silica Sand Market Driving Factors
With rapid industrialization and urbanisation, growing investments in infrastructure are expected, and the Asia Pacific will be the leading region in the silica sand market, leading with a 5.1% CAGR through 2032. The rapid development of the construction sector, with large projects in urban areas and more investment by the government in infrastructure, stimulates the demand for silica sand.
For example, China's ambitious plan to expand its urban areas and India's gigantic infrastructure projects, such as the Smart Cities Mission, have greatly increased silica sand consumption. Further demand of the silica market in the nations is driven by the growing glass manufacturing sector, particularly those serving electronics and solar panels. The demand in the Asia Pacific region is expected to outshine that in other regions due to economic growth and substantial investments in infrastructure and technology, establishing the region's dominance in the global market.
China and India hold a significant position in the global construction sector, driving the demand for silica sand. The construction sector in China is anticipated to maintain a 6% share of the country's GDP until 2025 while in India, the construction sector constituted 9% of the GDP in 2023, accelerating the silica sand market share in Asia Pacific.
Read more about this report - REQUEST FREE SAMPLE COPY IN PDF
Latin America Silica Sand Market Opportunities
Expanding construction activities and increasing investments in infrastructure development propel the silica sand industry in Latin America. The rate of urbanisation and infrastructure projects concerning roads and residency in Latin American countries such as Brazil and Mexico are significantly increasing due to demand for silica sand. For instance, huge infrastructure projects in Brazil include expanding roads and transportation systems as well as accommodation projects that demand huge consumption of silica sand. Besides that, demand from building and automobile industries also gives a boost to the market. These, along with economic development and increased urbanisation in Latin American countries, drive the silica sand demand growth forward.
Middle East And Africa Silica Sand Market Dynamics
The factors such as rapid urbanisation and heavy infrastructure development in the Middle East and Africa drive the market for silica sand. The region's growing construction industry, working on projects of Saudi Vision 2030 and furthering the legacy created by Expo 2020 in the UAE, sees an unprecedented surge in the demand for silica sand. Huge investments in residential and commercial projects, along with infrastructure projects, are acting as major contributors in cities such as Dubai and Riyadh. The market also grows with the increasing application of silica sand for high-performance glass manufacturing in architectural applications. Efficient water filtration systems are in demand in arid regions, thus giving further demand for silica sand. These factors propel the silica sand market opportunities in the Middle East and Africa.
The startups in the silica sand industry have been working on innovations related to sustainable mining methods and advanced processing technologies. In addition, they work in improving the efficiency of extraction methods and their ecological influence on the environment while processing silica sand. A key trend of the silica sand market is that many startups have been developing value-added silica sand products for high-tech applications such as advanced glass manufacturing and water filtration. In fact, such startups want to take advantage of such emerging market opportunities and help in growing the industry by addressing the environmental concern and finding other uses of silica sand.
US Silica Holdings, Inc was founded in 2008 and is one of the major silica sand players. The company provides top-grade silica sand for hydraulic fracturing, industrial applications, and environmental services. US Silica follows principles of sustainability and efficiency in response to growing demand for its specialty sand products using advanced technologies in mining and processing.
TeraWatt Infrastructure is a relatively new company, founded in 2020. The company provides innovative silica sand to high-performance applications in advanced glassmaking and renewable energy technologies. It develops sustainable mining practices with state-of-the-art processing capabilities that will meet emerging demands for technology and energy.
Silica sand market players are increasingly broadening their approach toward sustainability and efficiency in mining and processing to develop more qualitative, specialised sand products for a wider range of applications, including hydraulic fracturing, advanced glass making, and water filtration. Innovation in greener practices and technology-driven solutions forms the core of the market leaders’ strategies, aiming at marketplace demand combined with environmental concern. Few of the silica sand companies that are leading the market are:
Is a subsidiary of JFE Holdings, Inc. The company was formed in April 2022 after a merger of JFE Mineral Company, Mizushima Alloy Steel Company, and JFE Materials Company.
Provides material solutions, specialising in sourcing, transformation, and distribution of specialty industrial minerals, including silica, clays, feldspathoids, and olivine. Headquartered in Belgium, the company operates with 200 production sites across 31 countries, 6 technical centres, and has a workforce of around 4,683 employees.
Headquartered in Japan, Mitsubishi Corporation has a wide range of businesses across multiple industries and operates with eight industry-specific business groups namely environmental energy, materials solution, mineral resources, urban development and infrastructure, mobility, food industry, smart life creation, and power solution.
Was formed by the merger of Fairmount Santrol and Unimin and is a top provider of mineral and material solutions for the Industrial and Energy markets. Founded in 2018, the company offers a diverse range of high-quality products, specialised technical expertise, and the most comprehensive and accessible distribution network.
Other notable players operating in the global silica sand market are Tochu Corporation, US Silica Holdings Inc, Euroquarz GmbH, Manley Bros. of Indiana, Inc, Badger Mining Corporation, and Perniagaan Usahasama Membalak Sdn. Bhd. (PUM Group), among others.
*Please note that this is only a partial list; the complete list of key players is available in the full report. Additionally, the list of key players can be customized to better suit your needs.*
Saudi Arabia Silica Sand Market
Asia Pacific Silica Sand Market
Middle East Silica Sand Market
Filter and Abrasive Grade Silica Sand Market
Construction-Grade Silica Sand Market
Foundry & Mold-Grade Silica Sand Market
Upto 15% Off
USD
$2499 $2249
$3999 $3599
$4999 $4249
$5999 $5099


*While we strive to always give you current and accurate information, the numbers depicted on the website are indicative and may differ from the actual numbers in the main report. At Expert Market Research, we aim to bring you the latest insights and trends in the market. Using our analyses and forecasts, stakeholders can understand the market dynamics, navigate challenges, and capitalize on opportunities to make data-driven strategic decisions.*
The market attained a volume of 433.56 MMT in 2025.
The market is estimated to grow at a CAGR of 4.44% during 2026-2035.
The market is estimated to witness a healthy growth in the forecast period of 2026-2035 to reach a volume of 669.45 MMT by 2035.
The factors driving the market growth are increasing construction activities, expansion of the glass manufacturing sector, rising metal casting works, and expansion of the oil and gas sector.
Key trends aiding market expansion include the growing applications of silica sand, rising infrastructural developments in emerging economies, and increasing demand from the glass industry.
The key regional markets for silica sand are North America, Europe, the Asia Pacific, Latin America, and the Middle East and Africa.
Glass manufacturing is expected to account for the largest share in the forecast period.
The key players in the market include JFE Mineral & Alloy Company,Ltd, SCR-Sibelco NV, Mitsubishi Corporation, Covia Holdings LLC, Tochu Corporation, US Silica Holdings Inc, Euroquarz GmbH, Manley Bros. of Indiana, Inc, Badger Mining Corporation, and Perniagaan Usahasama Membalak Sdn. Bhd. (PUM Group), among others.
In August 2025, the global spending on construction stood at USD 1.98 trillion, representing a 7.4% increase since 2019.
The applications include glass manufacturing, foundry, chemical production, construction, paints and coatings, ceramics and refractories, filtration, oil and gas and others.
Explore our key highlights of the report and gain a concise overview of key findings, trends, and actionable insights that will empower your strategic decisions.
| REPORT FEATURES | DETAILS |
| Base Year | 2025 |
| Historical Period | 2019-2025 |
| Forecast Period | 2026-2035 |
| Scope of the Report |
Historical and Forecast Trends, Industry Drivers and Constraints, Historical and Forecast Market Analysis by Segment:
|
| Breakup by Application |
|
| Breakup by Region |
|
| Market Dynamics |
|
| Competitive Landscape |
|
| Companies Covered |
|
| Report Price and Purchase Option | Explore our purchase options that are best suited to your resources and industry needs. |
| Delivery Format | Delivered as an attached PDF and Excel through email, with an option of receiving an editable PPT, according to the purchase option. |
Datasheet
One User
USD 2,499
USD 2,249
tax inclusive*
Single User License
One User
USD 3,999
USD 3,599
tax inclusive*
Five User License
Five User
USD 4,999
USD 4,249
tax inclusive*
Corporate License
Unlimited Users
USD 5,999
USD 5,099
tax inclusive*
*Please note that the prices mentioned below are starting prices for each bundle type. Kindly contact our team for further details.*
Flash Bundle
Small Business Bundle
Growth Bundle
Enterprise Bundle
*Please note that the prices mentioned below are starting prices for each bundle type. Kindly contact our team for further details.*
Flash Bundle
Number of Reports: 3
20%
tax inclusive*
Small Business Bundle
Number of Reports: 5
25%
tax inclusive*
Growth Bundle
Number of Reports: 8
30%
tax inclusive*
Enterprise Bundle
Number of Reports: 10
35%
tax inclusive*
How To Order

Select License Type
Choose the right license for your needs and access rights.

Click on ‘Buy Now’
Add the report to your cart with one click and proceed to register.

Select Mode of Payment
Choose a payment option for a secure checkout. You will be redirected accordingly.
Strategic Solutions for Informed Decision-Making
Gain insights to stay ahead and seize opportunities.

Get insights & trends for a competitive edge.

Track prices with detailed trend reports.

Analyse trade data for supply chain insights.

Leverage cost reports for smart savings

Enhance supply chain with partnerships.

Connect For More Information
Our expert team of analysts will offer full support and resolve any queries regarding the report, before and after the purchase.
Our expert team of analysts will offer full support and resolve any queries regarding the report, before and after the purchase.
We employ meticulous research methods, blending advanced analytics and expert insights to deliver accurate, actionable industry intelligence, staying ahead of competitors.
Our skilled analysts offer unparalleled competitive advantage with detailed insights on current and emerging markets, ensuring your strategic edge.
We offer an in-depth yet simplified presentation of industry insights and analysis to meet your specific requirements effectively.


