

Consumer Insights
Uncover trends and behaviors shaping consumer choices today
Procurement Insights
Optimize your sourcing strategy with key market data
Industry Stats
Stay ahead with the latest trends and market analysis.
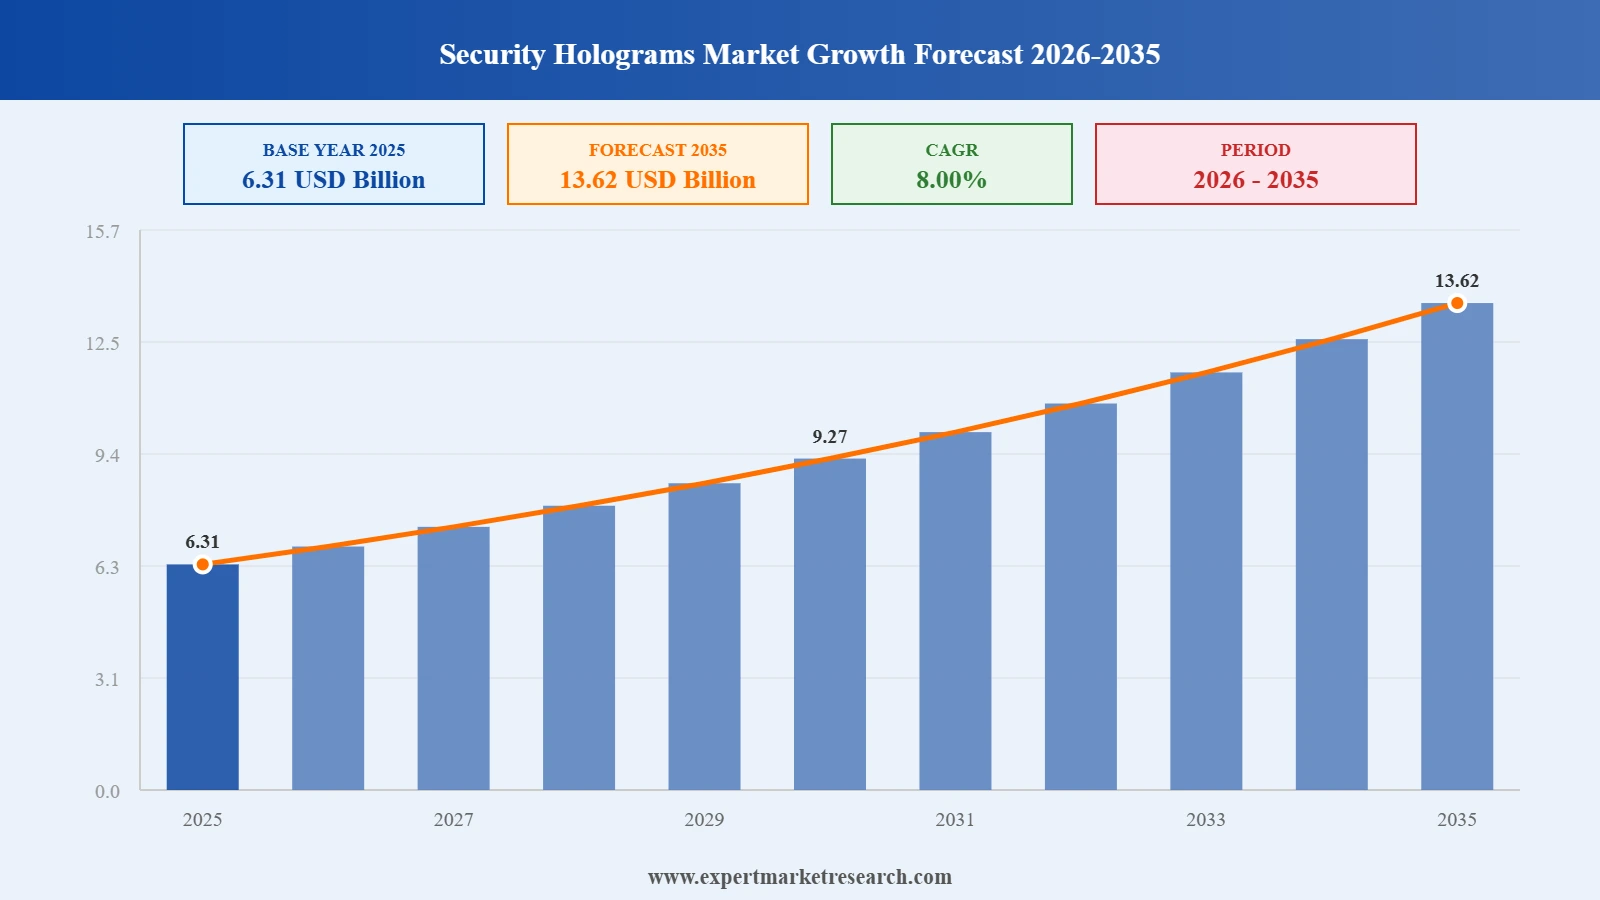
The global security holograms market size reached approximately USD 6.31 Billion in 2025. The market is further projected to grow at a CAGR of 8.00% between 2026 and 2035, reaching a value of USD 13.62 Billion by 2035.
Read more about this report - REQUEST FREE SAMPLE COPY IN PDF
Security holograms refer to specialised holographic images used for thwarting counterfeiting and forgery. The utilisation of advanced laser technology in the production of holograms makes them essentially unreplicable. A security hologram has a distinctive holographic image on top of a thin metallic sheet.
The EMR’s report titled “Security Holograms Market Report and Forecast 2026-2035” offers a detailed analysis of the market based on the following segments:
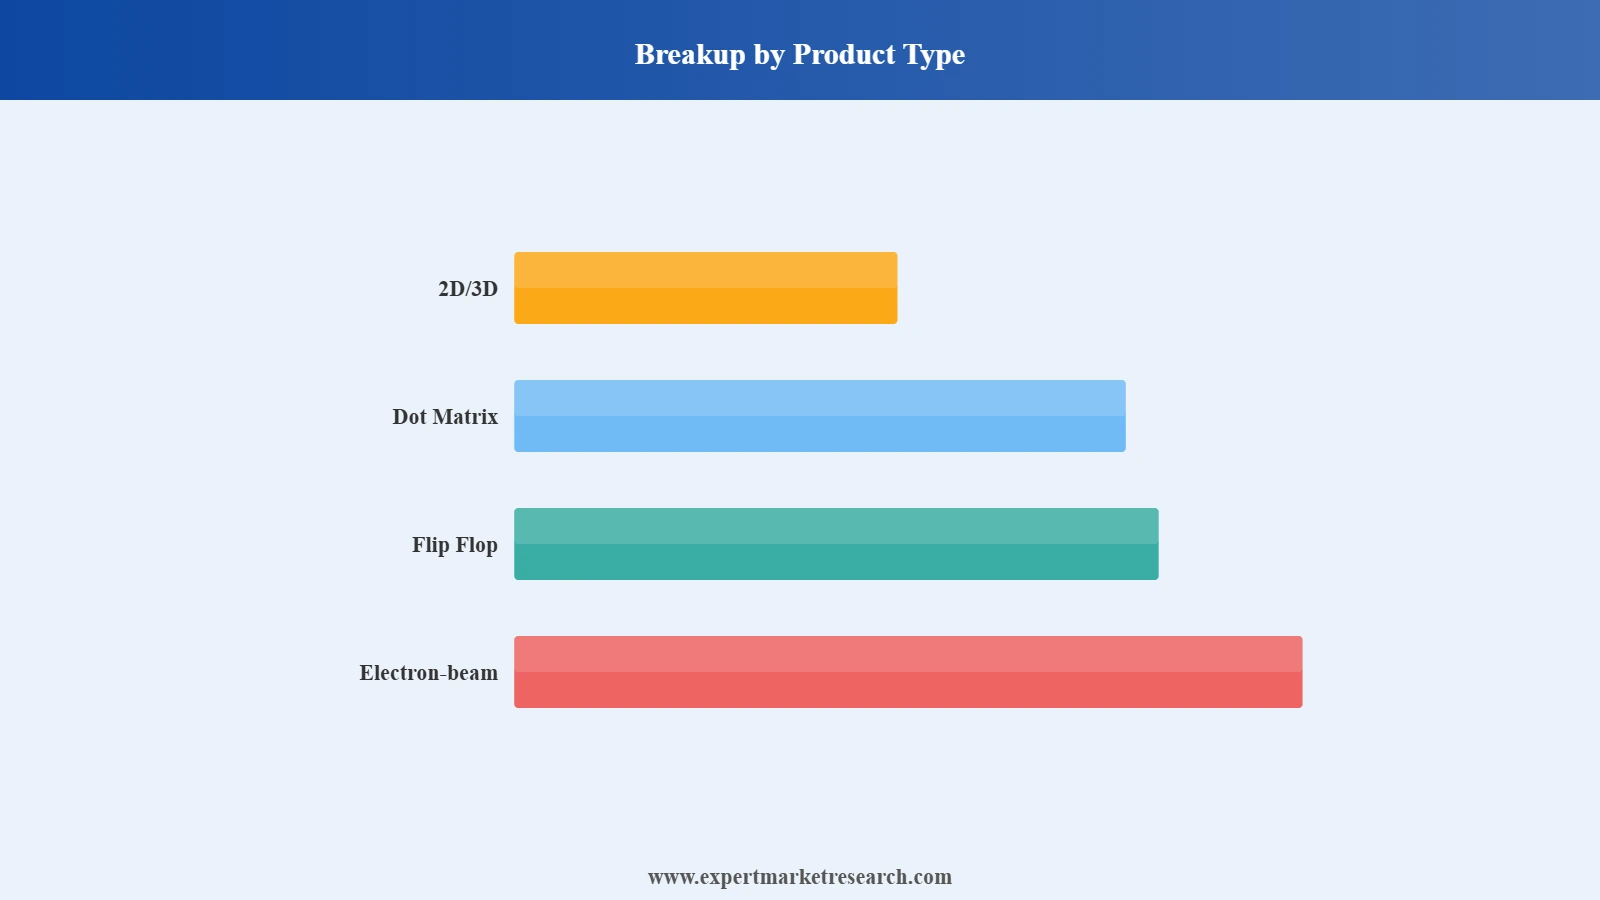
Market Breakup by Product Type
Market Breakup by Material
Market Breakup by End Use
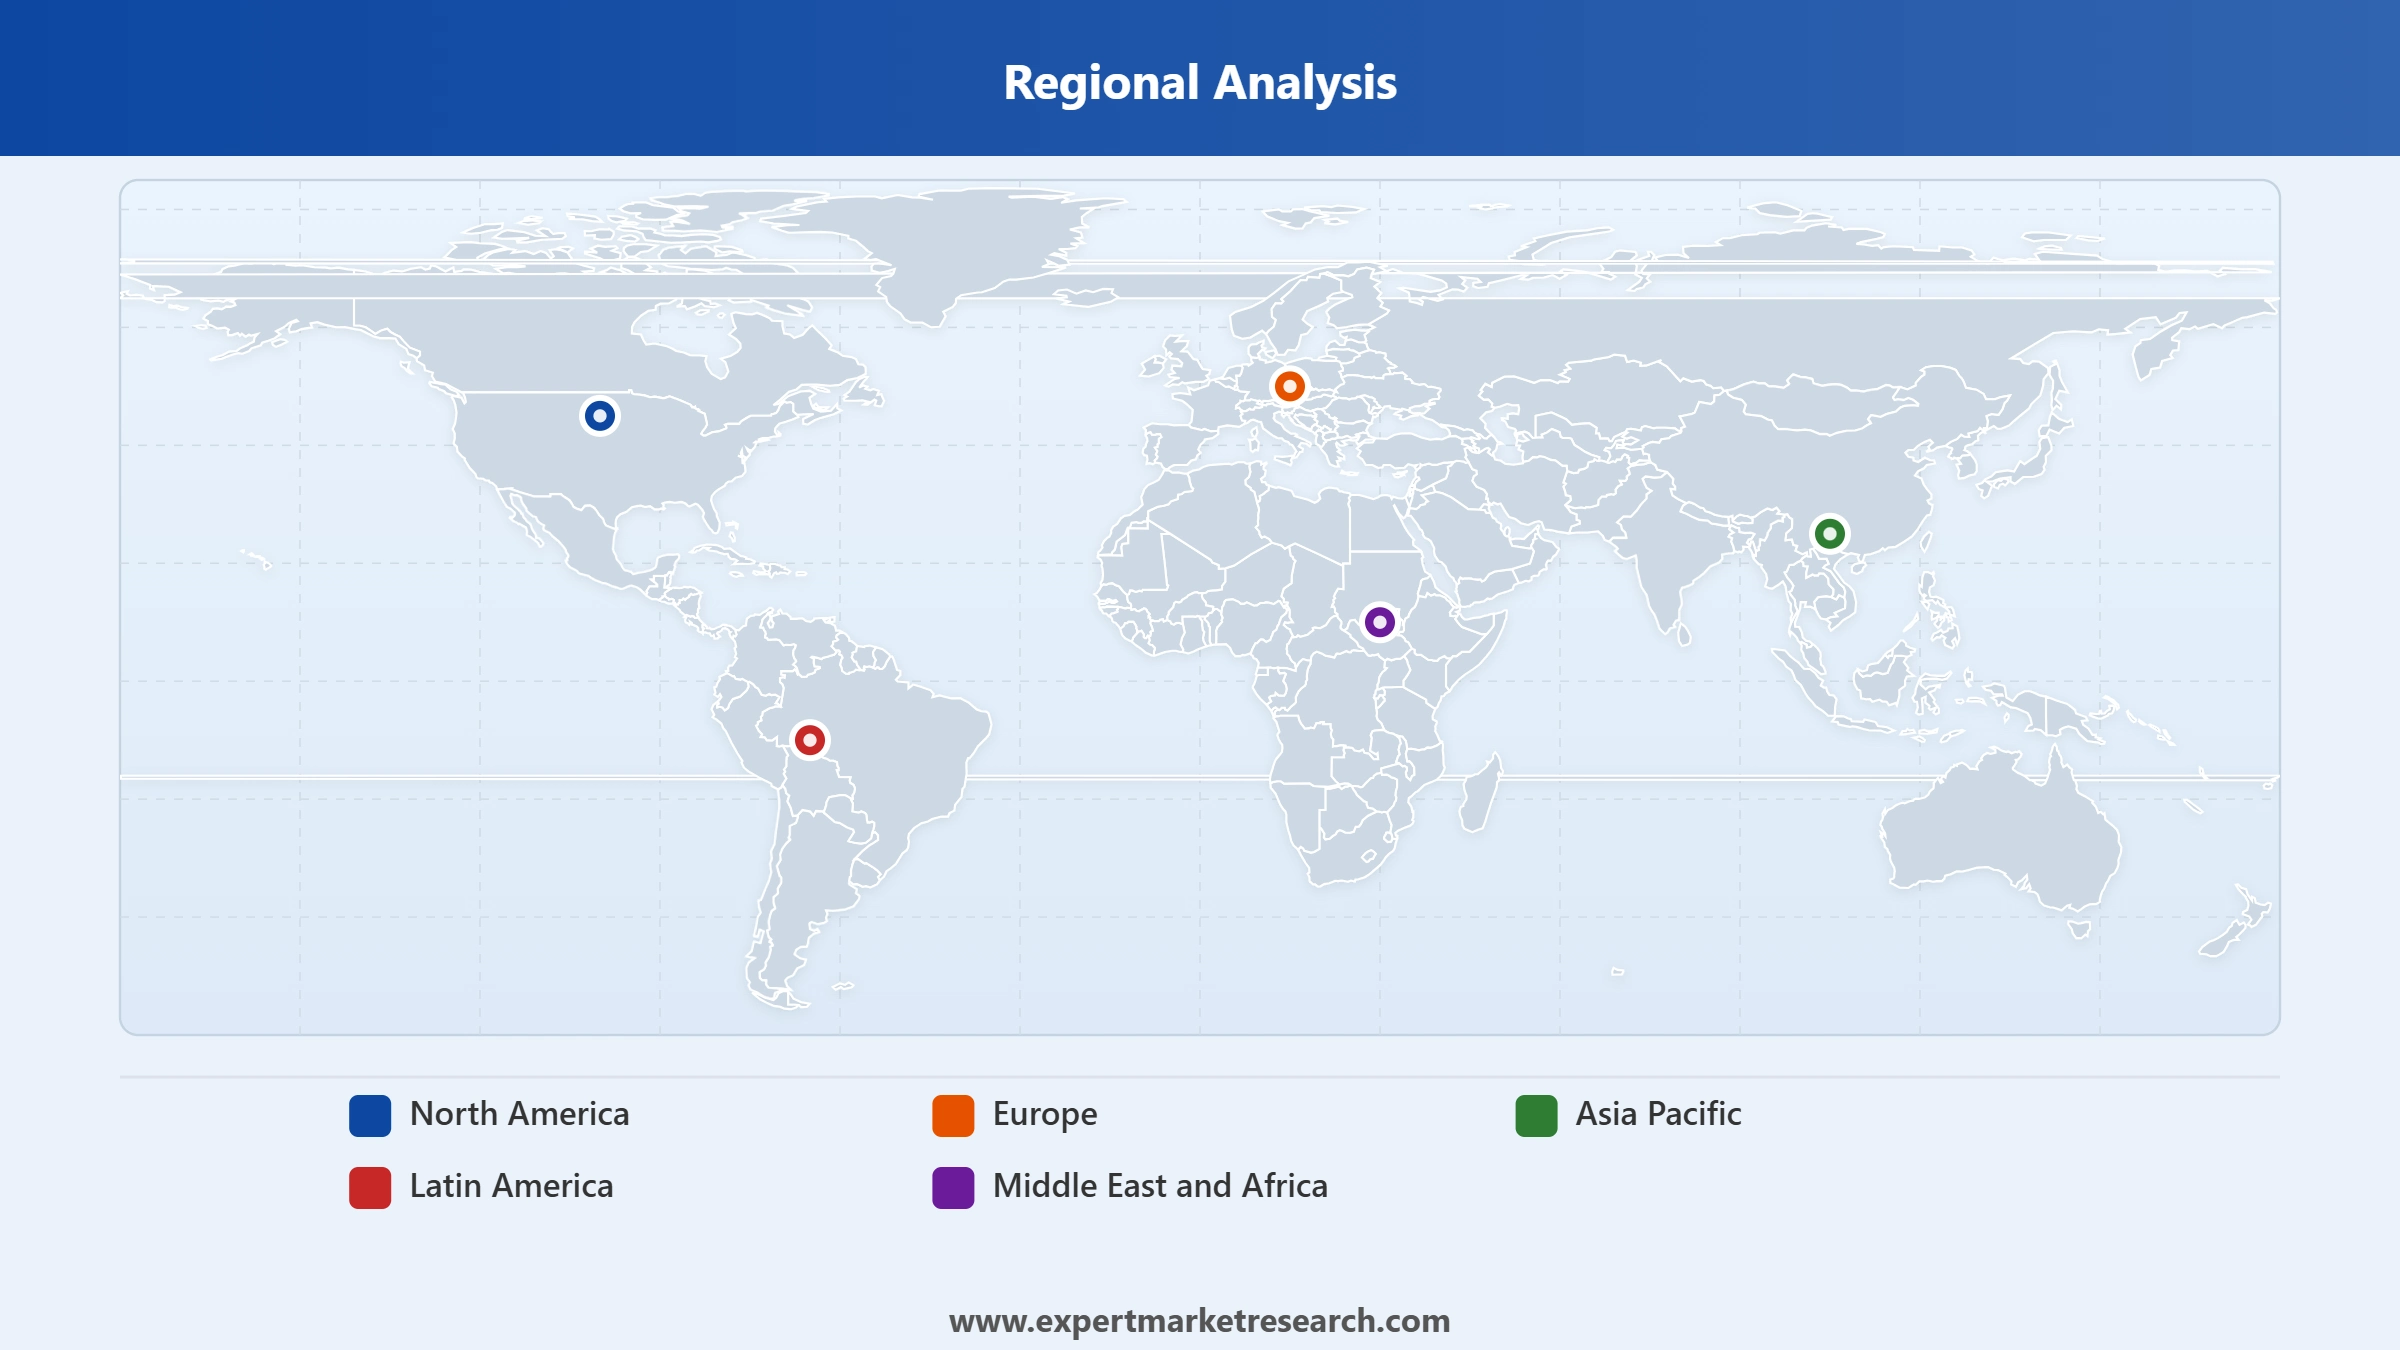
Market Breakup by Region


Read more about this report - REQUEST FREE SAMPLE COPY IN PDF
2D/3D security holograms are expected to account for a significant security holograms market share owing to their increasing utilisation in brand protection and product authentication due to growing threat of counterfeit production because of their difficult to replicate nature. The colourful effect of these holograms comes from the microstructures in the holographic tape that causes diffraction of the light hitting the surface. They utilise holographic optical elements for generating two images for passively separating the exit pupils for the two wavelengths.
Read more about this report - REQUEST FREE SAMPLE COPY IN PDF
North America is anticipated to witness significant growth over the forecast period. This growth can be attributed to the rising requirement for anti-counterfeit devices for preventing the sale of fake electrical and medical products, strong presence of market players, and high adoption rates of advanced technologies in the region. The growing threat of falsified and substandard medical products is boosting the security holograms market demand in North America. These products often fail to treat the intended diseases and can also cause harm to the patients.
Read more about this report - REQUEST FREE SAMPLE COPY IN PDF
The comprehensive EMR report provides an in-depth assessment of the market based on the Porter's five forces model along with giving a SWOT analysis. The report gives a detailed analysis of the following key players in the market, covering their competitive landscape and latest developments like mergers, acquisitions, investments, and expansion plans.
Crown Roll Leaf, Inc., headquartered in New Jersey, United States, is known for supplying and manufacturing hot stamping foil products and user-friendly holograms. The holograms include security holograms, retail holograms, and stock holograms, among others.
NovaVision, LLC was founded in 1994 and is headquartered in Ohio, United States. The company specialises in tamper evident stickers, mechanical security seals, and hologram labels, among others to combat cargo theft, tampering, and counterfeiting.
Demax Holograms Plc is one of the largest manufacturers of holographic products used for document security. The company is dedicated towards providing cost-efficient and high-quality products to their customers. Demax was founded in 1995 and is headquartered in Sofia City, Bulgaria.
*Please note that this is only a partial list; the complete list of key players is available in the full report. Additionally, the list of key players can be customized to better suit your needs.*
Other security holograms market key players include Security Hologram, LLC, Matrix Technologies, AFC Technology Co. Ltd., UPM Corporation, HV Hologram, BEP Hologram AS, and Hira Holovision, among others.
Upto 15% Off
USD
$2499 $2249
$3999 $3599
$4999 $4249
$5999 $5099


*While we strive to always give you current and accurate information, the numbers depicted on the website are indicative and may differ from the actual numbers in the main report. At Expert Market Research, we aim to bring you the latest insights and trends in the market. Using our analyses and forecasts, stakeholders can understand the market dynamics, navigate challenges, and capitalize on opportunities to make data-driven strategic decisions.*
The market reached a value of approximately USD 6.31 Billion in 2025.
The market is projected to grow at a CAGR of 8.00% between 2026 and 2035.
The market is estimated to witness a healthy growth in the forecast period of 2026-2035 to reach USD 13.62 Billion by 2035.
The major market drivers include increased requirement for supply chain management and growing threat of tampering.
The key trends fuelling the growth of the market include rising demand from the pharmaceutical sector for eliminating the threat of counterfeits and increasing product duplication in the electronics sector.
The major regions in the market are North America, Europe, the Asia Pacific, Latin America, and the Middle East and Africa.
The end uses of security holograms include packaging, apparel, currency, passport, and documents, among others.
The key players in the market are Crown Roll Leaf, Inc., NovaVision, LLC, Demax Holograms Plc, Security Hologram, LLC, Matrix Technologies, AFC Technology Co. Ltd., UPM Corporation, HV Hologram, BEP Hologram AS, and Hira Holovision, among others.
Explore our key highlights of the report and gain a concise overview of key findings, trends, and actionable insights that will empower your strategic decisions.
| REPORT FEATURES | DETAILS |
| Base Year | 2025 |
| Historical Period | 2019-2025 |
| Forecast Period | 2026-2035 |
| Scope of the Report |
Historical and Forecast Trends, Industry Drivers and Constraints, Historical and Forecast Market Analysis by Segment:
|
| Breakup by Product Type |
|
| Breakup by Material |
|
| Breakup by End Use |
|
| Breakup by Region |
|
| Market Dynamics |
|
| Competitive Landscape |
|
| Companies Covered |
|
Datasheet
One User
USD 2,499
USD 2,249
tax inclusive*
Single User License
One User
USD 3,999
USD 3,599
tax inclusive*
Five User License
Five User
USD 4,999
USD 4,249
tax inclusive*
Corporate License
Unlimited Users
USD 5,999
USD 5,099
tax inclusive*
*Please note that the prices mentioned below are starting prices for each bundle type. Kindly contact our team for further details.*
Flash Bundle
Small Business Bundle
Growth Bundle
Enterprise Bundle
*Please note that the prices mentioned below are starting prices for each bundle type. Kindly contact our team for further details.*
Flash Bundle
Number of Reports: 3
20%
tax inclusive*
Small Business Bundle
Number of Reports: 5
25%
tax inclusive*
Growth Bundle
Number of Reports: 8
30%
tax inclusive*
Enterprise Bundle
Number of Reports: 10
35%
tax inclusive*
How To Order

Select License Type
Choose the right license for your needs and access rights.

Click on ‘Buy Now’
Add the report to your cart with one click and proceed to register.

Select Mode of Payment
Choose a payment option for a secure checkout. You will be redirected accordingly.
Strategic Solutions for Informed Decision-Making
Gain insights to stay ahead and seize opportunities.

Get insights & trends for a competitive edge.

Track prices with detailed trend reports.

Analyse trade data for supply chain insights.

Leverage cost reports for smart savings

Enhance supply chain with partnerships.

Connect For More Information
Our expert team of analysts will offer full support and resolve any queries regarding the report, before and after the purchase.
Our expert team of analysts will offer full support and resolve any queries regarding the report, before and after the purchase.
We employ meticulous research methods, blending advanced analytics and expert insights to deliver accurate, actionable industry intelligence, staying ahead of competitors.
Our skilled analysts offer unparalleled competitive advantage with detailed insights on current and emerging markets, ensuring your strategic edge.
We offer an in-depth yet simplified presentation of industry insights and analysis to meet your specific requirements effectively.


