

Consumer Insights
Uncover trends and behaviors shaping consumer choices today
Procurement Insights
Optimize your sourcing strategy with key market data
Industry Stats
Stay ahead with the latest trends and market analysis.
The global server operating system market is projected to expand at a CAGR of around 12.10% during the forecast period of 2026-2035. The market growth is being driven by increasing enterprise demand for cloud computing infrastructure and the accelerating adoption of virtualisation technologies across data centres. The expanding deployment of hybrid cloud environments, along with the rapid integration of AI and machine learning workloads into enterprise server platforms, is further supporting market expansion. Additionally, growing investments in digital transformation and scalable IT infrastructure are expected to contribute significantly to the growth of the market over the forecast period.
Compound Annual Growth Rate
12.1%
2026-2035
Read more about this report - REQUEST FREE SAMPLE COPY IN PDF
The global server operating system market is advancing rapidly on the back of cloud migration momentum, the maturation of virtualisation technologies, and deepening AI integration across enterprise IT infrastructure. Established vendors are investing in AI-native server OS capabilities, hybrid cloud management tools, and enhanced security architectures to capture value from these structural shifts. Competitive dynamics are intensifying as open-source platforms gain enterprise credibility and cloud-native OS offerings redefine how organisations deploy and manage server infrastructure.
At IBM Think 2026, IBM and AWS showcased expanded agentic AI collaborations covering mainframe modernisation, autonomous databases, and enterprise automation. IBM watsonx Orchestrate gained native Amazon Bedrock integration, while IBM Bob introduced AI-powered code generation for enterprise server infrastructure.
Amazon Web Services added Windows Server 2025 support to Amazon WorkSpaces in March 2026, enabling cloud-hosted virtual desktop environments with enhanced security features including TPM 2.0, UEFI Secure Boot, and Credential Guard for enterprise customers globally.
Red Hat launched Red Hat Enterprise Linux 10.1 and 9.7 in November 2025, introducing AI-powered offline Linux management, quantum threat mitigation, and enhanced hybrid cloud support to address growing enterprise IT infrastructure complexity across global server deployments.
Microsoft released Windows Server 2025 to general availability in November 2024, delivering enhanced security features including Credential Guard enabled by default, Azure Arc integration, and improved Hyper-V capabilities designed for AI workloads and large-scale virtualisation environments.
Accelerating enterprise cloud migration continues to reshape the global server operating system market. Organisations are increasingly shifting from traditional on-premises infrastructure to scalable managed environments, with cloud-native workloads demanding robust, containerisation-ready server OS platforms that support flexible hybrid deployment models.
Linux is consolidating its dominant position in the global server operating system market. Its open-source architecture, cost efficiency, and native compatibility with containerisation tools like Kubernetes make it the preferred foundation for cloud-native and modern enterprise data centre environments globally.
Artificial intelligence workloads are reshaping server operating system development. Vendors including Microsoft, Red Hat, and IBM are embedding AI-native capabilities into server OS platforms, enabling automated management, predictive maintenance, and intelligent resource allocation across hybrid cloud and on-premises enterprise environments.
Virtual server environments are increasingly displacing physical infrastructure across the global server operating system market. The scalability benefits of virtualisation, combined with growing container orchestration adoption, are making virtual server OS deployments the standard choice for modern data centre workloads.
Asia Pacific's rapid data centre expansion is driving demand across the global server operating system market. Government digital infrastructure initiatives in China, India, and Southeast Asia are accelerating server OS adoption, positioning the region as the market's fastest-growing geography through 2035.
The report of Expert Market Research’s titled “Global Server Operating System Market Report and Forecast 2026-2035” offers a detailed analysis of the market based on the following segments:
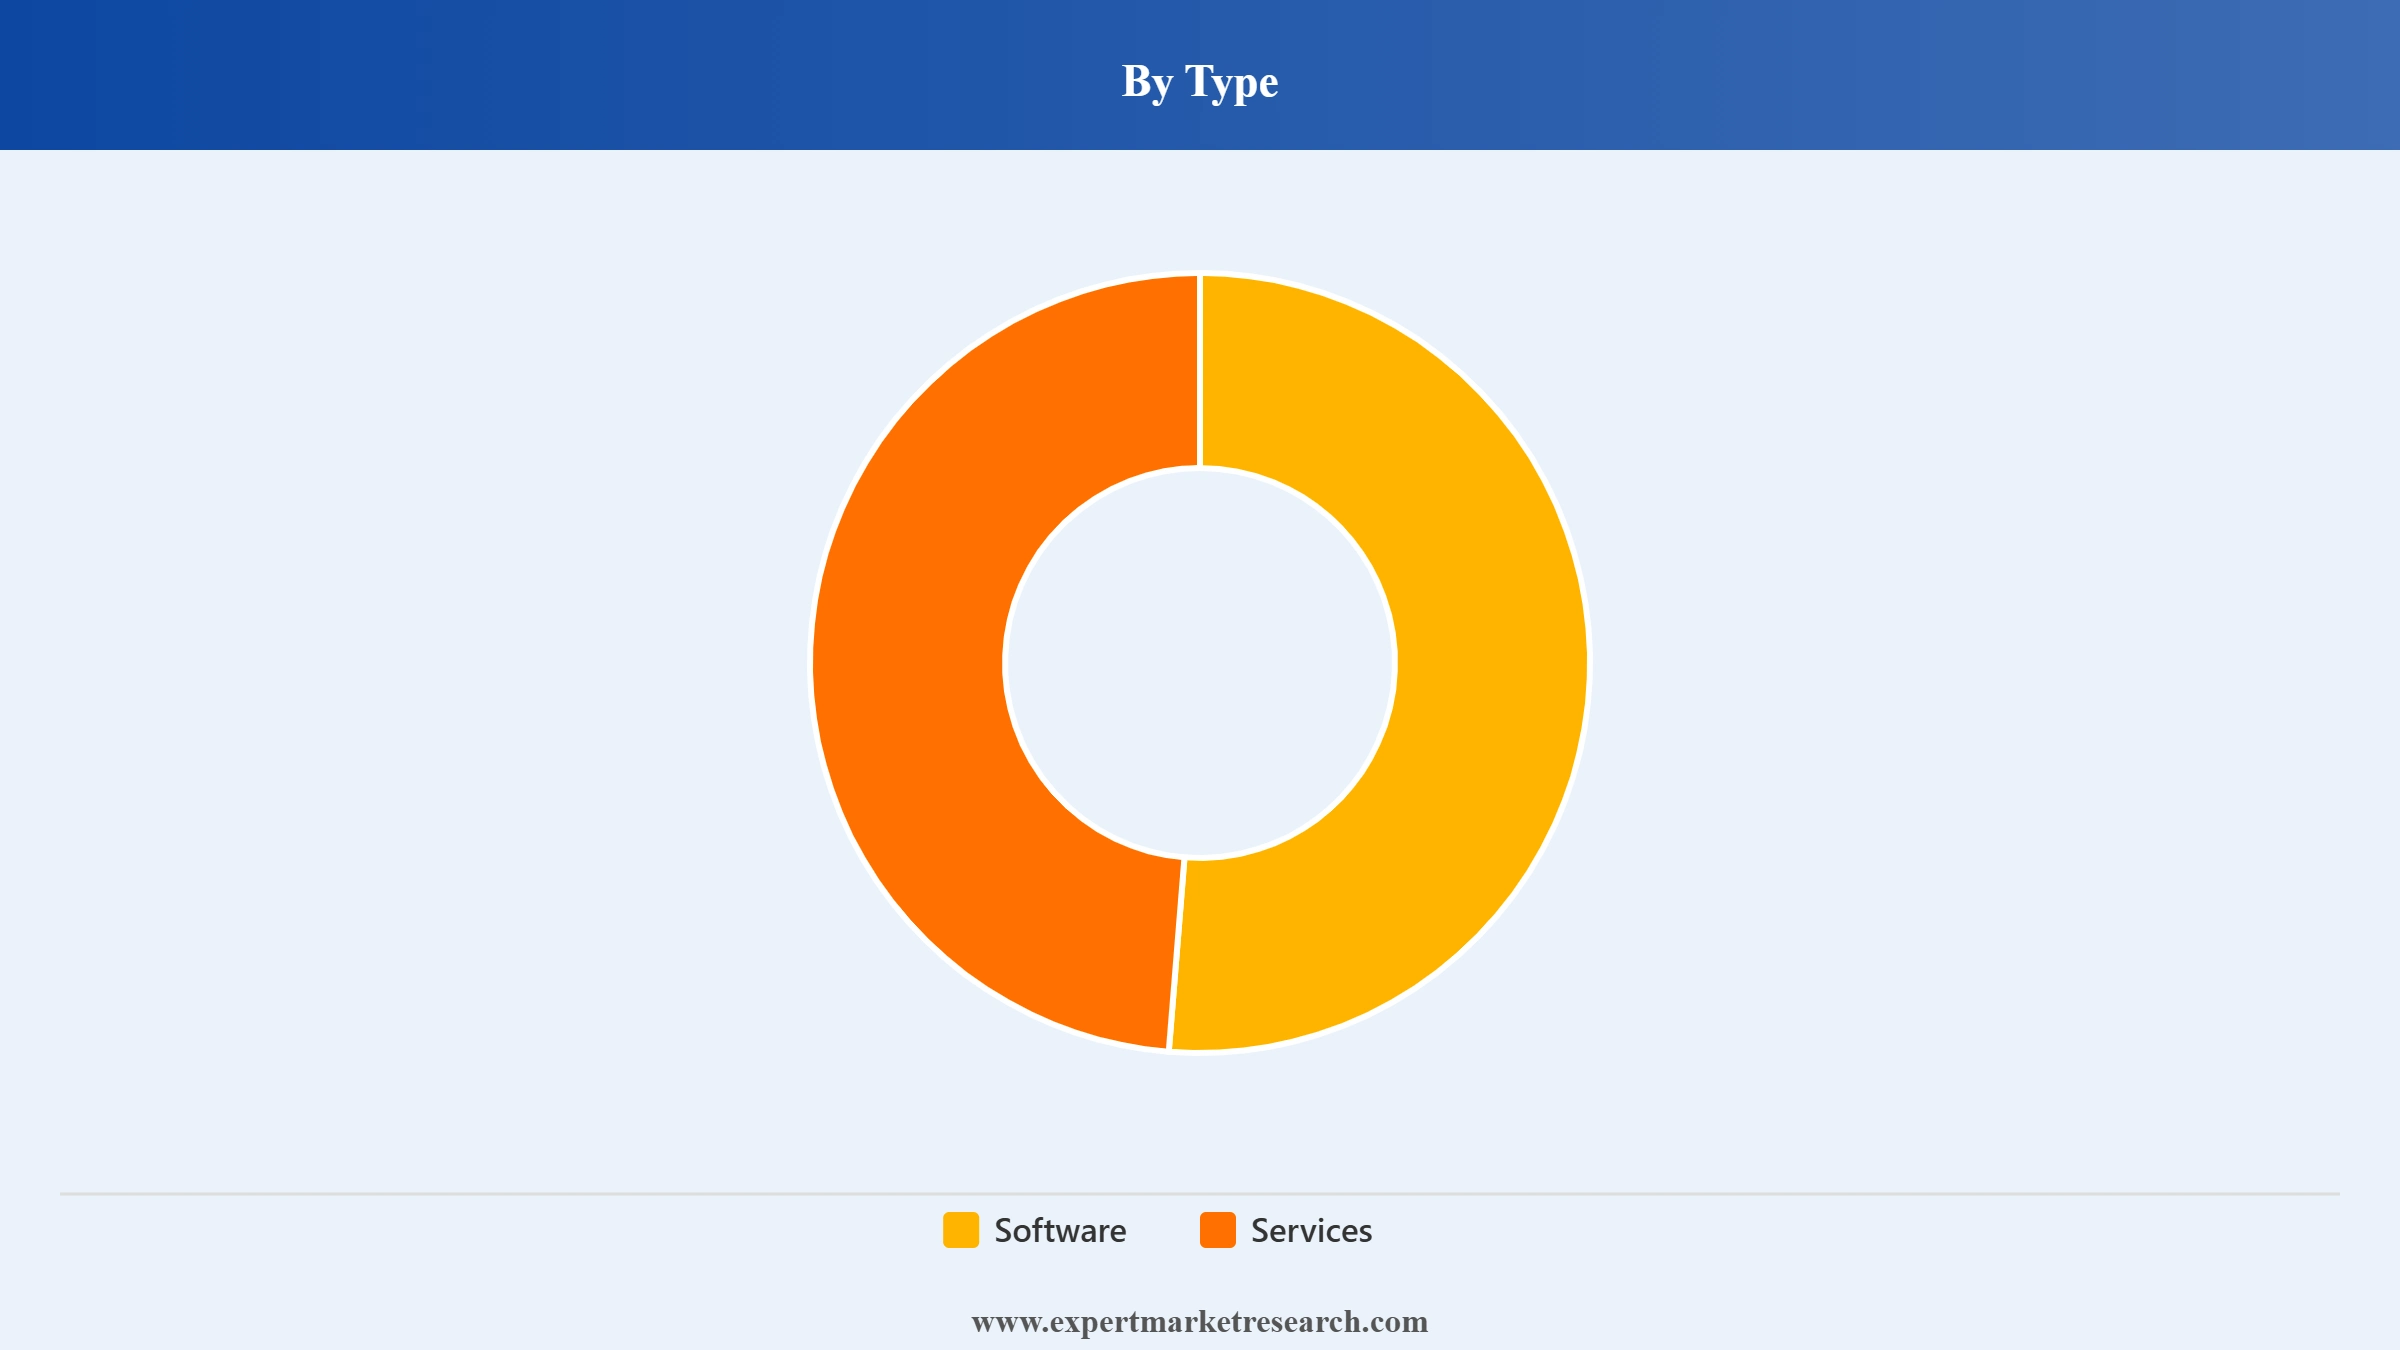
Market Breakup by Type
Key Insight: Software is the dominant component in the global server operating system market, commanding the largest revenue share as enterprises invest in licensed and subscription-based OS platforms to manage complex, multi-cloud workloads. The services segment, covering deployment, support, and managed services, is growing steadily as organisations seek ongoing technical expertise to optimise server OS environments. Growing adoption of as-a-service models is reshaping how software licensing revenue is captured across the market.
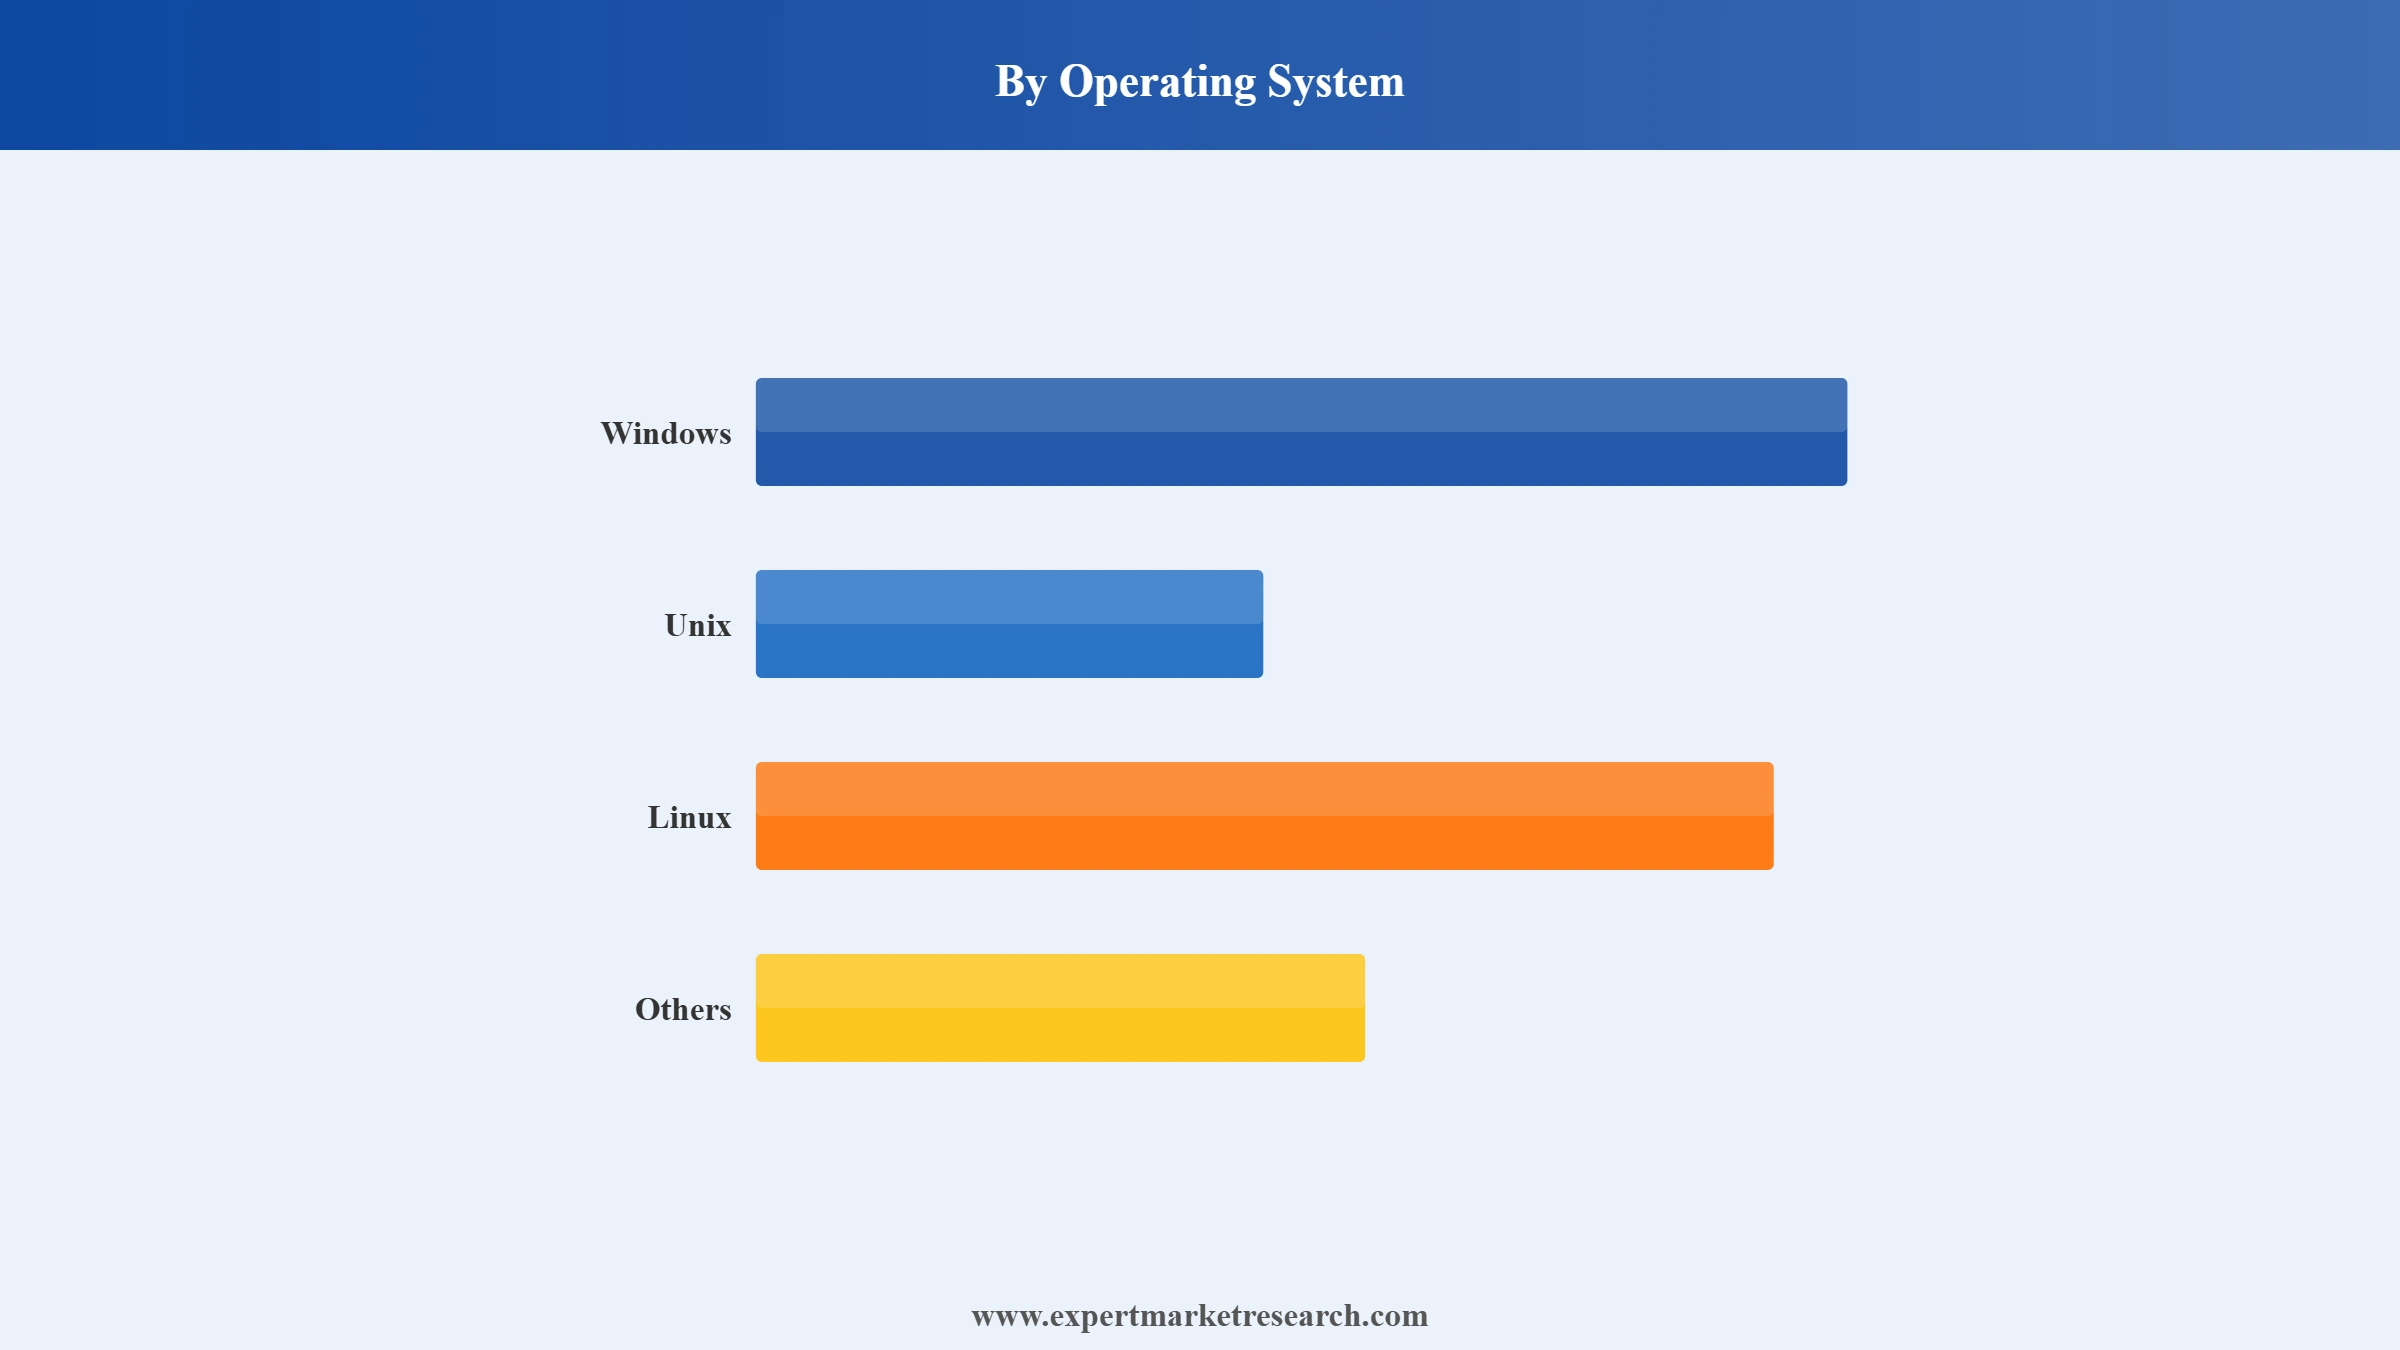
Market Breakup by Operating System
Key Insight: Linux holds the leading position in the global server operating system market, favoured for its open-source flexibility, security credentials, and native compatibility with containerisation and cloud-native architectures. Windows Server maintains a significant enterprise presence, particularly in Microsoft-centric IT environments and hybrid cloud deployments. Unix retains a foothold in high-performance computing and legacy enterprise applications, while demand for alternative OS platforms is growing with AI-driven infrastructure requirements.
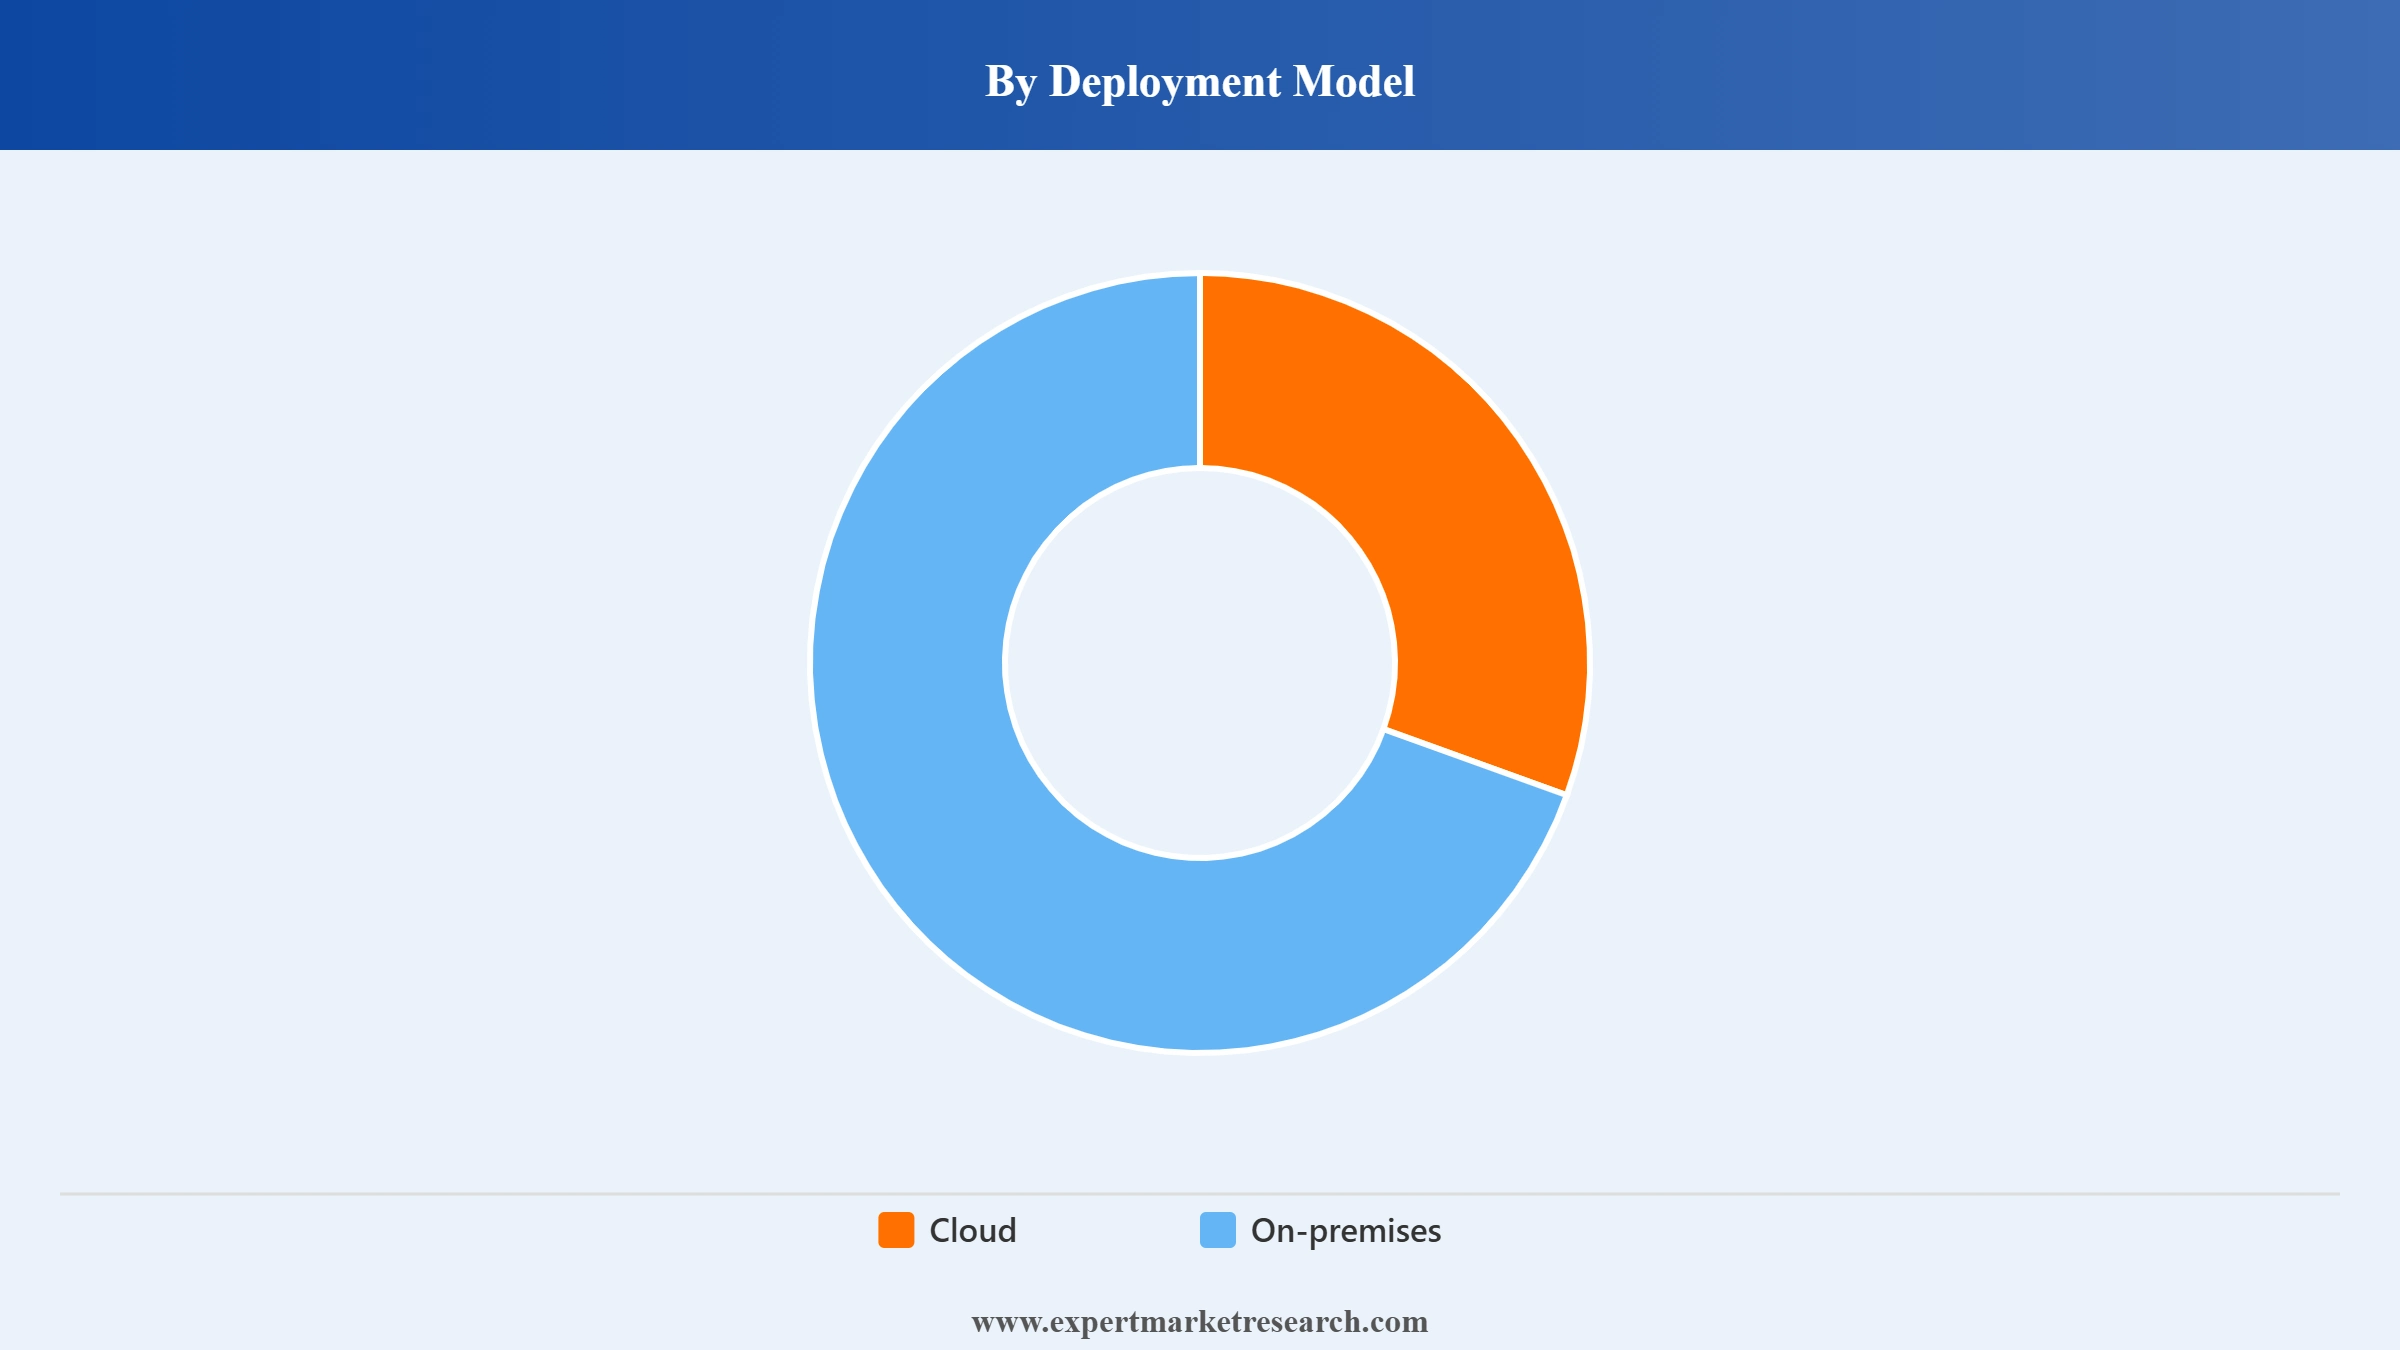
Market Breakup by Deployment Model
Key Insight: Cloud deployment has emerged as the fastest-growing segment of the global server operating system market, driven by enterprise migration to scalable, managed platforms and the economics of pay-as-you-go infrastructure. On-premises deployment retains a significant market share, particularly among regulated industries such as banking, healthcare, and government that require complete data sovereignty and control over their server infrastructure.
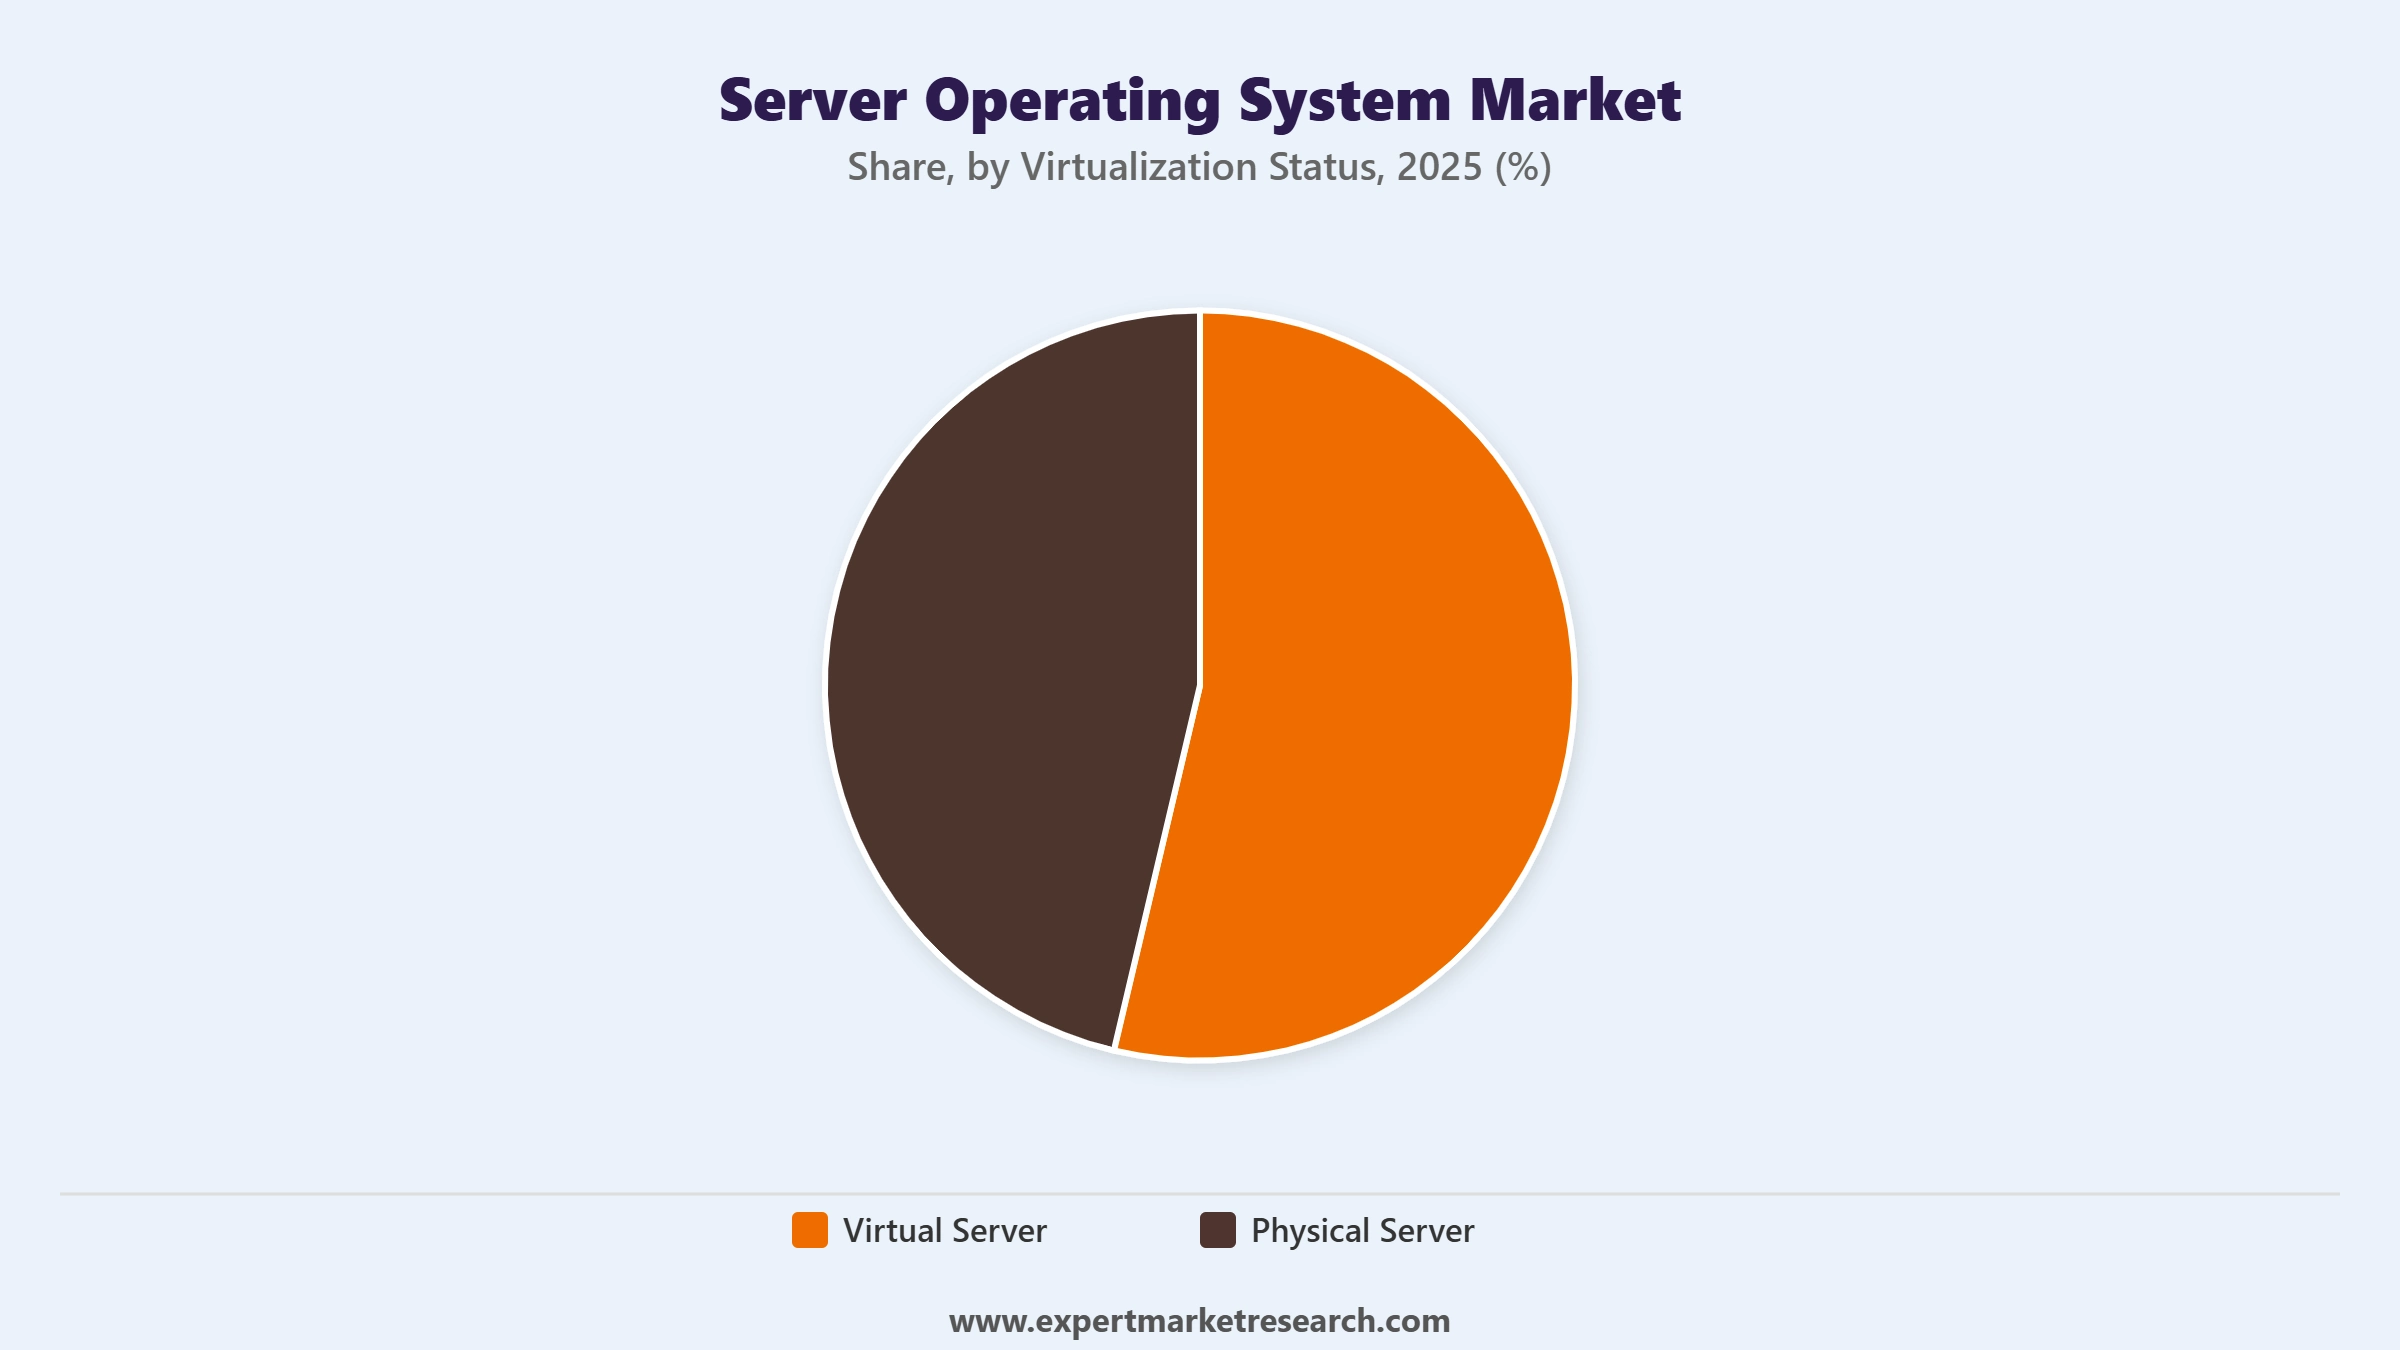
Market Breakup by Virtualization Status
Key Insight: Virtual server deployment dominates the global server operating system market, driven by the cost efficiency, scalability, and workload flexibility that virtualisation provides over dedicated physical hardware. The ability to run multiple workloads on shared infrastructure and rapidly provision new server environments has made virtual deployments the standard approach. Physical server OS deployments remain relevant for latency-sensitive, high-performance applications requiring dedicated hardware resources.
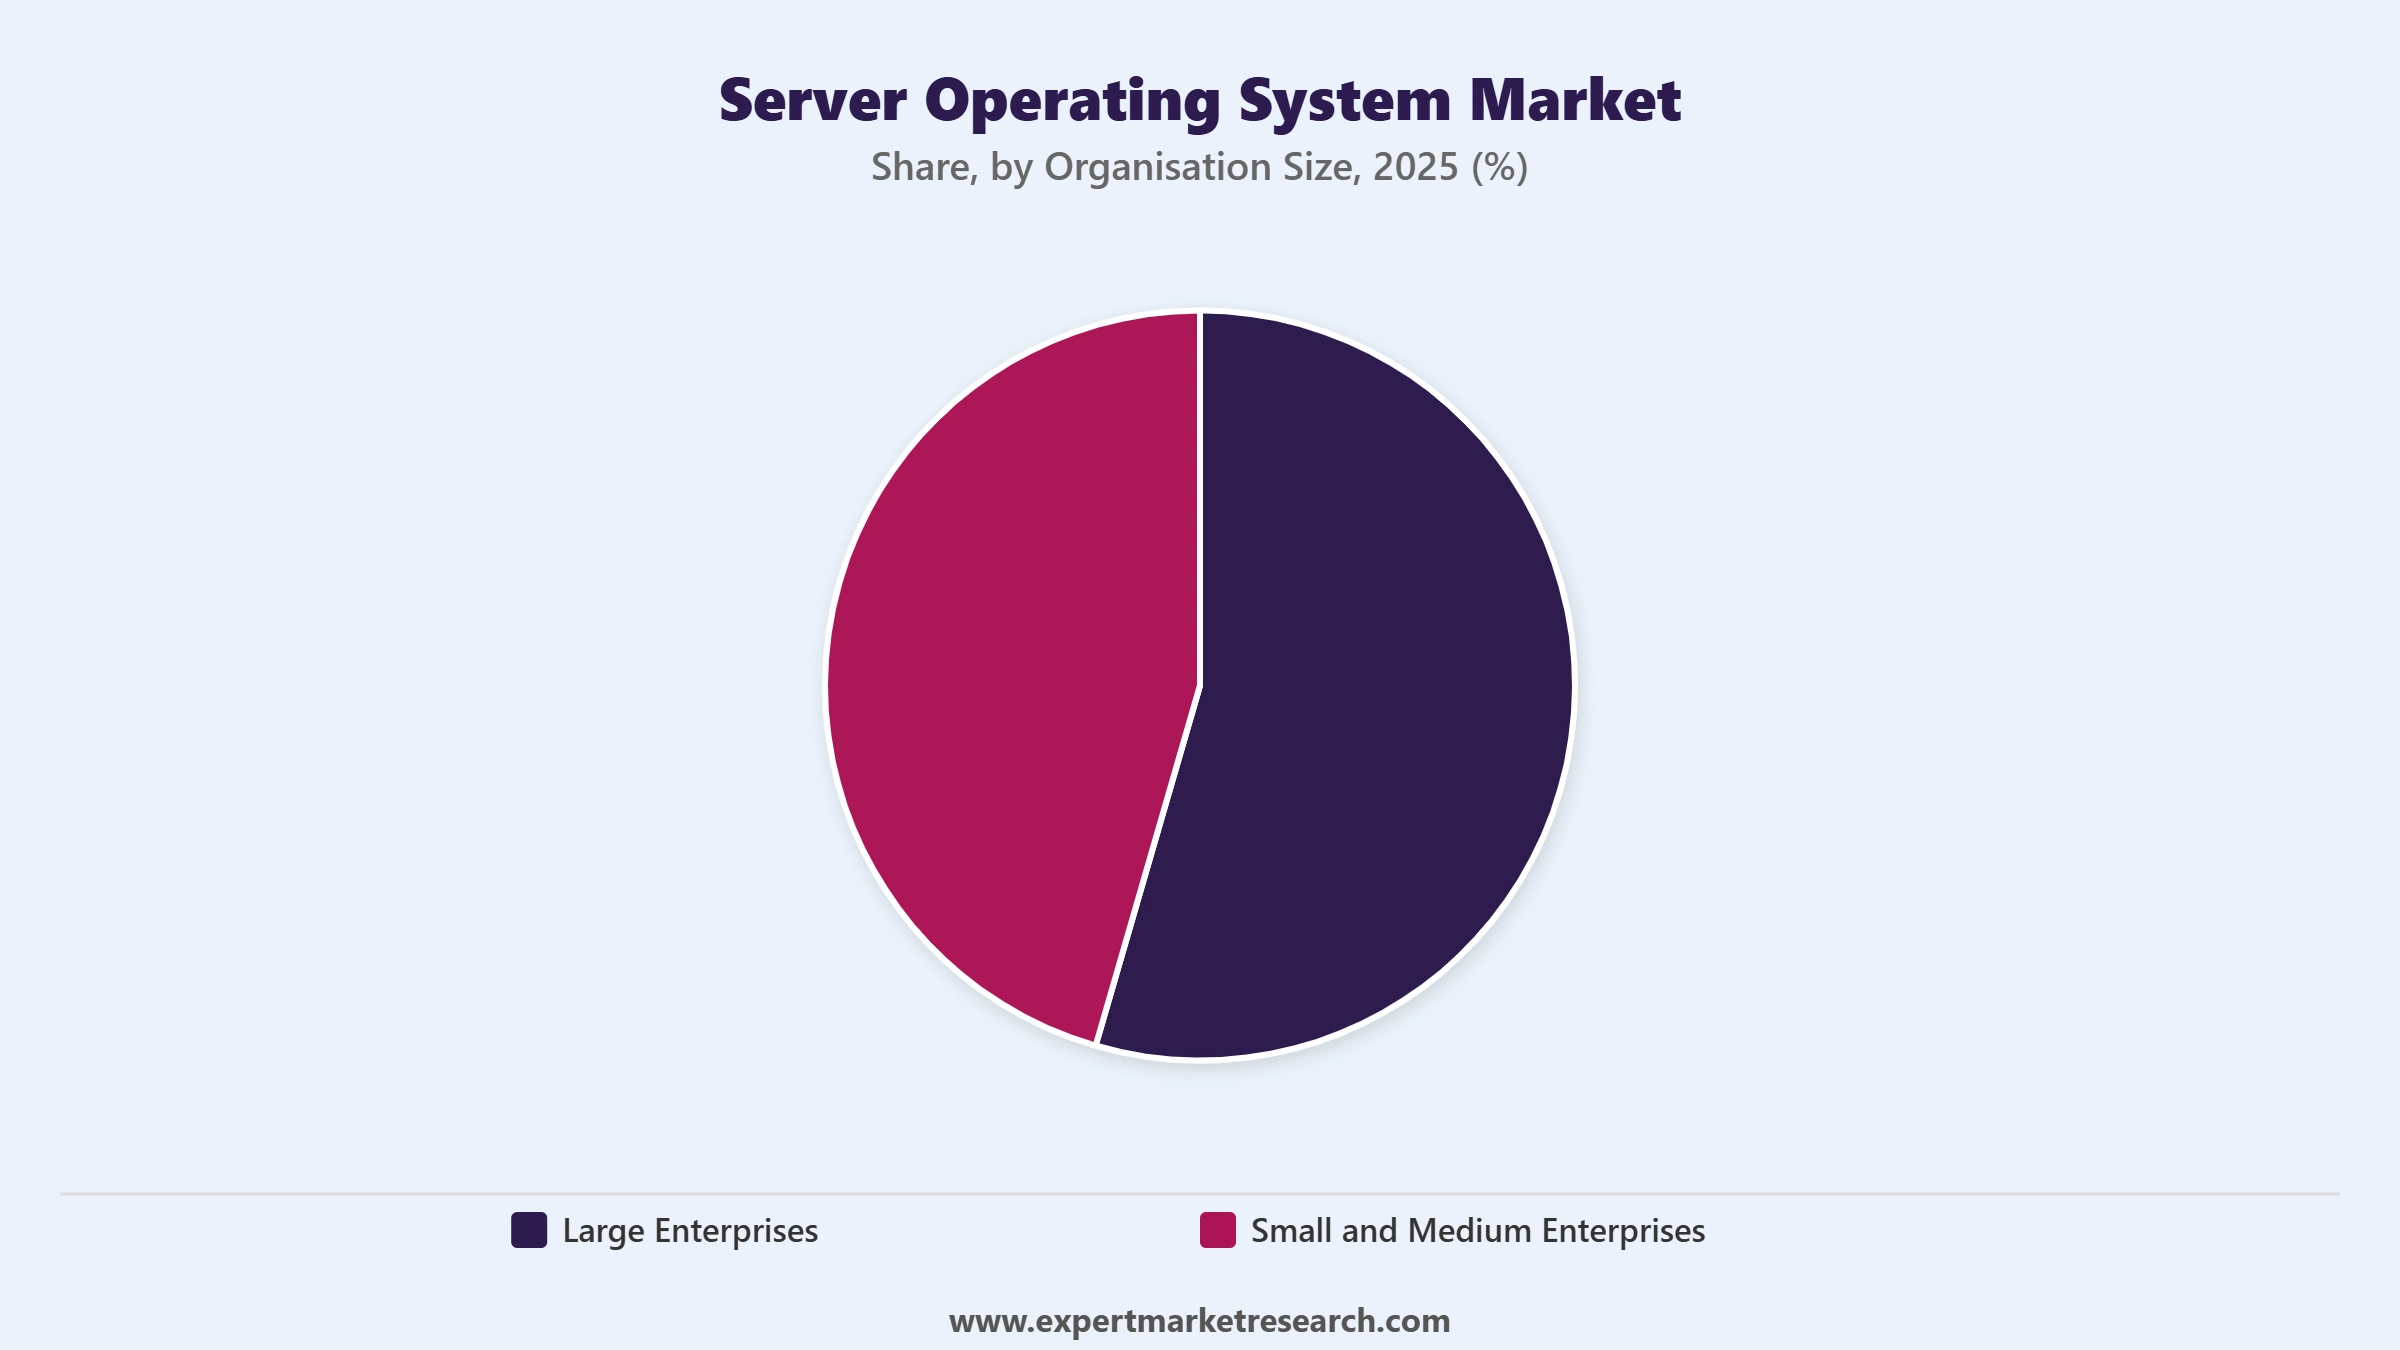
Market Breakup by Organisation Size
Key Insight:Large enterprises account for the dominant share of the global server operating system market, supported by complex IT infrastructure requirements, high server OS licensing volumes, and substantial investments in data centre and cloud infrastructure. Small and medium enterprises are an increasingly important growth segment, with affordable subscription models and managed cloud server OS services lowering the barrier to enterprise-grade infrastructure for smaller organisations.
Market Breakup by Region
Key Insight:North America leads the global server operating system market, underpinned by the world's most developed cloud computing ecosystem, high enterprise IT spending, and the headquarters of major server OS vendors. Europe holds a significant market position supported by regulatory-driven IT modernisation and strong enterprise cloud adoption. Asia Pacific is the fastest-growing region, with rapid data centre expansion, government digital investments, and growing enterprise cloud migration across China, India, and Southeast Asian markets.


Read more about this report - REQUEST FREE SAMPLE COPY IN PDF
By Type, software dominates the market due to its critical role in enterprise workload management and licensing revenue
Software commands the largest share of the global server operating system market, driven by the centralisation of IT workloads onto managed, licensed platforms across enterprise and cloud environments. Server OS software serves as the foundational layer for all digital operations, making it an indispensable investment for organisations of all sizes. The shift toward subscription and cloud-based licensing models has broadened the addressable base and supported sustained revenue growth for software vendors operating in this space.
Read more about this report - REQUEST FREE SAMPLE COPY IN PDF
The services segment, encompassing deployment, integration, technical support, and managed server OS services, is growing as enterprise IT environments become more complex. Organisations managing hybrid cloud deployments, multi-OS infrastructure, and AI-driven workloads increasingly rely on professional and managed services to optimise performance and maintain compliance. This trend is particularly pronounced among large enterprises undertaking complex server infrastructure modernisation programmes across geographies and business units.
By Operating System, Linux accounts for the dominant share of the market due to its open-source flexibility and cost-effectiveness
Linux has consolidated its position as the dominant server OS in the global server operating system market, accounting for the largest share of cloud and data centre deployments. Its open-source architecture, zero licensing cost, superior security posture, and native compatibility with container orchestration tools such as Kubernetes have made it the platform of choice for cloud providers, enterprise IT teams, and application developers. Red Hat Enterprise Linux, Ubuntu Server, and SUSE Linux are the leading commercial distributions reinforcing this dominance.
Read more about this report - REQUEST FREE SAMPLE COPY IN PDF
Windows Server maintains a substantial and commercially significant share of the global server operating system market, particularly in organisations with Microsoft-centric IT stacks, Active Directory environments, and legacy application dependencies. In November 2024, Microsoft's general availability release of Windows Server 2025 introduced improved AI workload support, Azure Arc integration, and enhanced security capabilities including Credential Guard by default, reinforcing Windows Server's position in hybrid cloud and enterprise data centre environments.
By Deployment Model, cloud accounts for the fastest-growing share of the market due to enterprise migration to scalable managed infrastructure
Cloud deployment is the fastest-growing segment in the global server operating system market, reflecting the broad enterprise transition from capital-intensive on-premises infrastructure to flexible, consumption-based cloud environments. Hyperscale providers such as AWS, Microsoft Azure, and Google Cloud have built deep integrations between their cloud platforms and server OS offerings, simplifying migration and management. The cloud segment's growth is particularly strong in sectors such as technology, financial services, and retail, where scalability and agility are competitive priorities.
Read more about this report - REQUEST FREE SAMPLE COPY IN PDF
On-premises deployment retains a significant share of the global server operating system market, underpinned by sectors where data residency, regulatory compliance, and latency requirements make cloud migration complex. Industries including banking, defence, and healthcare continue to invest in on-premises server OS deployments. The hybrid cloud model, which combines on-premises infrastructure with cloud resources, is emerging as the dominant architectural choice, effectively sustaining demand for both deployment models simultaneously across enterprise environments.
By Virtualization Status, virtual server deployments dominate the market due to scalability, cost efficiency, and workload flexibility
Virtual server deployments dominate the global server operating system market, reflecting the broad enterprise adoption of virtualisation as the standard approach to server infrastructure management. The ability to run multiple isolated OS instances on shared physical hardware maximises resource utilisation, reduces hardware costs, and accelerates workload provisioning. Leading virtualisation platforms from VMware, Microsoft Hyper-V, and KVM have made virtual server OS deployments the default infrastructure model across enterprise data centres and cloud environments globally.
Read more about this report - REQUEST FREE SAMPLE COPY IN PDF
Physical server OS deployments retain market relevance in use cases where dedicated hardware performance, low latency, and full hardware control are non-negotiable. High-frequency trading platforms, real-time analytics systems, and certain defence and government applications continue to rely on physical server OS deployments. Growth in edge computing is also creating new demand for physical server OS deployments in latency-sensitive environments outside traditional data centre settings, providing a meaningful counterweight to the broader virtualisation trend.
By Organisation Size, large enterprises account for the dominant share of the market due to complex infrastructure requirements and high licensing volumes
Large enterprises are the dominant consumers of server operating systems in the global server operating system market, driven by the scale and complexity of their IT infrastructure needs. These organisations typically manage hundreds or thousands of server instances across on-premises, hybrid, and multi-cloud environments, generating substantial licensing and services revenue for OS vendors. The growing adoption of enterprise-grade features such as high availability, disaster recovery, and centralised management tools further reinforces large enterprise spending in this segment.
Read more about this report - REQUEST FREE SAMPLE COPY IN PDF
Small and medium enterprises represent a growing segment of the global server operating system market, supported by the expansion of affordable cloud-based and subscription server OS models. Managed server OS services delivered through cloud platforms allow SMEs to access enterprise-grade capabilities without the capital investment of on-premises infrastructure. This democratisation of server OS access is accelerating SME adoption across emerging markets in Asia Pacific, Latin America, and the Middle East, where digital transformation programmes are expanding the SME IT market.
North America dominates the market due to advanced IT infrastructure, enterprise cloud leadership, and presence of major OS vendors
North America holds the largest share of the global server operating system market, underpinned by the world's most mature cloud computing ecosystem, high enterprise technology investment, and the headquarters of leading server OS vendors including Microsoft, Red Hat, Amazon Web Services, and IBM. The region's enterprise IT sector is characterised by rapid cloud migration, extensive virtualisation adoption, and growing demand for AI-optimised server infrastructure. North America's regulatory environment, including sector-specific compliance requirements in finance and healthcare, also sustains demand for secure, certified server OS platforms.
Read more about this report - REQUEST FREE SAMPLE COPY IN PDF
Asia Pacific is the fastest-growing region in the global server operating system market, driven by aggressive data centre investment, government-backed digitalisation programmes, and rapidly expanding cloud adoption. China's national digital infrastructure mandate, India's expanding technology sector, and Southeast Asia's growing cloud penetration are collectively generating sustained demand for enterprise server OS platforms. Major cloud providers are significantly expanding their regional data centre footprints to serve this growth, and the increasing preference for open-source Linux distributions is reducing entry barriers for new enterprise deployments across the region.
The global server operating system market features a concentrated competitive structure, dominated by a small group of technology giants that collectively hold the majority of market value. Microsoft, Red Hat, Amazon Web Services, and IBM are the market leaders, each bringing differentiated OS platforms and extensive enterprise ecosystems. Competition is primarily driven by cloud integration depth, enterprise support capabilities, security architecture, and AI workload compatibility.
The competitive dynamics of the server operating system market are evolving rapidly as open-source platforms gain enterprise credibility and cloud-native architectures challenge traditional OS licensing models. Vendors are investing heavily in AI-powered management capabilities, container orchestration support, and hybrid cloud tooling to maintain enterprise relevance. Strategic partnerships, such as the IBM and AWS collaboration showcased at IBM Think 2026, reflect the growing importance of ecosystem integration as a competitive differentiator in this market.
Founded in 1975 and headquartered in Redmond, Washington, Microsoft Corporation is the world's largest software company. Its Windows Server platform is one of the most widely deployed enterprise server OS solutions globally, covering on-premises, hybrid, and Azure cloud environments. Microsoft's Azure-first strategy and Hyper-V virtualisation capabilities reinforce its dominant position across enterprise data centres and hybrid cloud infrastructure worldwide.
Founded in 1993 and headquartered in Raleigh, North Carolina, Red Hat is the world's leading provider of enterprise open-source software. As an IBM subsidiary since 2019, Red Hat's flagship Red Hat Enterprise Linux platform is the most widely deployed commercial Linux distribution, serving cloud providers, financial institutions, and enterprise data centres across more than 40 countries globally.
Founded in 2006 and headquartered in Seattle, Washington, Amazon Web Services is the world's leading cloud computing platform. AWS offers Amazon Linux, a purpose-built server OS optimised for AWS environments, alongside broad support for Linux distributions and Windows Server. AWS's hyperscale infrastructure and consumption-based model have made it the dominant cloud server OS deployment platform globally.
Founded in 1911 and headquartered in Armonk, New York, IBM is one of the world's oldest and most diversified technology companies. In the server operating system market, IBM provides AIX Unix and z/OS for enterprise mainframe environments, and its Red Hat subsidiary delivers enterprise Linux. IBM's hybrid cloud strategy spans IBM Cloud and Red Hat OpenShift across global enterprise markets.
Other key players in the market are Apple Inc., Google LLC, Dell Inc., Hewlett Packard Enterprise Development LP, and Others.
*Please note that this is only a partial list; the complete list of key players is available in the full report. Additionally, the list of key players can be customized to better suit your needs.*
Stay ahead of the rapidly evolving global server operating system landscape with Expert Market Research's comprehensive 2026 report. Gain access to detailed data on cloud adoption trends, OS platform competition, virtualisation dynamics, and the regions and enterprise segments driving the strongest growth. Whether you are evaluating a market entry, benchmarking your competitive position, or building an investment case, this report provides the depth and precision you need. Download your free sample today and explore the opportunities within this high-growth global server operating system sector.
Upto 15% Off
USD
$2499 $2249
$3999 $3599
$4999 $4249
$5999 $5099


*While we strive to always give you current and accurate information, the numbers depicted on the website are indicative and may differ from the actual numbers in the main report. At Expert Market Research, we aim to bring you the latest insights and trends in the market. Using our analyses and forecasts, stakeholders can understand the market dynamics, navigate challenges, and capitalize on opportunities to make data-driven strategic decisions.*
The market is projected to grow at a CAGR of 12.10% between 2026 and 2035.
The major drivers of the market are rising demand for cloud computing, adoption of virtualisation, and cost efficiency of server operating systems.
The key trends guiding the growth of the market include growth of hybrid cloud environments, emergence of IoT, and increasing adoption of Linux operating systems.
The major regions in the server operating system market are North America, Latin America, the Middle East and Africa, Europe, and the Asia Pacific.
Software and services are the different types of server operating systems in the market.
Windows, Unix, and Linux, among others are the various operating systems in the market.
Based on virtualisation status, the market is segmented into virtual server and physical server.
A server operating system is considered to be important as it enables people to share equipment as well as resources such as fax machines, internet access, and printers.
Server operating systems are used mainly to manage all the software and hardware present in a network.
The key players include Microsoft Corporation, Red Hat, Inc., Apple Inc., Google LLC, Amazon Web Services, Inc., IBM Corporation, Dell Inc., Hewlett Packard Enterprise Development LP, and Others.
Explore our key highlights of the report and gain a concise overview of key findings, trends, and actionable insights that will empower your strategic decisions.
| REPORT FEATURES | DETAILS |
| Base Year | 2025 |
| Historical Period | 2019-2025 |
| Forecast Period | 2026-2035 |
| Scope of the Report |
Historical and Forecast Trends, Industry Drivers and Constraints, Historical and Forecast Market Analysis by Segment:
|
| Breakup by Type |
|
| Breakup by Operating System |
|
| Breakup by Deployment Model |
|
| Breakup by Virtualization Status |
|
| Breakup by Organisation Size |
|
| Breakup by Region |
|
| Market Dynamics |
|
| Competitive Landscape |
|
| Companies Covered |
|
Datasheet
One User
USD 2,499
USD 2,249
tax inclusive*
Single User License
One User
USD 3,999
USD 3,599
tax inclusive*
Five User License
Five User
USD 4,999
USD 4,249
tax inclusive*
Corporate License
Unlimited Users
USD 5,999
USD 5,099
tax inclusive*
*Please note that the prices mentioned below are starting prices for each bundle type. Kindly contact our team for further details.*
Flash Bundle
Small Business Bundle
Growth Bundle
Enterprise Bundle
*Please note that the prices mentioned below are starting prices for each bundle type. Kindly contact our team for further details.*
Flash Bundle
Number of Reports: 3
20%
tax inclusive*
Small Business Bundle
Number of Reports: 5
25%
tax inclusive*
Growth Bundle
Number of Reports: 8
30%
tax inclusive*
Enterprise Bundle
Number of Reports: 10
35%
tax inclusive*
How To Order

Select License Type
Choose the right license for your needs and access rights.

Click on ‘Buy Now’
Add the report to your cart with one click and proceed to register.

Select Mode of Payment
Choose a payment option for a secure checkout. You will be redirected accordingly.
Strategic Solutions for Informed Decision-Making
Gain insights to stay ahead and seize opportunities.

Get insights & trends for a competitive edge.

Track prices with detailed trend reports.

Analyse trade data for supply chain insights.

Leverage cost reports for smart savings

Enhance supply chain with partnerships.

Connect For More Information
Our expert team of analysts will offer full support and resolve any queries regarding the report, before and after the purchase.
Our expert team of analysts will offer full support and resolve any queries regarding the report, before and after the purchase.
We employ meticulous research methods, blending advanced analytics and expert insights to deliver accurate, actionable industry intelligence, staying ahead of competitors.
Our skilled analysts offer unparalleled competitive advantage with detailed insights on current and emerging markets, ensuring your strategic edge.
We offer an in-depth yet simplified presentation of industry insights and analysis to meet your specific requirements effectively.


