

Consumer Insights
Uncover trends and behaviors shaping consumer choices today
Procurement Insights
Optimize your sourcing strategy with key market data
Industry Stats
Stay ahead with the latest trends and market analysis.
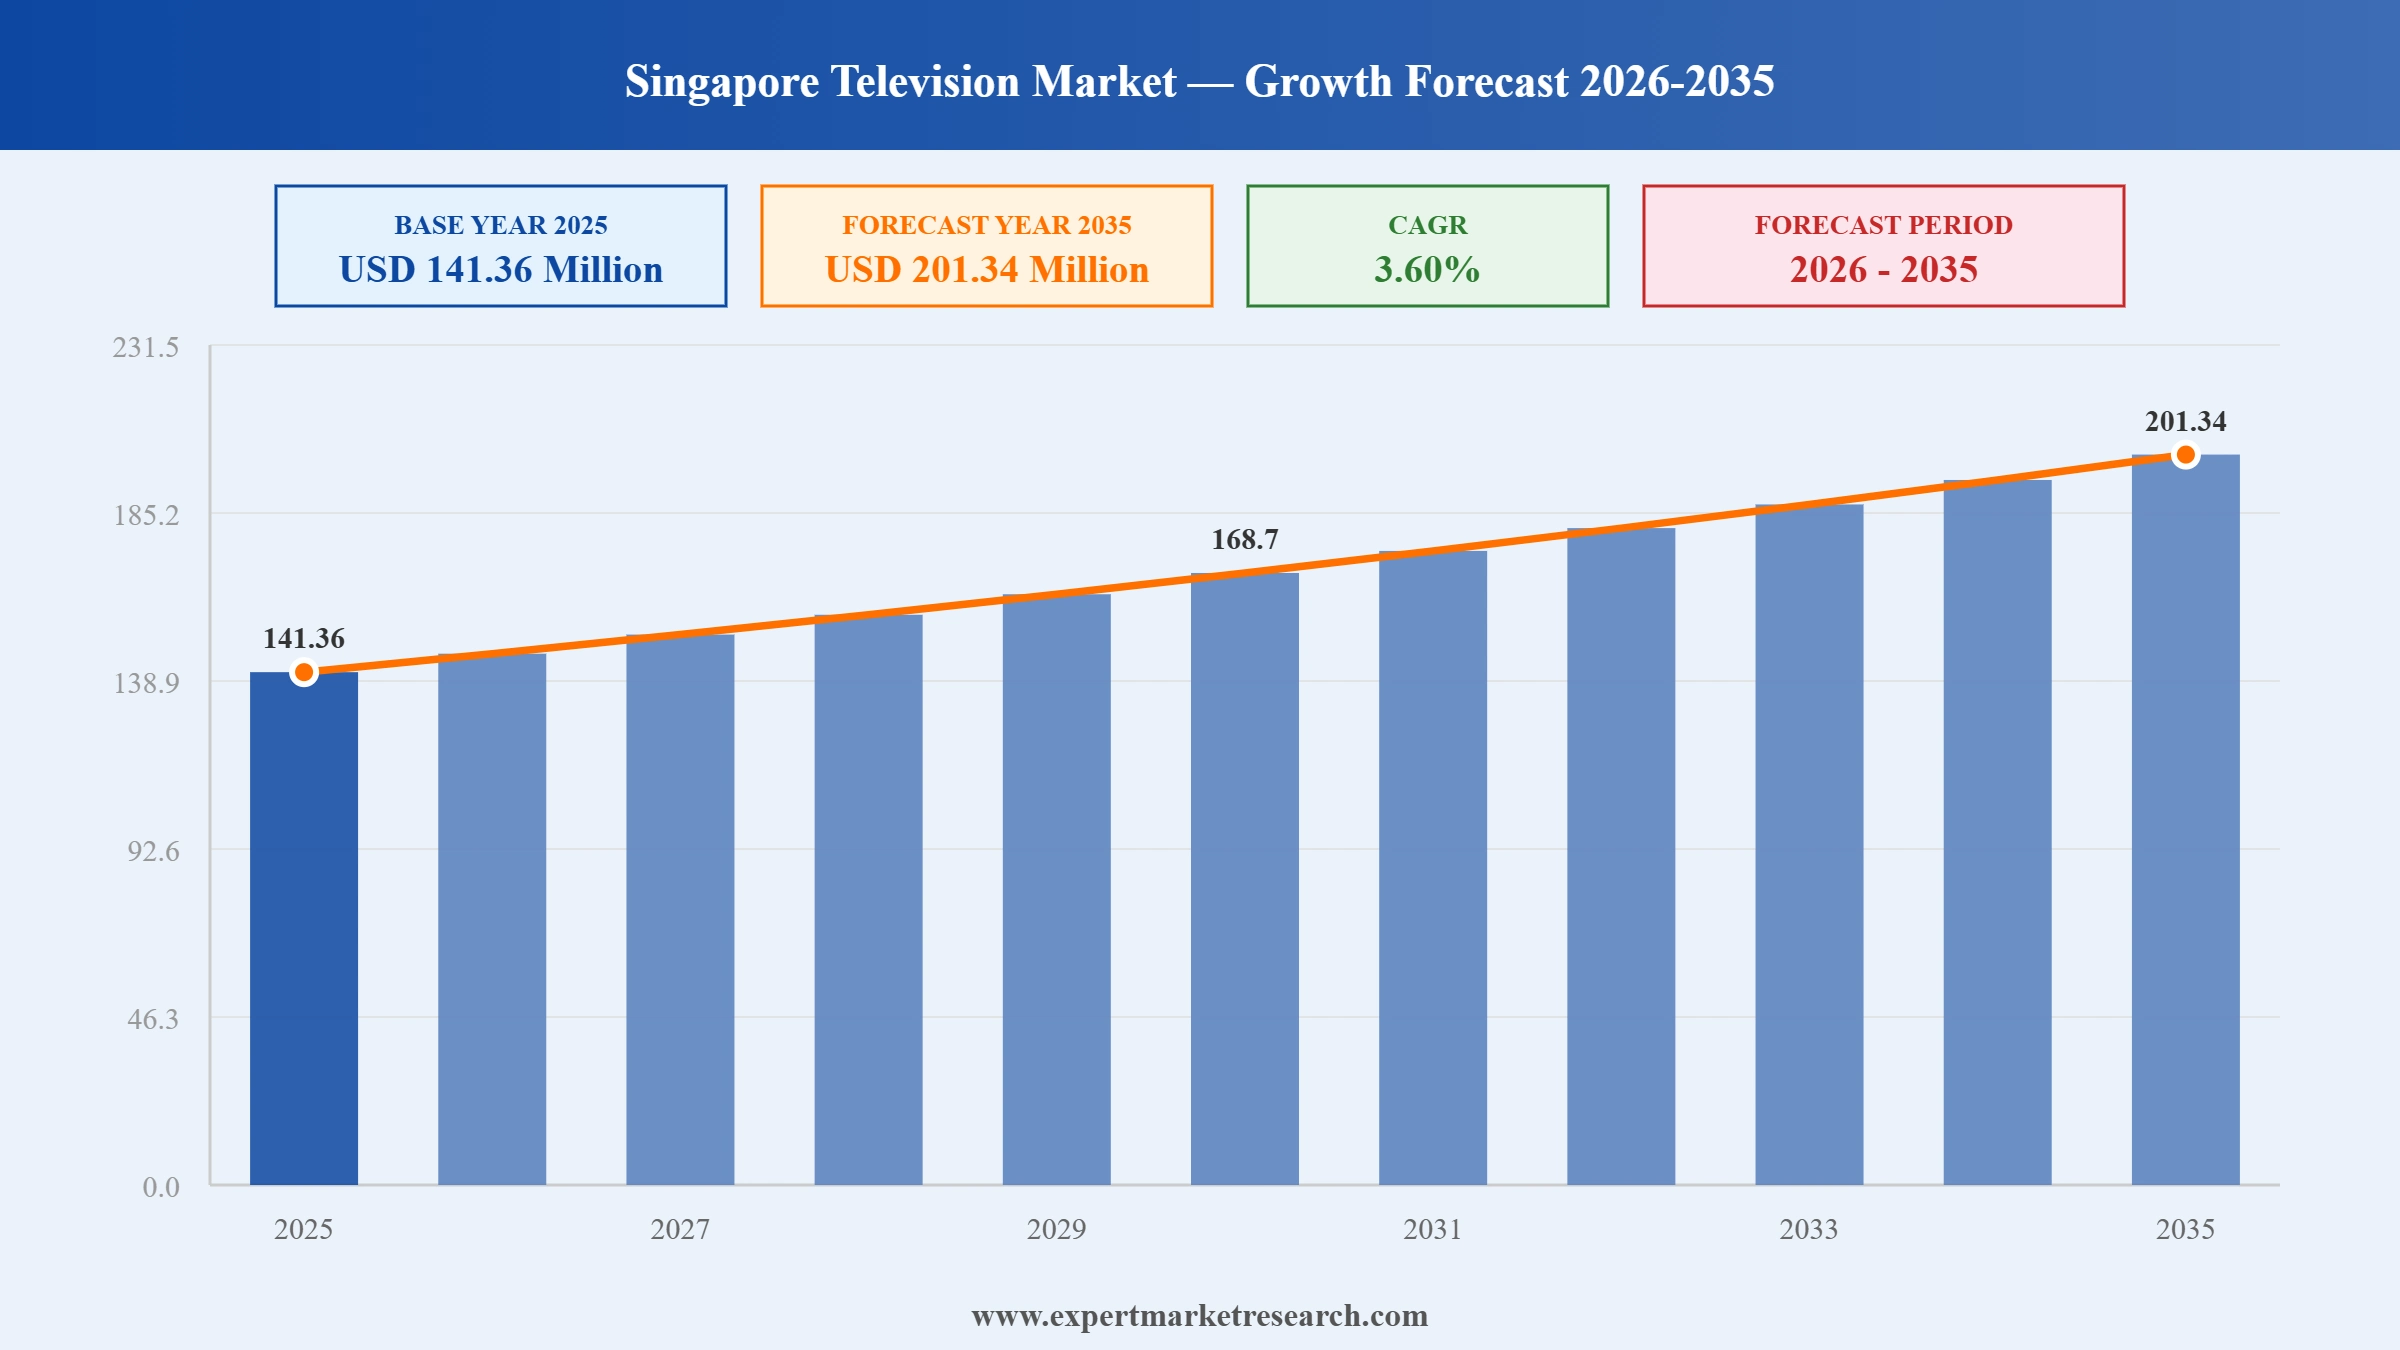
The Singapore television market reached a value of USD 141.36 Million in 2025 and is projected to expand at a CAGR of around 3.60% during the forecast period of 2026-2035. Singapore's highly digitally connected and tech-savvy population, the rapid adoption of Smart TV technology driven by the growing popularity of streaming services including Netflix, Disney+, Max, and local platforms, the growing demand for OLED and QLED large-screen televisions, and the dominance of online television distribution channels are driving Singapore television market growth. The market is expected to reach USD 201.34 Million by 2035.
Read more about this report - REQUEST FREE SAMPLE COPY IN PDF
The Singapore television market is driven by Singapore's highly tech-savvy population, the rapid adoption of Smart TV technology for streaming services, the growing popularity of Korean dramas and international content among younger Singapore consumers, the dominance of online distribution channels, and the rapid innovation in OLED, QLED, and Mini-LED display technologies from Samsung, LG, Sony, and Panasonic.
LG Electronics Singapore announced in March 2025 that LG had led global OLED TV shipments for 12 consecutive years with over 52.4% OLED market share in 2024, earning recognition from CNET Asia, HWM+HardwareZone, Red Dot Design, and GfK No. 1 Awards. LG serves Singapore through its OLED evo, QNED evo, and NanoCell Smart TV series.
Samsung marked 19 consecutive years as the global television market leader in March 2025 with approximately 17% global unit share and 49.6% of the premium TV segment. Samsung unveiled Vision AI at CES 2025 for AI-powered personalised viewing and serves Singapore through its The Frame, QLED, Neo QLED, and OLED series.
Samsung unveiled Vision AI at CES 2025 in January 2025, analysing user preferences and habits to deliver personalised Smart TV experiences across The Frame, Neo QLED, QLED, and OLED series. Samsung expanded its Art Store to Neo QLED and QLED models, supporting Singapore streaming services including Netflix, Amazon Prime Video, and Disney+.
Warner Bros. Discovery's Max platform launched in Singapore in November 2024, bringing HBO, Discovery, CNN, and DC content to Singapore Smart TVs. The growing range of premium streaming services including Netflix, Disney+, Amazon Prime Video, Apple TV+, Viu, and Max is driving Smart TV adoption and upgrade demand.
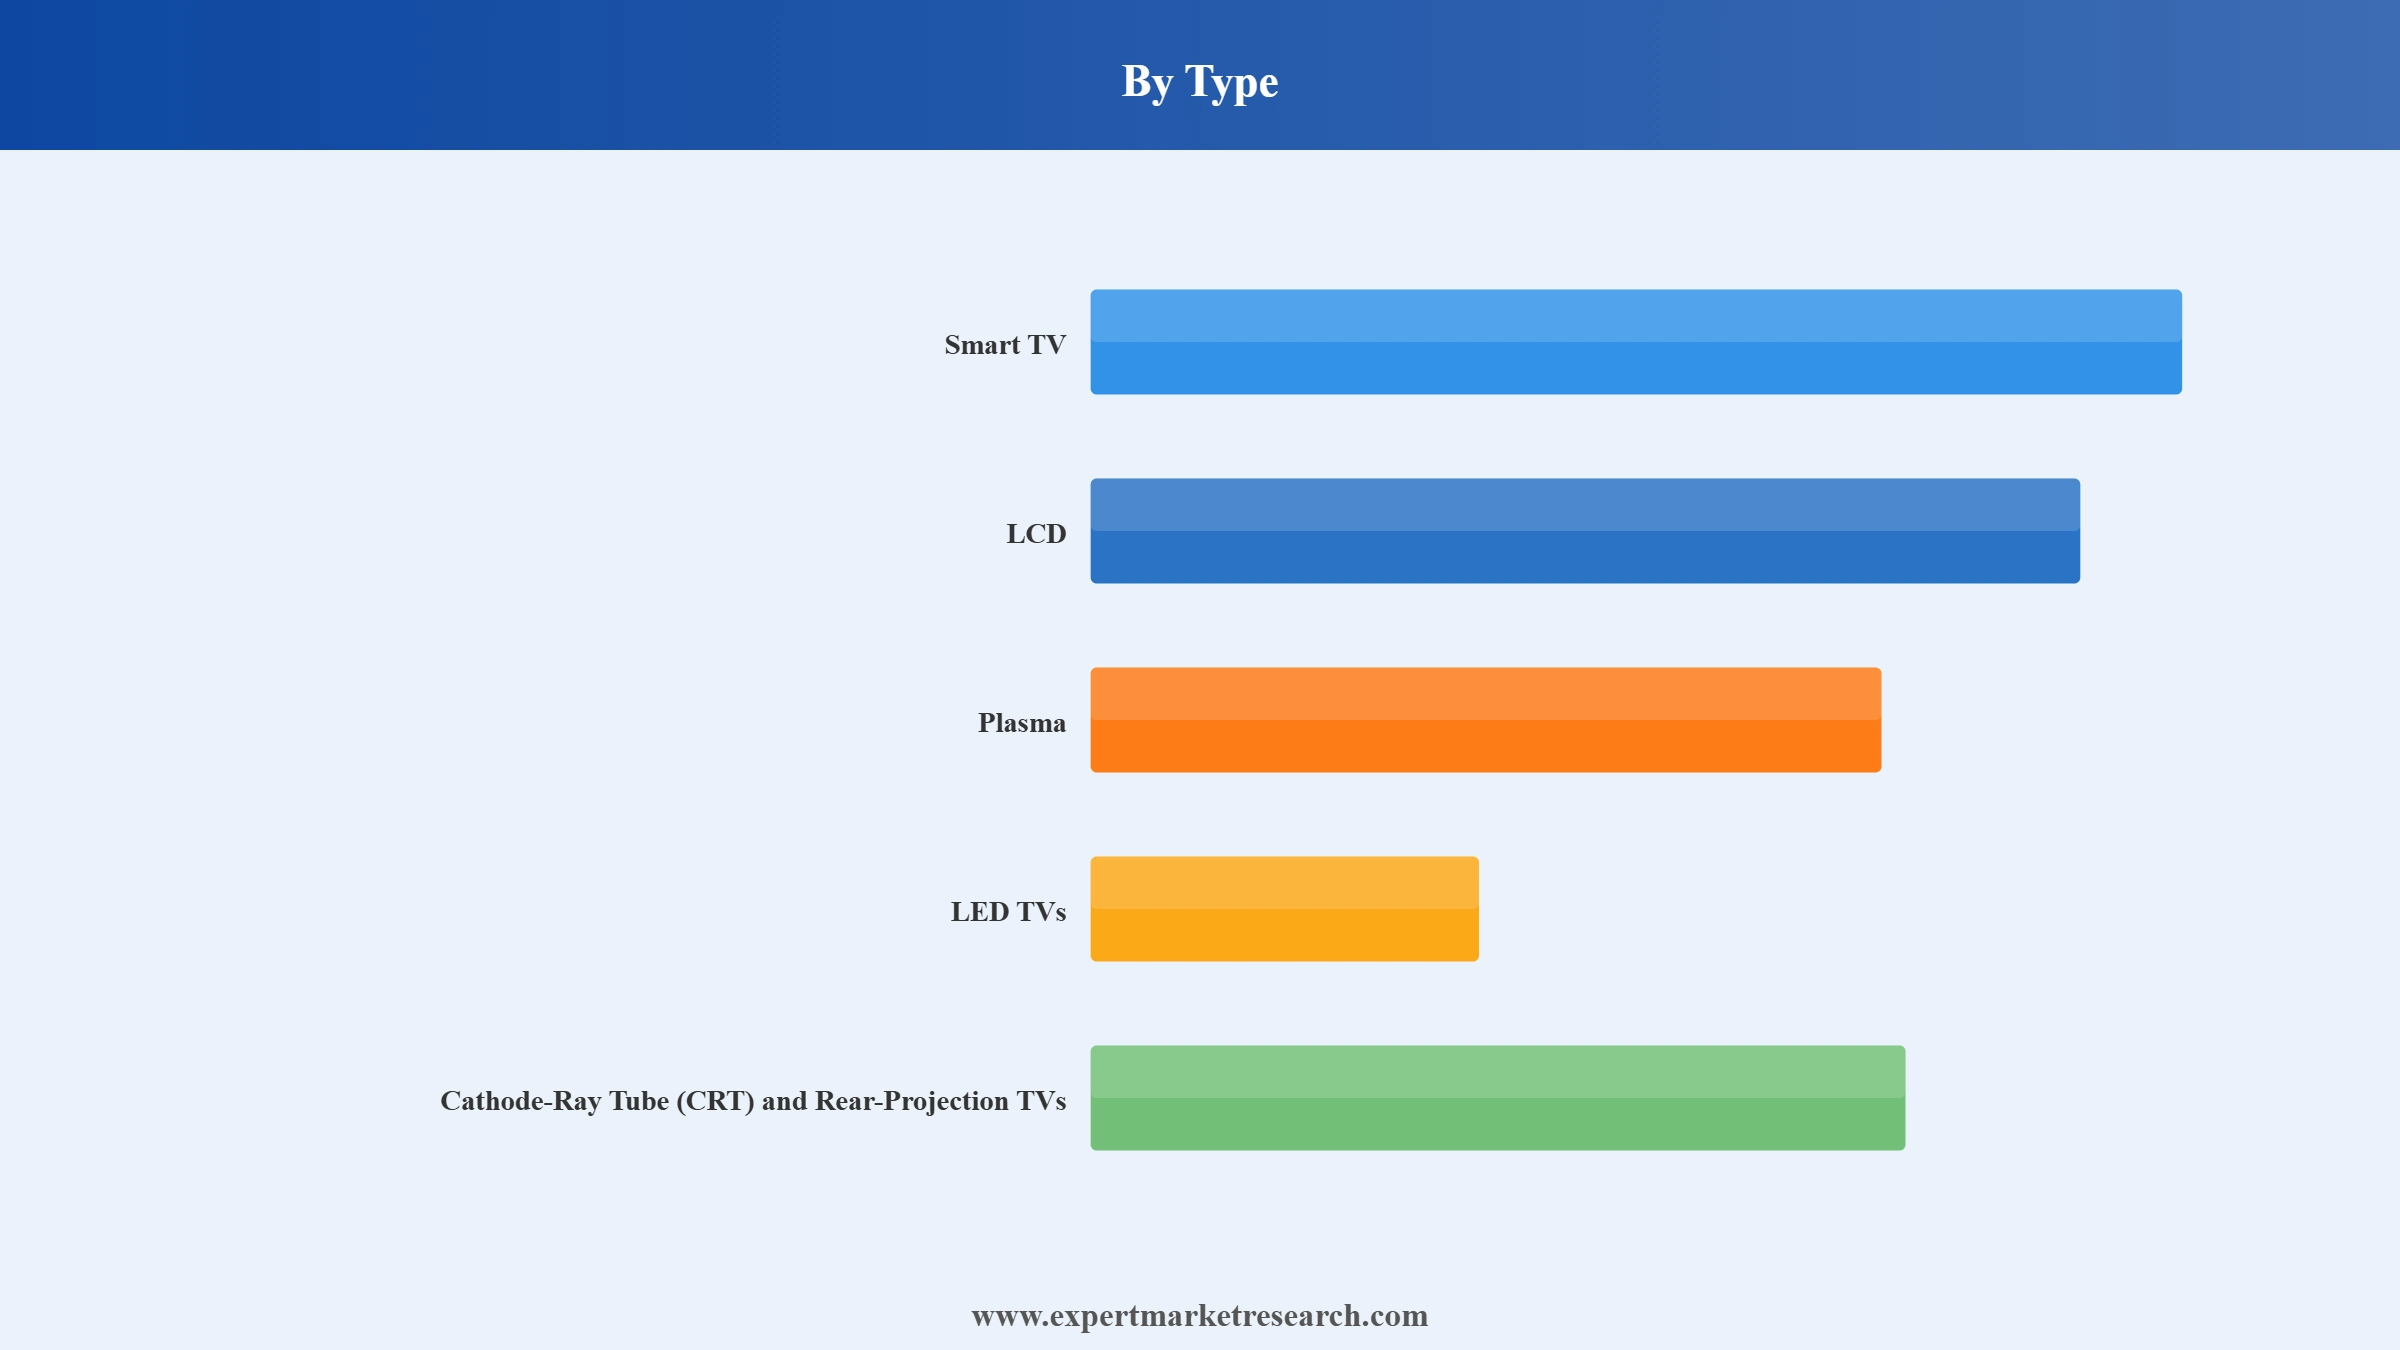
Smart TV is the dominant and fastest-growing Singapore television market type, driven by demand for streaming services including Netflix, Disney+, Max, meWATCH, and SingtelTV among Singapore's tech-savvy population. OTT viewership in Asia Pacific grew 27% in 2021. LCD/Plasma/LED TVs are a significant segment through replacement demand, while CRT and Rear-Projection TVs are declining.
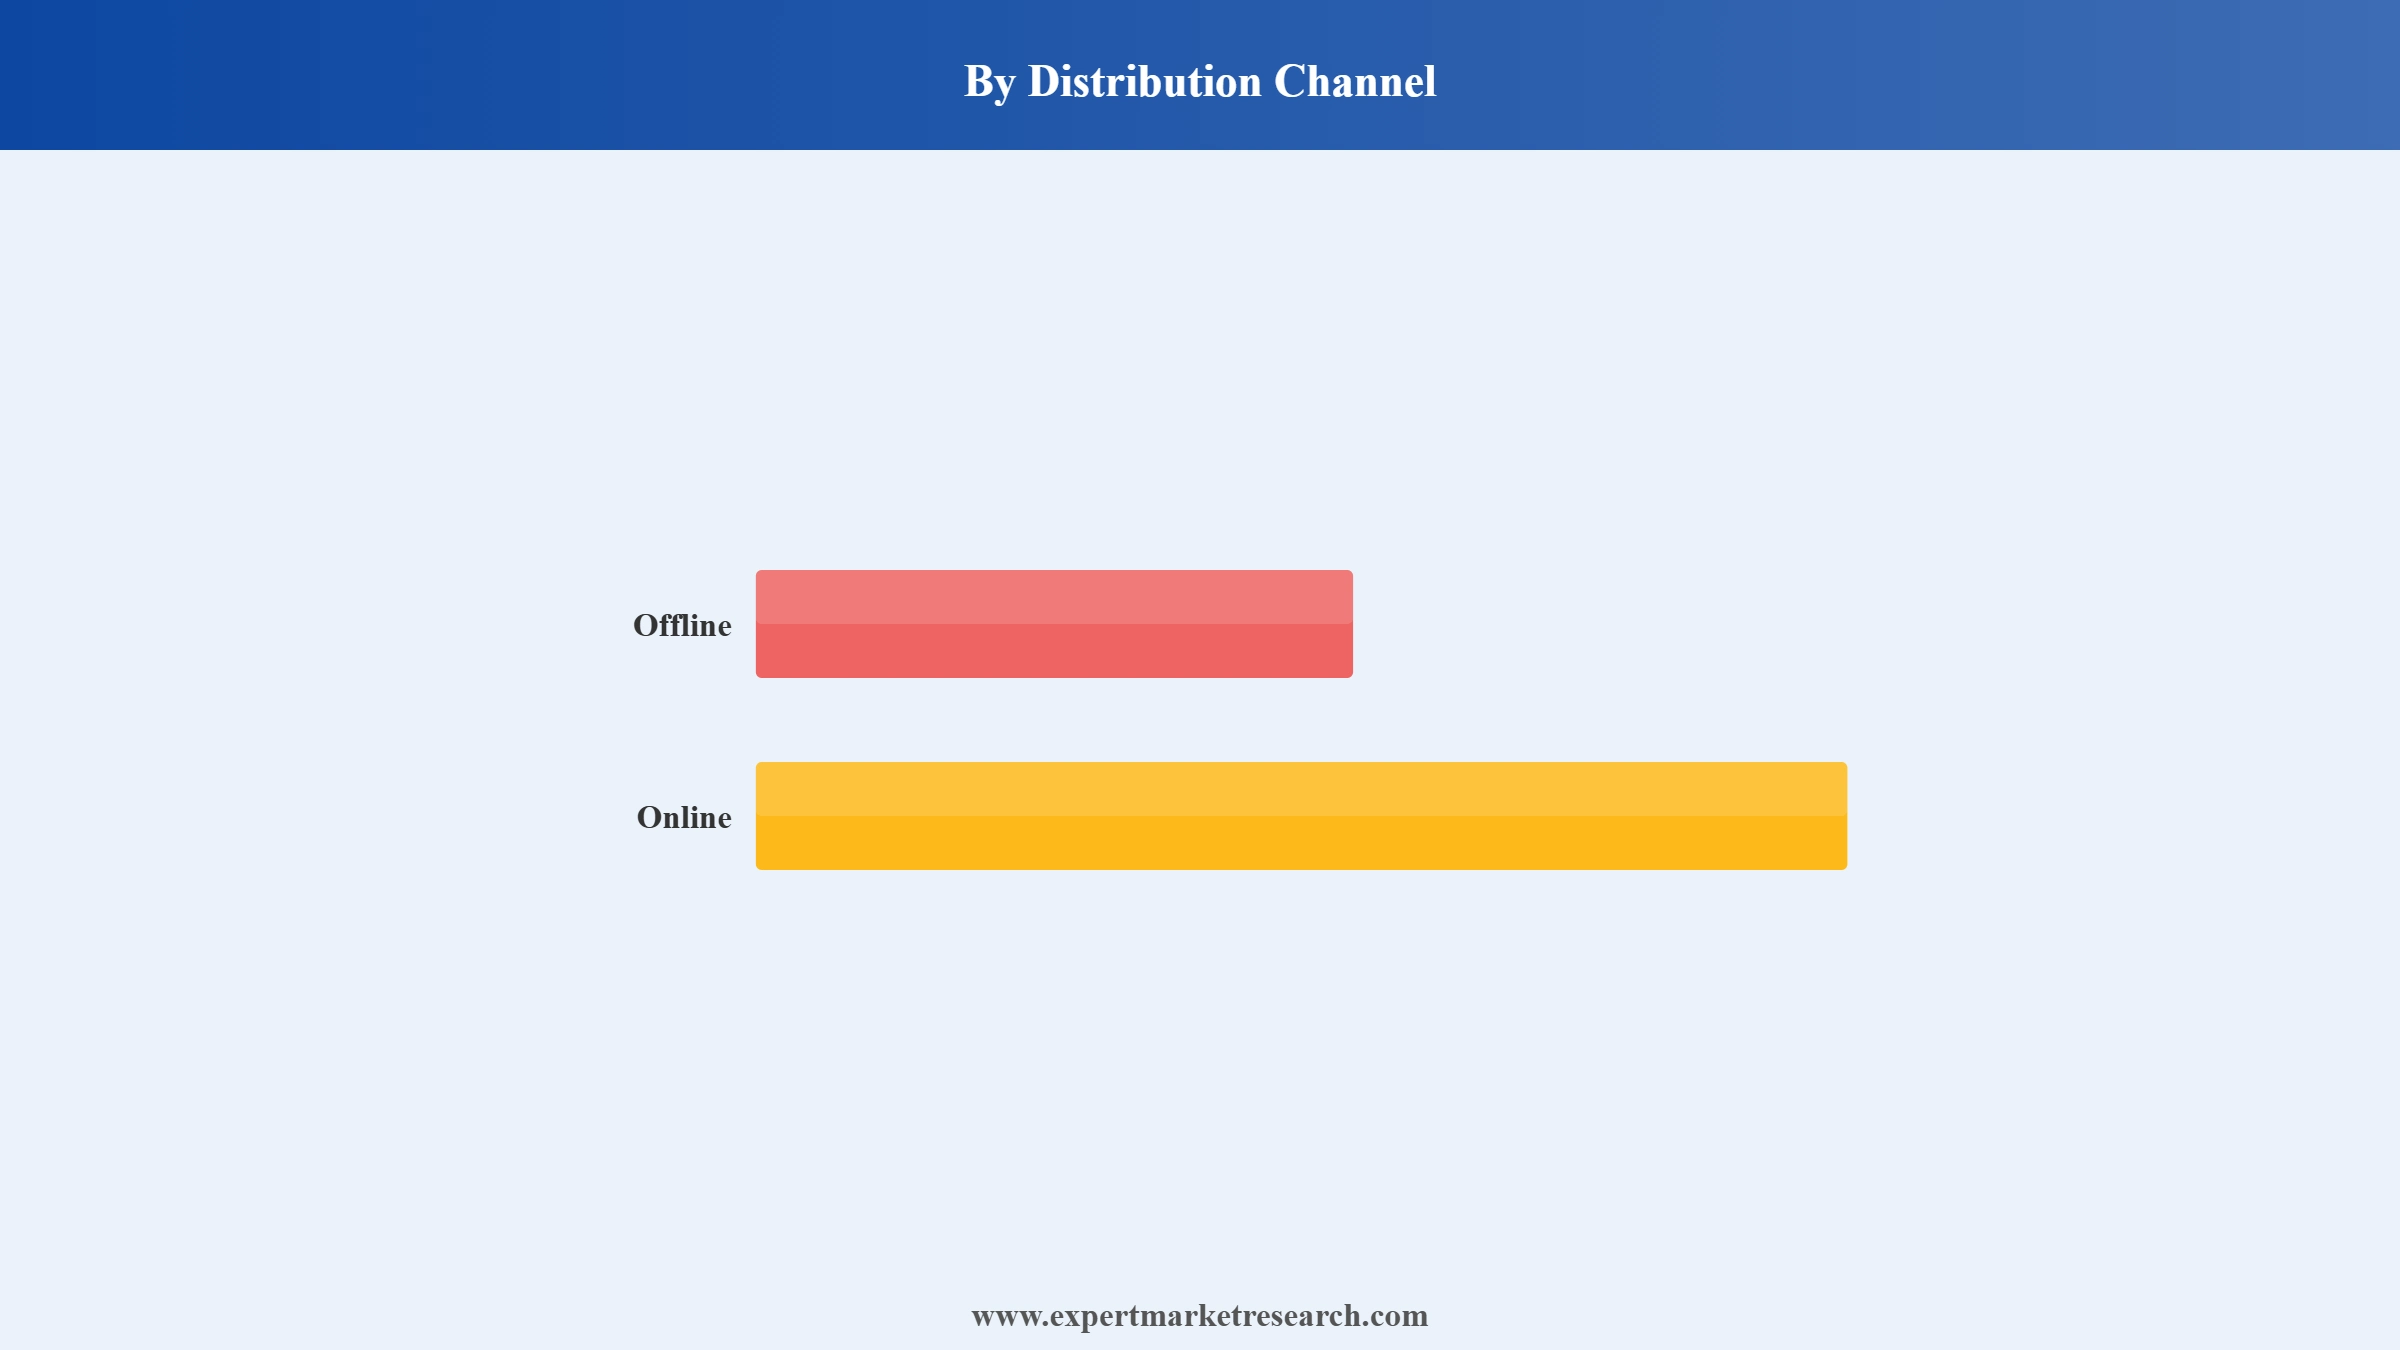
Online is the dominant Singapore television market distribution channel through 3.51 million e-commerce users as of 2022, offering competitive pricing and doorstep delivery. Offline channels through Courts, Harvey Norman, Challenger, and Gain City remain significant for consumers evaluating display quality in person.
LCD, Plasma, and LED TVs represent a significant Singapore television market type through ongoing replacement demand from cost-conscious consumers. Brands including Hisense, TCL, and Sharp are widely available at Harvey Norman, Courts, and Challenger, serving Singapore's price-sensitive segments alongside the large existing LCD/LED installed base.
CRT and Rear-Projection TVs represent a declining legacy segment in Singapore, concentrated among older demographics with minimal new unit sales. Falling OLED and QLED prices, Singapore's high technology adoption rate, and the phaseout of analog broadcasting are accelerating the consumer transition away from legacy formats.
Offline is a significant Singapore television market distribution channel through Harvey Norman, Courts, Challenger, Gain City, Isetan, and BHG at Funan, Sim Lim Square, and major suburban malls. Offline channels are particularly important for premium OLED and QLED Smart TV purchases where in-store demonstration is valued.
"Singapore Television Market Report and Forecast 2026-2035" offers a detailed analysis of the market based on the following segments:
Market Breakup by Type
Key Insight: Smart TV is the dominant and fastest-growing Singapore television market type through Singapore's digital connectivity and growing streaming service adoption. LCD, Plasma, and LED TVs remain significant.
Market Breakup by Distribution Channel
Key Insight: Online is the dominant Singapore television market distribution channel through Singapore's high e-commerce adoption, with 3.51 million e-commerce users. Offline channels remain significant for in-store display evaluation.
Read more about this report - REQUEST FREE SAMPLE COPY IN PDF
By Type, Smart TV is the dominant and fastest-growing type in the Singapore television market
Smart TV commands the largest Singapore television market share by type through strong streaming service adoption among Singapore's tech-savvy population. Samsung, LG, Sony, and Panasonic lead with OLED, QLED, and Mini-LED models. LCD/Plasma/LED TVs are significant through replacement demand. CRT and Rear-Projection TVs are a declining segment.
Read more about this report - REQUEST FREE SAMPLE COPY IN PDF
By Distribution Channel, Online is the dominant and fastest-growing channel in the Singapore market
Online channels command the largest Singapore television market share by distribution channel through 3.51 million e-commerce users and competitive pricing via Lazada, Shopee, and Amazon Singapore. Offline channels through Courts, Harvey Norman, Challenger, and Gain City remain significant for in-person display evaluation.
Read more about this report - REQUEST FREE SAMPLE COPY IN PDF
The Singapore television market is highly competitive, with global electronics leaders competing through Smart TV platform ecosystems, premium OLED and QLED display technologies, AI-powered features, brand recognition, and both online and offline Singapore retail distribution.
Samsung Electronics Co., Ltd. is a South Korea-based global electronics leader with a dominant Singapore television market presence through its The Frame, QLED, Neo QLED, and OLED series. With 19 consecutive years of global TV market leadership and 49.6% of the premium TV segment, Samsung's Vision AI and Tizen platform support Singapore streaming services including meWATCH and SingtelTV.
LG Corp. is a South Korea-based global electronics company with a significant Singapore television market presence through its OLED evo, QNED evo, and NanoCell series. LG has led global OLED TV shipments for 12 consecutive years with over 52.4% market share in 2024, and its webOS platform has earned CNET Asia Editor's and Readers' Choice Awards.
Panasonic Holdings Corp. is a Japan-based global electronics company with a significant Singapore television market presence through its Z95B MLA OLED, MX950 Mini-LED, and LX950 LED series, known for ISF-certified professional-grade picture calibration in the Singapore premium segment.
Sony Group Corp. is a Japan-based global electronics company with a significant Singapore television market presence through its BRAVIA XR, BRAVIA 9, and BRAVIA 8 OLED and Mini-LED series. Sony's Google TV platform supports Netflix, Amazon Prime Video, and Disney+, with the XR Processor delivering AI-driven picture quality.
Other key players include Toshiba Corporation, Hisense International Co., Ltd., KONKA Group Co. Ltd., Prism Tech Private Limited, and Hon. Hai Precision Industry Co., Ltd. (Sharp Corp.), among others.
*Please note that this is only a partial list; the complete list of key players is available in the full report. Additionally, the list of key players can be customized to better suit your needs.*
Our full report for 2026-2035 delivers the market data, competitive intelligence, and strategic analysis to capture Singapore's growing television market. Reach out to our team to access the complete report or request a customised version.
Upto 15% Off
USD
$2499 $2249
$3999 $3599
$4999 $4249
$5999 $5099


*While we strive to always give you current and accurate information, the numbers depicted on the website are indicative and may differ from the actual numbers in the main report. At Expert Market Research, we aim to bring you the latest insights and trends in the market. Using our analyses and forecasts, stakeholders can understand the market dynamics, navigate challenges, and capitalize on opportunities to make data-driven strategic decisions.*
The market reached nearly USD 141.36 Million in 2025.
The market is projected to grow at a CAGR of 3.60% between 2026 and 2035.
The market is assessed to witness a healthy growth in the forecast period to reach around USD 201.34 Million in 2035.
The different types of televisions in the market include smart TV, LCD, plasma, and LED TVs, and cathode-ray tube (CRT) and rear-projection TVs.
The different distribution channels of television in the market include offline and online.
The key market players are Samsung Electronics Co., Ltd., LG Corp., Panasonic Holdings Corp., Sony Group Corp., Toshiba Corporation, Hisense International Co., Ltd., KONKA Group Co. Ltd., Prism Tech Private Limited, and Hon. Hai Precision Industry Co., Ltd. (Sharp Corp.), among others.
Explore our key highlights of the report and gain a concise overview of key findings, trends, and actionable insights that will empower your strategic decisions.
| REPORT FEATURES | DETAILS |
| Base Year | 2025 |
| Historical Period | 2019-2025 |
| Forecast Period | 2026-2035 |
| Scope of the Report |
Historical and Forecast Trends, Industry Drivers and Constraints, Historical and Forecast Market Analysis by Segment:
|
| Breakup by Type |
|
| Breakup by Distribution Channel |
|
| Market Dynamics |
|
| Competitive Landscape |
|
| Companies Covered |
|
Datasheet
One User
USD 2,499
USD 2,249
tax inclusive*
Single User License
One User
USD 3,999
USD 3,599
tax inclusive*
Five User License
Five User
USD 4,999
USD 4,249
tax inclusive*
Corporate License
Unlimited Users
USD 5,999
USD 5,099
tax inclusive*
*Please note that the prices mentioned below are starting prices for each bundle type. Kindly contact our team for further details.*
Flash Bundle
Small Business Bundle
Growth Bundle
Enterprise Bundle
*Please note that the prices mentioned below are starting prices for each bundle type. Kindly contact our team for further details.*
Flash Bundle
Number of Reports: 3
20%
tax inclusive*
Small Business Bundle
Number of Reports: 5
25%
tax inclusive*
Growth Bundle
Number of Reports: 8
30%
tax inclusive*
Enterprise Bundle
Number of Reports: 10
35%
tax inclusive*
How To Order

Select License Type
Choose the right license for your needs and access rights.

Click on ‘Buy Now’
Add the report to your cart with one click and proceed to register.

Select Mode of Payment
Choose a payment option for a secure checkout. You will be redirected accordingly.
Strategic Solutions for Informed Decision-Making
Gain insights to stay ahead and seize opportunities.

Get insights & trends for a competitive edge.

Track prices with detailed trend reports.

Analyse trade data for supply chain insights.

Leverage cost reports for smart savings

Enhance supply chain with partnerships.

Connect For More Information
Our expert team of analysts will offer full support and resolve any queries regarding the report, before and after the purchase.
Our expert team of analysts will offer full support and resolve any queries regarding the report, before and after the purchase.
We employ meticulous research methods, blending advanced analytics and expert insights to deliver accurate, actionable industry intelligence, staying ahead of competitors.
Our skilled analysts offer unparalleled competitive advantage with detailed insights on current and emerging markets, ensuring your strategic edge.
We offer an in-depth yet simplified presentation of industry insights and analysis to meet your specific requirements effectively.


