

Consumer Insights
Uncover trends and behaviors shaping consumer choices today
Procurement Insights
Optimize your sourcing strategy with key market data
Industry Stats
Stay ahead with the latest trends and market analysis.
The global sodium metabisulphite market is expected to grow at a CAGR of 4.60% in the forecast period of 2026-2035.
Compound Annual Growth Rate
4.6%
2026-2035
Asia Pacific and North America are expected to be the potential markets for sodium metabisulphite manufacturers. Rapidly growing food industry including increasing population has boosted the expansion of sodium metabisulphite market within the regions. Asia Pacific region led by China, India, and South Korea may be a key contributor with a big market size. These nations witness growing demand for designer leather apparels, footwear, bags, and accessories concerning rising per capita incomes. Government initiatives to ban poly bags and introduce paper-based products will likely propel market growth within the region. Recovery in industrialized nations and growth within the emerging markets of India, China, Indonesia, Vietnam, and Thailand will eventually gain investments in chemical and pharma, textile and leather, industries.
North America is additionally major marketplace for sodium bisulphite due to the rise in demand for packaged food and beverage products. Europe sodium metabisulphite market led by Italy, United Kingdom, Germany, and various other countries will witness gains in the industry. This region has huge leather processing industry which not only manufacture but also exports differing types of leather from livestock including calves, goat, and sheep that caters to many end-use markets.
Read more about this report - REQUEST FREE SAMPLE COPY IN PDF
Sodium metabisulphite is a compound comprising sodium, sulphur, and oxygen. It's also called sodium pyro sulphite. Its formula is Na2S2O5. Sodium metabisulphite is out there within the powder form either in white or yellowish-white colour. It's water soluble and features a peculiar rotten egg smell.
Sodium metabisulphite on the basis of grade, can be divided into:
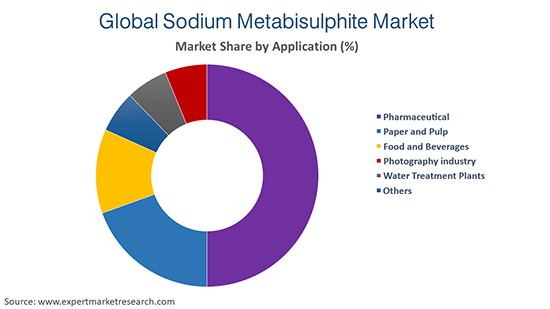
On the basis of application, sodium metabisulphite can be segmented into:
Breakup by Region


The sodium metabisulphite industry is driven by flourishing food & beverage industry and growing demand within the food packaging sector to preserve food quality mainly in developed nations. The demand for food additives and preservatives is additionally expected to fuel the expansion of the market. Another major driver that boosts the Sodium metabisulphite market growth is wastewater treatment issues in advancing nations using Sodium metabisulphite for effluvium water-treatment to remove chlorine. The worldwide demand for freshwater reflects excellent opportunities for demand in water treatment applications. Increase in research and development in new drug formulation has triggered the market demand of sodium metabisulphite within the pharmaceutical industry.
Sodium metabisulphite is employed in commercial wines to stop oxidation and preserve flavour, which is probably going to realize traction with increase in new brewery firms. With the rise in furniture and decor demand, the marketplace for sodium metabisulphite is predicted to realize significant demand due to its excellent bleaching properties. Rapid industrial expansion is predicted to drive its market. The surging demand in leather and textile industry from the varied countries where the merchandise acts as an auxiliary in bleaching and decalcification process as results of accessibility to premium staple , economic process , technological advancements and growing number of market players will stimulate sodium metabisulphite market growth.
The report gives a detailed analysis of the following key players in the sodium metabisulphite market, covering their competitive landscape, capacity, and latest developments like mergers, acquisitions, and investments, expansions of capacity, and plant turnarounds:
The comprehensive EMR report provides an in-depth assessment of the market based on the Porter's five forces model along with giving a SWOT analysis.
Upto 15% Off
USD
$2499 $2249
$3999 $3599
$4999 $4249
$5999 $5099


*While we strive to always give you current and accurate information, the numbers depicted on the website are indicative and may differ from the actual numbers in the main report. At Expert Market Research, we aim to bring you the latest insights and trends in the market. Using our analyses and forecasts, stakeholders can understand the market dynamics, navigate challenges, and capitalize on opportunities to make data-driven strategic decisions.*
The market is projected to grow at a CAGR of 4.60% between 2026 and 2035.
The major drivers of the market include rapidly growing food market, and introduction of paper-based products.
Technological advancements, and government initiatives to ban poly-bags are the key trends guiding the growth of the market.
The major regions in the market are North America, Latin America, the Middle East and Africa, Europe, and the Asia Pacific.
The different grades of sodium metabisulphite available are food grade, photo grade, and non-food grade, amongst others.
Sodium metabisulphite finds applications in pharmaceutical, paper and pulp, food and beverages, photography industry, and water treatment plants, among others.
The key players in global sodium metabisulphite market are BASF SE, Qingdao Tianya Chemical Co., Ltd, Aditya Birla Chemicals, and INEOS AG, among others.
Explore our key highlights of the report and gain a concise overview of key findings, trends, and actionable insights that will empower your strategic decisions.
| REPORT FEATURES | DETAILS |
| Base Year | 2025 |
| Historical Period | 2019-2025 |
| Forecast Period | 2026-2035 |
| Scope of the Report |
Historical and Forecast Trends, Industry Drivers and Constraints, Historical and Forecast Market Analysis by Segment:
|
| Breakup by Grade |
|
| Breakup by Application |
|
| Breakup by Region |
|
| Market Dynamics |
|
| Competitive Landscape |
|
| Companies Covered |
|
| Report Price and Purchase Option | Explore our purchase options that are best suited to your resources and industry needs. |
| Delivery Format | Delivered as an attached PDF and Excel through email, with an option of receiving an editable PPT, according to the purchase option. |
Datasheet
One User
USD 2,499
USD 2,249
tax inclusive*
Single User License
One User
USD 3,999
USD 3,599
tax inclusive*
Five User License
Five User
USD 4,999
USD 4,249
tax inclusive*
Corporate License
Unlimited Users
USD 5,999
USD 5,099
tax inclusive*
*Please note that the prices mentioned below are starting prices for each bundle type. Kindly contact our team for further details.*
Flash Bundle
Small Business Bundle
Growth Bundle
Enterprise Bundle
*Please note that the prices mentioned below are starting prices for each bundle type. Kindly contact our team for further details.*
Flash Bundle
Number of Reports: 3
20%
tax inclusive*
Small Business Bundle
Number of Reports: 5
25%
tax inclusive*
Growth Bundle
Number of Reports: 8
30%
tax inclusive*
Enterprise Bundle
Number of Reports: 10
35%
tax inclusive*
How To Order

Select License Type
Choose the right license for your needs and access rights.

Click on ‘Buy Now’
Add the report to your cart with one click and proceed to register.

Select Mode of Payment
Choose a payment option for a secure checkout. You will be redirected accordingly.
Strategic Solutions for Informed Decision-Making
Gain insights to stay ahead and seize opportunities.

Get insights & trends for a competitive edge.

Track prices with detailed trend reports.

Analyse trade data for supply chain insights.

Leverage cost reports for smart savings

Enhance supply chain with partnerships.

Connect For More Information
Our expert team of analysts will offer full support and resolve any queries regarding the report, before and after the purchase.
Our expert team of analysts will offer full support and resolve any queries regarding the report, before and after the purchase.
We employ meticulous research methods, blending advanced analytics and expert insights to deliver accurate, actionable industry intelligence, staying ahead of competitors.
Our skilled analysts offer unparalleled competitive advantage with detailed insights on current and emerging markets, ensuring your strategic edge.
We offer an in-depth yet simplified presentation of industry insights and analysis to meet your specific requirements effectively.


