

Consumer Insights
Uncover trends and behaviors shaping consumer choices today
Procurement Insights
Optimize your sourcing strategy with key market data
Industry Stats
Stay ahead with the latest trends and market analysis.
The global sports technology market size reached around USD 25062.86 Million in 2025 due to increasing demand for data-driven insights in sports, which enhances player performance and team strategies. The rise of smart stadiums equipped with IoT devices and digital signage is transforming fan experiences. As a result, the industry is expected to grow at a CAGR of 11.20% during the forecast period of 2026-2035 to attain a value of USD 72456.69 Million by 2035. The growing popularity of esports is also contributing to market expansion, as it necessitates innovative technologies for broadcasting and audience engagement.
Compound Annual Growth Rate
11.2%
Value in USD Million
2026-2035
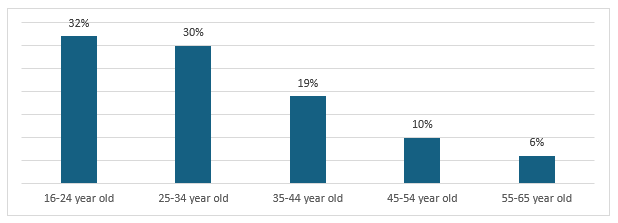
The global market is rapidly growing, driven by an increased interest in sports by participants and viewers worldwide. A strong focus on audience participation and entertainment activities as well as the digital transformation of arenas and stadiums are expected to boost the deployment of advanced technologies in the sports sector. Various sporting organisations, leagues, and clubs are also implementing advanced technological solutions for tracking players' performance and increasing their interaction with fans, which contributes to sports technology demand. The rising popularity of esports is stimulated by growing access to smartphones and the availability of free-to-play competitive games. A combination of computer vision and AI provides bookmakers with detailed information about the gamers’ decisions, allowing them to create more accurate odds. Esport teams also use machine learning to construct better practice strategies.
Figure: Top E-sport Audience by Age Group
Increasing adoption of wearable devices, rise in international sporting events, and growing focus on improving spectator experience are the key trends propelling the market growth.
FC ST. Pauli announced Catapult as the official performance analysis and athlete monitoring software partner. The objective of the partnership between FC St. Pauli and Catapult Sports is to provide official performance analysis and athlete tracking tools that will enable FC St. Pauli to contextualise the physical outputs of every aspect of play and improve optimised training sessions.
Patriot One Technologies Inc. announced a partnership with the SAP Center at San Jose, which allowed the latter to use the company's SmartGateway patron screening system and Platform powered by artificial intelligence (AI) to safeguard all entrances to roughly 18,000-seat venues for all non-NHL events.
IBM in collaboration with ESPN enhanced the Fantasy Football experience strategically using IBM Watson’s AI technology. The collaboration uses Trade Analyzer with Watson to analyse vast quantities of structured and unstructured data for ESPN fantasy football.
Oracle and Red Bull Racing joined hands for advanced innovation for Formula One by introducing a new car and a team named, Oracle Red Bull Racing, which will use Oracle Cloud infrastructure to improve race strategy, and engine development, amongst others.
To enhance their health, fitness and performance levels, athletes are utilising solutions such as wearable fitness devices, which aids the sports technology market growth. In-built GPS and sensors on the equipment capture the athlete’s data, converting it into actionable insights to boost their performance. Athletes are increasingly investing in fitness applications, wearable devices, and services that help them improve their health and endurance levels to maximise their performance. The development of devices that can be synced with computers and mobile devices compatible with various operating systems, such as iOS, Android, and Windows, has increased user convenience, influencing the sports technology market revenue. IoT sensors and devices measure the heart rate, running speed, and muscle activity of players to determine their performance. Big data along with in-memory technology analytics enables coaches to make intelligent decisions during the game and allows fans to have more enjoyable experiences.
As countries become inclined towards hosting international sporting events to secure foreign capital, the demand for digital sports services to enhance the playing and watching aspects of sports is improving, further boosting the sports technology market value. Manufacturers are providing training systems to boost the skills of individual athletes and enhance team tactics. Organisations are investing in platforms to provide sophisticated live views and real-time updates to spectators. For instance, Sony has been advancing its digital sports offerings with the launch of the AI-powered sports analytics platform, focusing on live sports broadcasting and immersive fan experiences. The platform uses real-time data and AI to deliver high-quality video streams and detailed player stats, enhancing both the training and spectator experience. Moreover, the UK government has been actively investing in digital innovation for sports through initiatives like the Sporting Future Strategy. The report highlights investments in digital technologies to enhance fan engagement and improve the delivery of real-time data during international sporting events.
The development of smart stadiums is a significant trend that enhances the fan experience during live events by integrating advanced technologies such as IoT, 5G, and augmented reality (AR). These venues are designed to provide seamless connectivity and interactive experiences for attendees. For example, Levi's Stadium in California allows fans to order food from their seats using a mobile app, check restroom lines, and access real-time game statistics through high-speed Wi-Fi. Another notable example is the Tottenham Hotspur Stadium in London, which features a retractable pitch that accommodates various sports and has extensive digital displays throughout the venue. The stadium ensures that all 62,000 spectators can connect to Wi-Fi simultaneously, enhancing their engagement with live content. Smart stadiums also leverage AR applications that allow fans to view player stats by simply pointing their smartphones at the field. The Amsterdam Arena, home to Ajax Football Club, provides fans with information on parking availability, real-time data on players, and even targeted advertising through facial recognition technology. This trend not only enhances the spectator experience but also creates new revenue opportunities in sports technology market.
Athlete tracking systems use wearable technology and data analytics to monitor player performance during training and competitions. These systems provide real-time insights into various metrics such as speed, distance covered, heart rate, and fatigue levels. For instance, STATSports offers GPS trackers used by professional teams like Manchester City and the New Zealand All Blacks to analyze player movements and optimize training regimens based on individual performance data. Another example is the Catapult Sports system, which combines wearable devices with video analysis to give coaches detailed feedback on athlete performance. This technology helps identify areas for improvement while ensuring that athletes are not overtraining or at risk of injury. This trend not only enhances competitive advantage but also prioritises athlete safety through better monitoring of physical exertion levels.
The rising focus on improving spectator experience is leading to the development of smart stadiums that incorporate smart navigation, ultrasonic internet speed, and multiple game viewpoints. The Buffalo Bills announced plans for a new USD 1.4 billion stadium in Orchard Park, New York, in partnership with Legends. This project emphasised a data-intelligence-fuelled design aimed at enhancing the game-day experience through smart technologies that will improve fan engagement and operational efficiency. The stadium is expected to open in 2026 and will incorporate advanced analytics for crowd management and personalised services which can impact sports technology demand growth.
Additionally, Tottenham Hotspur Stadium has also been recognised for its integration of smart technologies, including an efficient energy management system and advanced crowd management solutions using IoT sensors. This stadium shows how smart technology can enhance both operational efficiency and spectator comfort by providing real-time data for better crowd control and security measures.
An increasing rollout of the 5G technology ensures a high connection speed for gamers, stimulating the growth of the esports market. The utilisation of AI and machine learning is further helping players improve their gaming tactics, while virtual reality is aiding the development of interactive games, thereby supporting the growth of the sports technology market. For instance, partnered with esports organisations to bring 5G-powered connectivity to esports tournaments, enhancing live streaming experiences and reducing latency. This is expected to significantly boost the popularity and quality of live esports broadcasts, where high-speed connections are vital for smooth real-time experiences for both players and spectators.
Sports organisations depend on data analytics to enhance player development and in-game strategy. The adoption of the cloud for storing this data has enabled them to seamlessly access it and gather actionable real-time insights to boost player performance. The cloud also provides organisations with reliable backup solutions such as immutability, ensuring long-term preservation and protection of the data.
Many organisations encounter significant upfront costs when implementing new sports technologies, particularly in developing smart stadiums. As per the sports technology industry analysis, this financial hurdle can limit access for smaller teams and leagues, which may lack the necessary budgets to invest in advanced technologies.
As the use of wearable technology and IoT devices increases in sports, so do concerns regarding data privacy and security. Protecting sensitive information related to athletes and fans is crucial to maintaining trust within the industry. Organisations must navigate stringent regulations while ensuring robust security measures are in place, which can complicate technology deployment.
Furthermore, resistance to change among athletes, coaches, and organisations can slow the adoption of new technologies. Building trust in these innovations takes time, as stakeholders need to see clear benefits before fully embracing them.
Read more about this report - REQUEST FREE SAMPLE COPY IN PDF
“Sports Technology Market Report and Forecast 2026-2035” offers a detailed analysis of the market based on the following segments:
Market Breakup by Sports Type
Market Breakup by Technology
Market Breakup by Sports
Market Breakup by Component
Market Breakup by Application
Market Breakup by End Use
Market Breakup by Region
Market Insights by Sports Type
Outdoor sports, particularly team sports like soccer and basketball, are significant contributors to the revenue generated in the sports technology sector. The integration of technology in these sports enhances performance analysis, fan engagement, and overall experience, making them more lucrative for tech investments and aiding the sports technology market expansion.
Technologies such as wearable devices, performance analytics, and smart stadium solutions have seen greater adoption in outdoor sports. This is attributed to the higher visibility and commercial opportunities present in outdoor events compared to indoor sports.
Market Insights by Technology
Sports organisations are deploying IoT technology to capture real-time data and analytics to support players and teams to improve their performance, fitness, health, and training strategies, which can impact the sports technology market development. With organisations placing stadiums at the epicentre of fan experience, the use of IoT technology to improve digital engagement, venue efficiency, and in-arena experience is growing.
Meanwhile, AI, along with data analytics, is applied across a range of areas, including athlete management and payments, talent identification and selection, sports organisational management, fan experience, and sports betting. AI in sports, including tennis, soccer, cricket, baseball, and basketball, helps teams analyse the weaknesses of competitors and adjust pre-training sessions accordingly.
Market Insights by Sports
Soccer accounts for a significant sports technology market share due to its global popularity and the massive investments made by clubs, leagues, and sponsors in advanced technologies. This includes areas like player performance analysis, data analytics, wearable tech, and fan engagement tools. Soccer's vast fan base across continents ensures that tech solutions such as VAR (Video Assistant Referee), GPS tracking for players, and immersive fan experiences are highly adopted.
Market Insights by Component
Software holds the major share of the market. This is due to the increasing reliance on data-driven solutions across various sports. Software platforms that focus on player performance analytics, team management, fan engagement, and real-time game statistics are in high demand. These technologies help coaches, athletes, and sports organisations make informed decisions, optimise training, and enhance fan experiences.
Additionally, the rise of sports analytics, fantasy sports platforms, and virtual sports also contributes to the growing importance of software in the sports technology market.
Market Insights by Application
Analytics and statistics hold a significant share of the market. This area includes tools and software that collect, process, and analyse large amounts of data related to player performance, team statistics, and game outcomes. The insights derived from analytics help coaches, athletes, and teams make data-driven decisions, improve performance, and optimise strategies. As more sports organisations adopt data-driven approaches to gain a competitive edge, the demand for analytics and statistics platforms continues to grow.
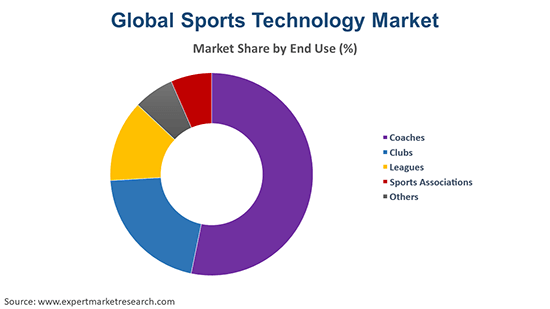
Market Insights by End Use
Blockchain technology has helped sports clubs, such as Manchester City, Barcelona, and PSG, to improve fan engagement, boost revenue, and combat fraud. Sporting leagues have been utilising innovative technologies to collect unprecedented data, including player speed and shot velocity, to improve the performance of players.
Moreover, sports associations have been increasingly deploying innovative technologies to make error-free judgments. Sports associations and coaches are leveraging technologies, such as machine learning, AI, and data science, to predict outcomes in real time, suggest alternatives, and enhance gaming strategies. Additionally, machine learning helps organisations understand the spectator’s behaviour to improve their engagement.


North America Sports Technology Market Trends
Within North America, sports organisations, such as Canadian Sport Institute Calgary, are utilising AI to gain insights from data to maintain an athlete's health and optimise their performance. Further, sports academies and associations are adopting cloud-based software platforms to boost their activities and impact sports technology market dynamics and trends.
According to a 2022 report from the US Department of Commerce, the sports technology market is expected to grow significantly, driven by increased investments in AI-driven analytics, digital broadcasting, and immersive fan experiences. The report states that hosting international sporting events has become a way for countries to boost their economies and attract foreign investments.
Asia Pacific Sports Technology Market Drivers
The increasing interest in professional sports, coupled with major international events hosted in the region, drives demand for advanced sports technologies. Organisations are investing heavily in smart stadium infrastructure to enhance fan engagement, and operational efficiency and contribute to the sports technology industry revenue.
The Australian Sports Plan emphasises leveraging technology for training and competition. The government’s vision includes incorporating digital services to improve athlete training, competition efficiency, and fan engagement. Their funding supports the development of high-tech training systems and real-time data delivery during live sports events, driving the adoption of digital services to enhance both the playing and watching aspects of sports.
Europe Sports Technology Market Opportunities
European countries are increasingly adopting smart technologies in stadiums, enhancing the spectator experience through improved connectivity and data analytics. The UEFA Euro 2024 saw the implementation of advanced technologies across stadiums in Germany. These included 5G networks for seamless connectivity, automatic ticketing systems, and crowd management solutions, which boosted the growth of the sports technology industry.
Within the European region, Germany has emerged as a diverse and mature esports market. The development of distinct esports sub-ecosystems through titles such as Counterstrike: Global Offensive, League of Legends, and FIFA are increasing the popularity of esports and demand for technology such as AI and AR/VR.
Latin America Sports Technology Market Growth
Latin America witnessed a boom in sports tech startups, particularly in the fitness sector. For instance, Genius Sports, based in London, has a significant presence in Latin America, particularly in Medellin, Colombia. Their platform enhances data collection and management for on-field statistics, which is crucial for teams looking to improve performance and creates new sports technology market opportunities.
The company specialises in data analytics and technology solutions for sports teams and fans. Sports, particularly soccer, are a major part of the lives of Latin Americans, and the developments in the streaming and data analysis of sporting events have boosted the growth of the market.
Middle East and Africa Sports Technology Market Dynamics
The Middle East is witnessing substantial investments in sports infrastructure as countries aim to host major sporting events like the FIFA World Cup and the Olympics. This focus on sports tourism is driving demand of sports technology market containing advanced technologies that improve both athlete training and spectator experience. For instance, Saudi Arabia is set to develop a massive sports complex through a partnership between Alpha Jossor Investments and Blockchain Sports Ecosystem. This USD 3.3 billion project aims to create one of the largest athletic hubs in the region, featuring advanced training facilities and real estate developments.
Several startups are developing AI-powered platforms that provide insights into athlete performance, helping teams make informed decisions regarding training and talent identification. Innovations in wearable tech are also prominent, with startups producing IoT devices that allow athletes to monitor their performance metrics in real-time. This technology not only aids professional athletes but also supports amateur players in enhancing their skills.
Kayezen
This startup has developed the VECTOR system, which offers innovative exercise challenges by providing a smooth range of pulls with adjustable resistance. Kayezen's technology aims to reduce the need for multiple pieces of training equipment, making it easier for athletes to train effectively without the burden of carrying heavy gear. The VECTOR system is designed for both athletic performance and everyday fitness, showcasing its versatility in training applications.
Bepro11
Focused on revolutionising football analysis, Bepro11 provides a platform that allows users to automatically record matches and training sessions with a simple touch of a button. The platform enables coaches and players to access training footage from anywhere, facilitating detailed analysis through integrated event and tracking data.
Manufacturers are engaging in continuous research and development to create improved technological solutions offering enhanced functionality and reliability to enhance the experience of end users. Sports technology industry players are increasingly focusing on data-driven insights and analytics, utilising wearable technologies and sensors to monitor athlete health and performance in real-time. This trend is aided by the development of smart stadiums that enhance the spectator experience through advanced technologies like AR.
IBM, headquartered in the US, provides various technologies which are used across a wide range of industries including aerospace and defence, automotive, entertainment, and oil and gas, among others.
Headquartered in Japan, Fujitsu is one of the global leaders in technology and business solutions dealing in computing, network, artificial intelligence, data and security, and converging technologies, providing end-to-end technology-related solutions.
SAP SE, founded in 1972, is a global leader in enterprise applications redefining ERP and creating networks of intelligent enterprises that provide transparency, resiliency, and sustainability across supply chains.
Oracle, headquartered in the US, is one of the world’s largest database management companies and is the only technology provider with a complete suite of integrated cloud applications and a cloud infrastructure platform.
*Please note that this is only a partial list; the complete list of key players is available in the full report. Additionally, the list of key players can be customized to better suit your needs.*
Other notable players operating in the global market are NEC Corporation, Fitbit LLC, Apple Inc., Garmin Ltd., Sony Corporation, Cisco Systems, Inc., Samsung Electronics Co., Ltd., Huawei Technologies Co., Ltd., Panasonic Corporation, Catapult Group International Ltd, Zebra Technologies Corporation, Stats Perform, Infosys Limited, MicroTeam, Pixellot Ltd., and Miro AI, among others.
Upto 15% Off
USD
$2499 $2249
$3999 $3599
$4999 $4249
$5999 $5099


*While we strive to always give you current and accurate information, the numbers depicted on the website are indicative and may differ from the actual numbers in the main report. At Expert Market Research, we aim to bring you the latest insights and trends in the market. Using our analyses and forecasts, stakeholders can understand the market dynamics, navigate challenges, and capitalize on opportunities to make data-driven strategic decisions.*
In 2025, the market reached an approximate value of USD 25062.86 Million.
The sports technology market is assessed to grow at a CAGR of 11.20% between 2026 and 2035.
The market is estimated to witness healthy growth in the forecast period of 2026-2035 to reach a value of around USD 72456.69 Million by 2035.
The different sport types considered in the market report are outdoor sports and indoor sports.
The key regional markets for sports technology are North America, Europe, the Asia Pacific, Latin America, and the Middle East and Africa.
The end uses of sports technology include clubs, sports associations, leagues, and coaches, among others.
The applications include analytics and statistics, decision-making and team analysis and management, game performance analysis and injury and health analysis, training, tactics and simulation, and tracking.
The key players in the market include International Business Machines Corporation, Fujitsu Limited, SAP SE, Oracle Corporation, NEC Corporation, Fitbit LLC, Apple Inc., Garmin Ltd., Sony Corporation, Cisco Systems, Inc., Samsung Electronics Co., Ltd., Huawei Technologies Co., Ltd., Panasonic Corporation, Catapult Group International Ltd, Zebra Technologies Corporation, Stats Perform, Infosys Limited, MicroTeam, Pixellot Ltd., and Miro AI, among others.
Explore our key highlights of the report and gain a concise overview of key findings, trends, and actionable insights that will empower your strategic decisions.
| REPORT FEATURES | DETAILS |
| Base Year | 2025 |
| Historical Period | 2019-2025 |
| Forecast Period | 2026-2035 |
| Scope of the Report |
Historical and Forecast Trends, Industry Drivers and Constraints, Historical and Forecast Market Analysis by Segment:
|
| Breakup by Sport Type |
|
| Breakup by Technology |
|
| Breakup by Sports |
|
| Breakup by Component |
|
| Breakup by Application |
|
| Breakup by End Use |
|
| Breakup by Region |
|
| Market Dynamics |
|
| Competitive Landscape |
|
| Companies Covered |
|
| Report Price and Purchase Option | Explore our purchase options that are best suited to your resources and industry needs. |
| Delivery Format | Delivered as an attached PDF and Excel through email, with an option of receiving an editable PPT, according to the purchase option. |
Datasheet
One User
USD 2,499
USD 2,249
tax inclusive*
Single User License
One User
USD 3,999
USD 3,599
tax inclusive*
Five User License
Five User
USD 4,999
USD 4,249
tax inclusive*
Corporate License
Unlimited Users
USD 5,999
USD 5,099
tax inclusive*
*Please note that the prices mentioned below are starting prices for each bundle type. Kindly contact our team for further details.*
Flash Bundle
Small Business Bundle
Growth Bundle
Enterprise Bundle
*Please note that the prices mentioned below are starting prices for each bundle type. Kindly contact our team for further details.*
Flash Bundle
Number of Reports: 3
20%
tax inclusive*
Small Business Bundle
Number of Reports: 5
25%
tax inclusive*
Growth Bundle
Number of Reports: 8
30%
tax inclusive*
Enterprise Bundle
Number of Reports: 10
35%
tax inclusive*
How To Order

Select License Type
Choose the right license for your needs and access rights.

Click on ‘Buy Now’
Add the report to your cart with one click and proceed to register.

Select Mode of Payment
Choose a payment option for a secure checkout. You will be redirected accordingly.
Strategic Solutions for Informed Decision-Making
Gain insights to stay ahead and seize opportunities.

Get insights & trends for a competitive edge.

Track prices with detailed trend reports.

Analyse trade data for supply chain insights.

Leverage cost reports for smart savings

Enhance supply chain with partnerships.

Connect For More Information
Our expert team of analysts will offer full support and resolve any queries regarding the report, before and after the purchase.
Our expert team of analysts will offer full support and resolve any queries regarding the report, before and after the purchase.
We employ meticulous research methods, blending advanced analytics and expert insights to deliver accurate, actionable industry intelligence, staying ahead of competitors.
Our skilled analysts offer unparalleled competitive advantage with detailed insights on current and emerging markets, ensuring your strategic edge.
We offer an in-depth yet simplified presentation of industry insights and analysis to meet your specific requirements effectively.


