

Consumer Insights
Uncover trends and behaviors shaping consumer choices today
Procurement Insights
Optimize your sourcing strategy with key market data
Industry Stats
Stay ahead with the latest trends and market analysis.
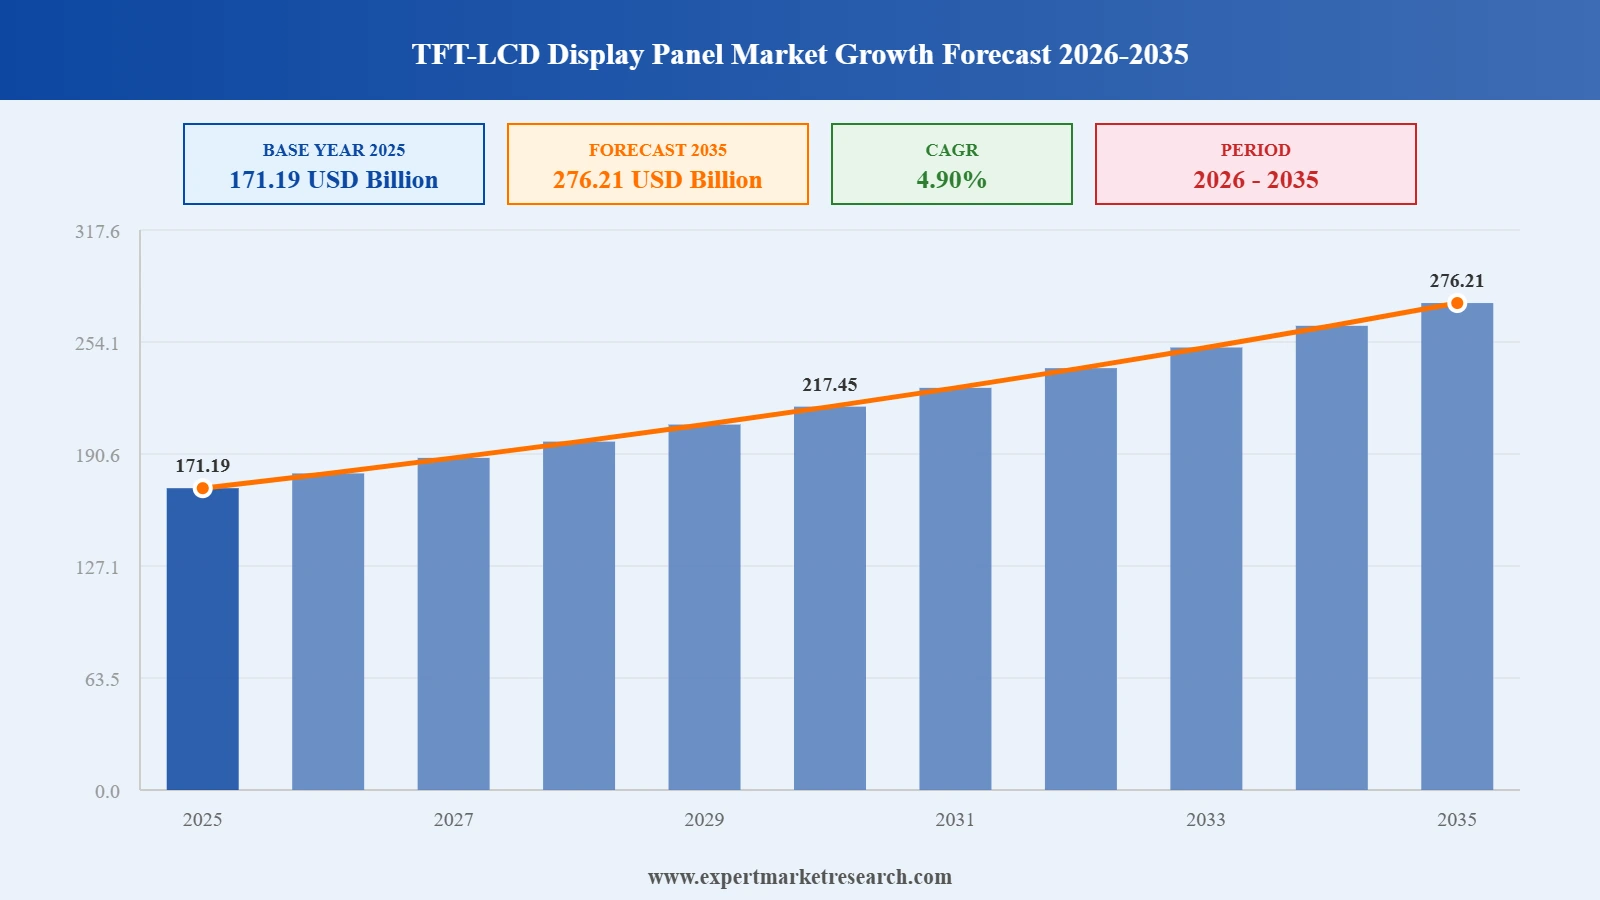
The Global TFT-LCD Display Panel Market was valued at USD 171.19 Billion at 2025 and is set to grow at a CAGR of around 4.90% through 2026-2035. Digital cockpit investment in vehicles, growing adoption of high-resolution monitors, and deep smartphone penetration in emerging markets are keeping the demand pipeline active. The market is on track to reach USD 276.21 Billion by 2035. The global tft-lcd display panel market is shaped by rising consumer electronics adoption, expanding automotive display integration, and steady demand for larger screens.
Read more about this report - REQUEST FREE SAMPLE COPY IN PDF
The tft-lcd display panel market is shifting beyond its traditional TV and smartphone story. Automotive cockpit digitalization is pulling production capacity toward higher-value applications, and premium gaming monitors are creating a revenue tier that offsets structural pricing pressure in commodity TV panel segments.
Samsung Electronics and BOE Technology Group resumed top-level talks in December 2025 to explore expanded LCD panel sourcing, following resolution of a patent dispute. The renewed engagement could reshape procurement patterns across the global consumer electronics supply chain.
Sharp Corporation rolled out a 12.3-inch LTPS TFT-LCD automotive display line in July 2025, targeting mid-to-high-end vehicle dashboards. The launch reflects the broader pivot by Japanese manufacturers toward premium automotive applications as conventional TV-panel profitability narrows.
BOE Technology Group completed the acquisition of Visionox's LTPS TFT-LCD backplane operations in March 2025, deepening its supply chain integration and accelerating high-resolution mobile panel output for both domestic OEM customers and export markets.
Innolux Corporation and Tianma Microelectronics announced a joint agreement in December 2024 to co-develop LTPS TFT-LCD backplanes and expand mobile display capacity, marking a new phase of collaboration between Taiwanese and Chinese panel producers.
Automakers are integrating digital cockpits and infotainment screens faster than most analysts had projected. Panel makers including AUO, BOE, LG Display, and Japan Display are all reallocating capacity toward automotive contracts, which carry stronger margins than crowded TV and entry-level smartphone display segments.
The gaming monitor segment has established a clear premium tier, with 240Hz and above refresh rates commanding prices well above commodity display levels. Commercial digital signage is running in parallel, adding stable, contract-driven demand alongside more volatile consumer electronics cycles.
Mini-LED backlit TFT-LCD panels sit credibly between standard LCD and premium OLED in performance terms. The brightness and contrast they deliver competes with OLED at a lower cost per panel, keeping TFT-LCD relevant in premium television and high-end monitor segments.
BOE Technology Group and CSOT have continued expanding Gen 10.5 production lines that deliver large-size panels at costs no other region can currently match. The structural advantage keeps pressure on Taiwanese and Japanese producers and is accelerating consolidation in commodity panel supply toward Chinese manufacturers.
Industrial automation, medical imaging, and ruggedised handheld devices are providing consistent demand for medium and small-size TFT-LCD panels. These applications carry better margins than consumer electronics and are far less exposed to the seasonal price swings that affect smartphone and TV display production.
The report of Expert Market Research's titled "Global TFT-LCD Display Panel Market Report and Forecast 2026-2035" offers a detailed analysis of the market based on the following segments:
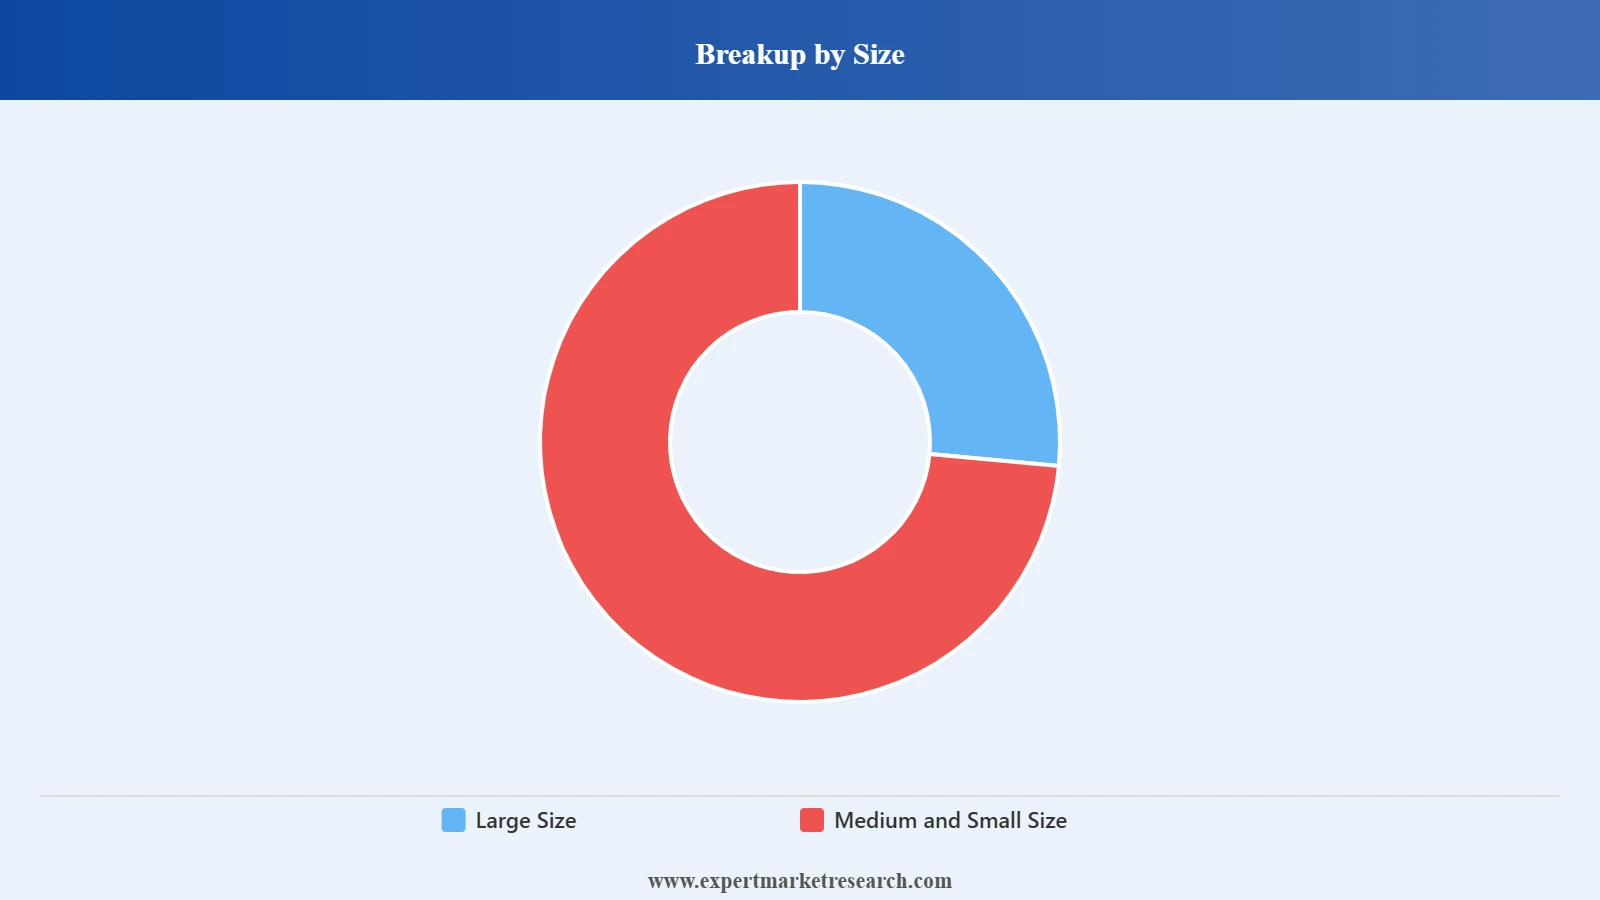
Market Breakup by Size
Key Insight: Large-size panels command the television and commercial display space, but medium and small panels hold the higher unit count. Smartphones, tablets, automotive clusters, and handheld industrial devices all sit in this tier, giving it meaningful resilience across economic cycles.
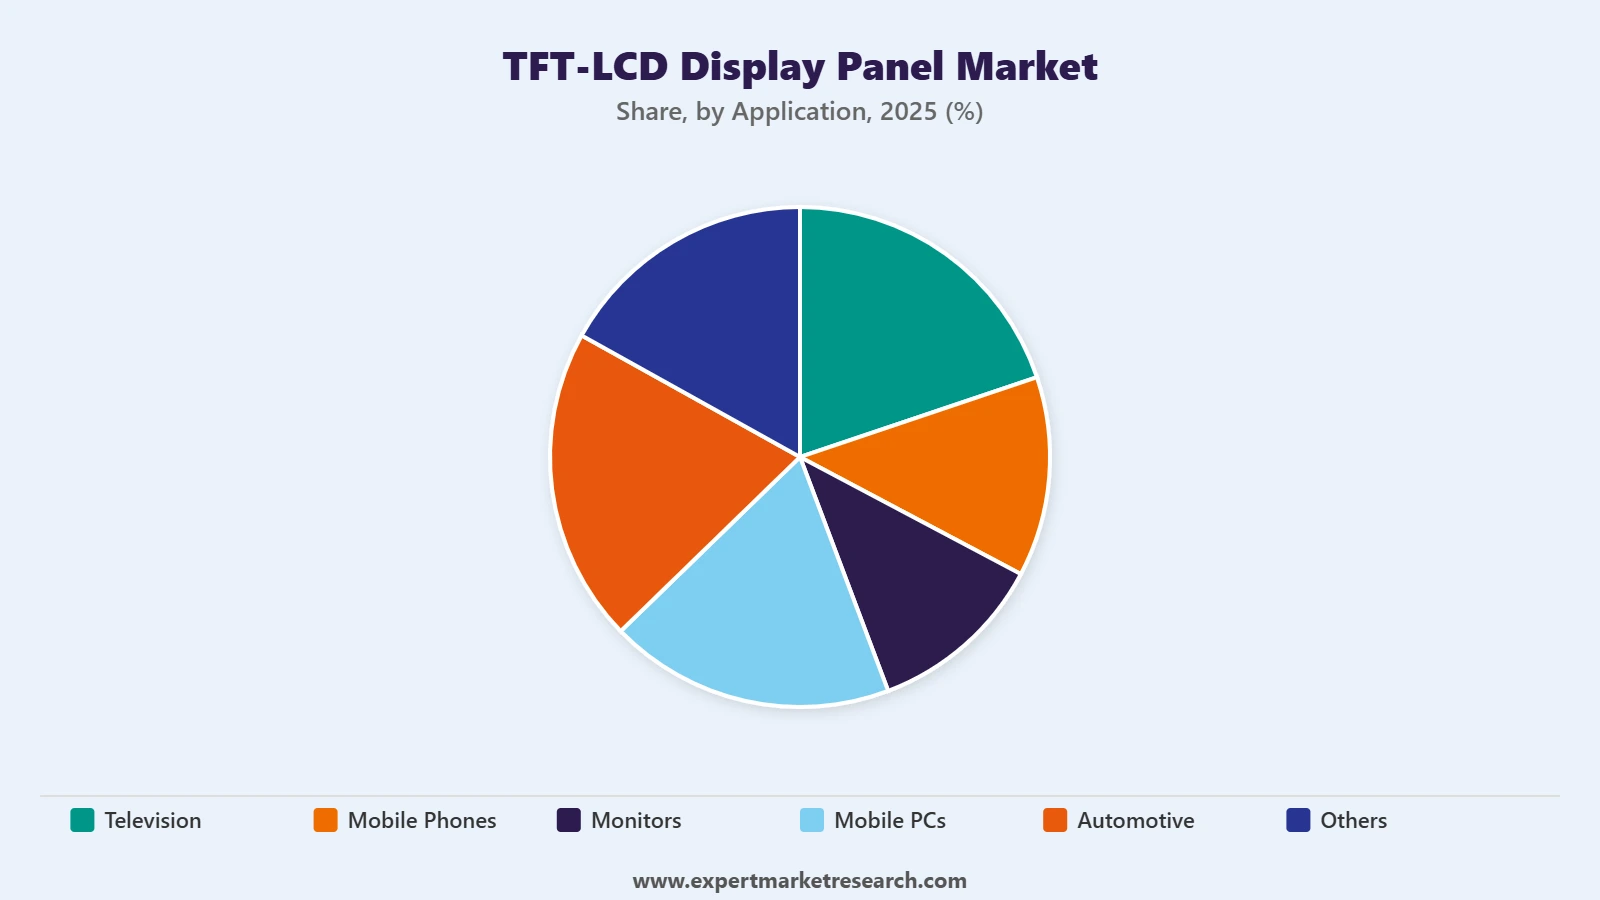
Market Breakup by Application
Key Insight: Automotive is the application drawing the most active capital allocation among panel manufacturers. The digital cockpit trend across EVs and conventional vehicles is the primary driver, and the margin structure in automotive contracts is considerably stronger than in commodity TV or entry-level smartphone display production.
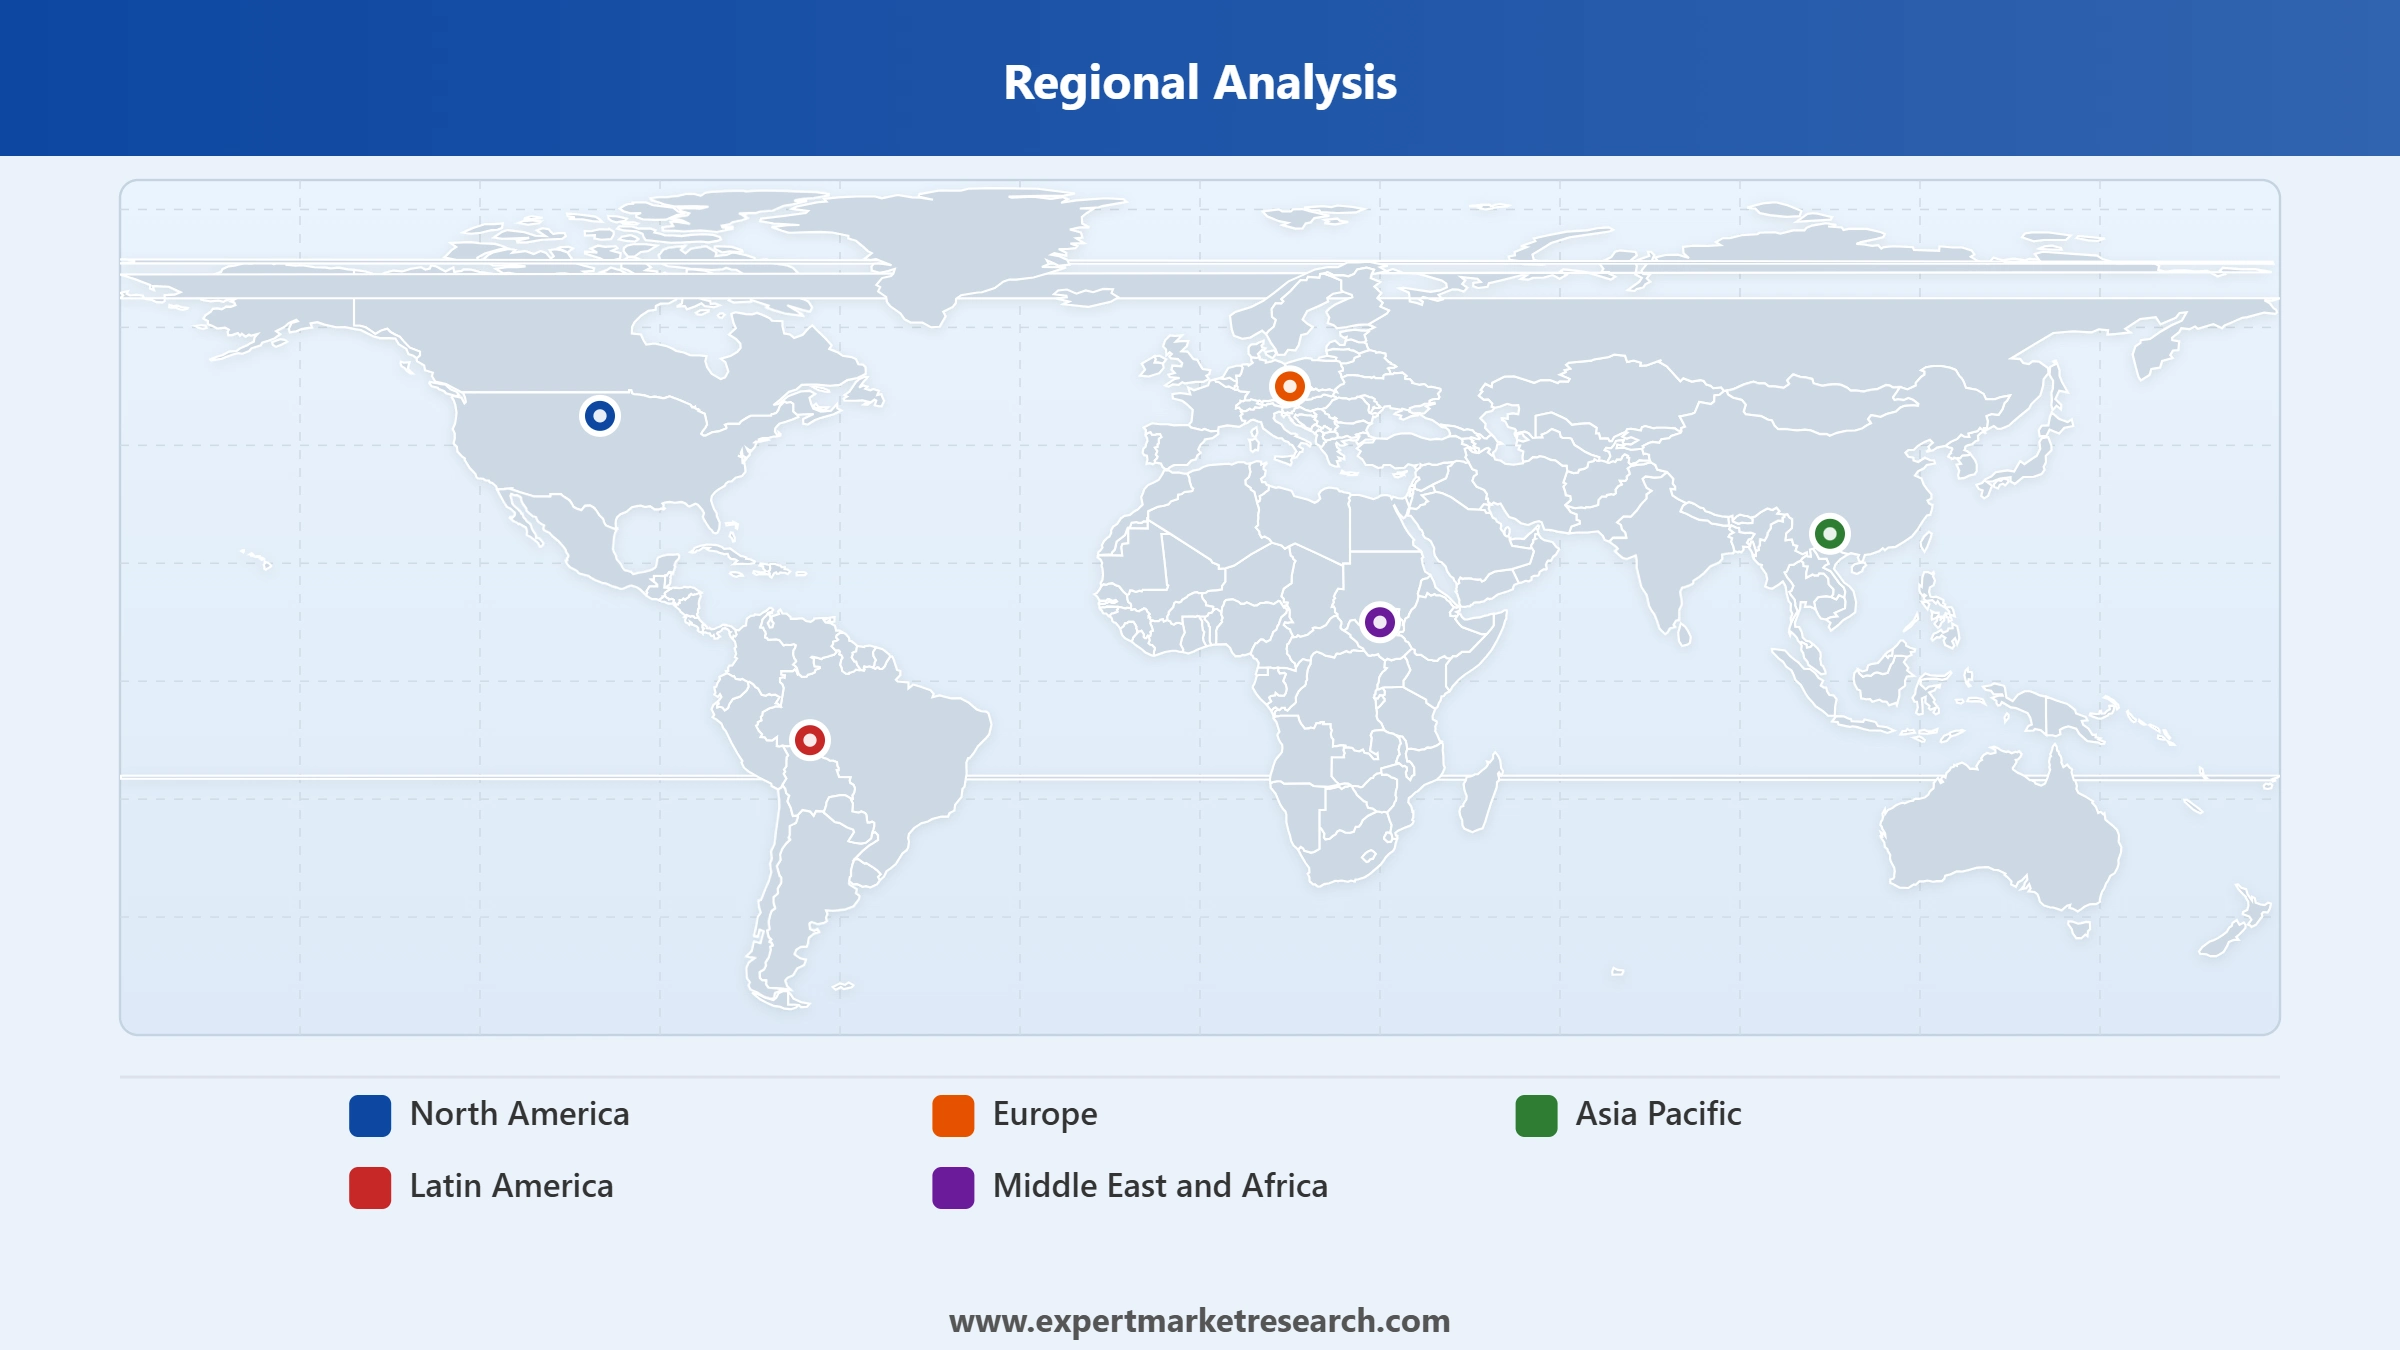
Market Breakup by Region
Key Insight: Asia Pacific sits at the center of global tft-lcd display panel production and consumption. China holds a dominant share of worldwide output, and the supply chain built around its large-generation fabrication facilities is not easily replicated elsewhere. End-market consumption is equally strong across smartphones, televisions, and laptops.


Read more about this report - REQUEST FREE SAMPLE COPY IN PDF
By Size, medium and small size panels account for the dominant share of the market due to high unit volumes from smartphones, tablets, and automotive clusters
Medium and small panels have the broadest demand base in the tft-lcd display panel market. Smartphones represent a major share of annual unit shipments, with tablets, automotive clusters, and medical handhelds adding further volume. Consumer demand is partly sustained by the smartphone upgrade cycle still active across South Asia, Southeast Asia, and Latin America.
Read more about this report - REQUEST FREE SAMPLE COPY IN PDF
Large-size panels hold steady through television and commercial display segments. They deliver more predictable, contract-driven revenue. The commercial portion, covering digital signage, corporate displays, and educational panels, is among the more stable sub-segments across the broader tft-lcd industry.
By Application, television holds the largest application share due to persistent household demand and a global preference for larger screens
Television is the largest application by volume, supported by consistent household replacement cycles and a clear preference for bigger screens. Demand in India and Southeast Asia has not yet matured to North American or Western European levels, sustaining healthy global consumption. Commercial flat-panel demand from retail and institutional buyers adds a steady supplementary stream.
Read more about this report - REQUEST FREE SAMPLE COPY IN PDF
Automotive is attracting the most strategic attention. According to Omdia research from July 2025, LTPS TFT-LCD and OLED combined were projected to exceed 50% of total automotive display revenue. AUO, BOE, Japan Display, and LG Display are actively shifting production lines toward automotive to capture the stronger margin profile those contracts carry.
Asia Pacific dominates the global tft-lcd display panel market due to China's large-generation manufacturing base and the region's weight in both production and consumption
Asia Pacific commands the global market. China is the structural anchor: its Gen 10.5 production lines at BOE and CSOT deliver cost levels no other region can currently match. Domestic consumption is equally substantial, with China, India, Japan, and ASEAN forming a large and growing demand pool for televisions, smartphones, monitors, and automotive panels. India is increasingly attracting manufacturing investment as global brands pursue supply chain diversification.
Read more about this report - REQUEST FREE SAMPLE COPY IN PDF
The Middle East and Africa represent a developing demand picture. Gulf state commercial and automotive sectors are adopting more sophisticated display configurations. Latin America, particularly Brazil and Mexico, provides consistent demand through electronics replacement cycles. North America and Europe contribute premium demand for monitors, automotive panels, and commercial signage, even as the production base has largely shifted to Asia.
The global tft-lcd display panel market is consolidated at the top. A small number of large producers in China, South Korea, Taiwan, and Japan control the majority of worldwide manufacturing capacity. Pricing competition is intense in commodity segments, pushing producers toward differentiation through technology, scale, or application-specific design. The automotive pivot reflects this directly: higher-value end-uses are where margin protection is possible.
Founded in 1969 and headquartered in Suwon, South Korea, Samsung Electronics is among the world's largest consumer electronics companies with a significant presence across TFT-LCD and OLED panel production. Its display division serves televisions, smartphones, laptops, and monitors globally. Samsung has been investing in mini-LED and QLED technologies while exploring renewed supply arrangements with Chinese manufacturers to optimise input costs.
Founded in 1985 and headquartered in Seoul, South Korea, LG Display is a leading manufacturer of TFT-LCD and OLED panels supplying major television and IT brands worldwide. The company has been expanding its automotive display business, aligning with the industry's move toward vehicle infotainment and digital cockpit applications as a hedge against commodity panel margin pressure.
Founded in 1993 and headquartered in Beijing, China, BOE Technology Group is the world's largest LCD display manufacturer by panel shipments. Its vertically integrated operations span glass substrate production through to finished display modules. In the first half of 2025, BOE reported 42% net profit growth year on year, reflecting strong momentum across its display, smart healthcare, and IoT segments.
Founded in 2001 and headquartered in Hsinchu, Taiwan, AUO Corporation is among Asia's leading TFT-LCD producers, serving television, IT, automotive, and industrial end markets. AUO has been expanding its automotive display and gaming monitor range with flexible production lines designed to shift between categories as market demand signals shift.
Other key players in the market are Japan Display Inc., Sharp Corporation, Raystar Optronics, Inc., WINSTAR Display Co., Ltd., Kingtech Group Co., Ltd., Tricomtek Co., Ltd., and others.
*Please note that this is only a partial list; the complete list of key players is available in the full report. Additionally, the list of key players can be customized to better suit your needs.*
Ready to understand where the global tft-lcd display panel market is headed and what it means for your next strategic move? Our full report for 2026-2035 delivers the data, competitive intelligence, and forward analysis to help you act with confidence. Reach out to our team to access the complete report or request a tailored version for your specific needs.
Smart Display Market
Medium and Small TFT-LCD Display Panel Market
North America Wireless Display Market
Upto 15% Off
USD
$2499 $2249
$3999 $3599
$4999 $4249
$5999 $5099


*While we strive to always give you current and accurate information, the numbers depicted on the website are indicative and may differ from the actual numbers in the main report. At Expert Market Research, we aim to bring you the latest insights and trends in the market. Using our analyses and forecasts, stakeholders can understand the market dynamics, navigate challenges, and capitalize on opportunities to make data-driven strategic decisions.*
In 2025, the TFT-LCD display panel market reached an approximate value of USD 171.19 Billion.
The market is assessed to grow at a CAGR of 4.90% between 2026 and 2035.
The market is estimated to witness healthy growth in the forecast period of 2026-2035 to reach a value of around USD 276.21 Billion by 2035.
The major drivers include the rising disposable incomes, rising demand from the educational and commercial sectors, and the rising demand for consumer electronics.
The rising household demand for average and the large-sized flat panel TVs is expected to be a key trend for the market.
North America, Europe, the Asia Pacific, Latin America, and the Middle East and Africa are the leading regions in the market, with North America accounting for the largest market share.
The leading sizes of the product can be divided into large size and medium and small size.
The product finds extensive applications in televisions, mobile phones, monitors, mobile PCs, and automotive, among others.
The leading players in the market are Samsung Electronics Co., Ltd., LG Display Co., Ltd, Japan Display Inc., Sharp Corporation, BOE Technology Group Co., Ltd., AUO Corporation, Raystar Optronics, Inc., WINSTAR Display Co., Ltd, Kingtech Group Co., Ltd, and Tricomtek Co.,Ltd, among others.
Explore our key highlights of the report and gain a concise overview of key findings, trends, and actionable insights that will empower your strategic decisions.
| REPORT FEATURES | DETAILS |
| Base Year | 2025 |
| Historical Period | 2019-2025 |
| Forecast Period | 2026-2035 |
| Scope of the Report |
Historical and Forecast Trends, Industry Drivers and Constraints, Historical and Forecast Market Analysis by Segment:
|
| Breakup by Size |
|
| Breakup by Application |
|
| Breakup by Region |
|
| Market Dynamics |
|
| Competitive Landscape |
|
| Companies Covered |
|
Datasheet
One User
USD 2,499
USD 2,249
tax inclusive*
Single User License
One User
USD 3,999
USD 3,599
tax inclusive*
Five User License
Five User
USD 4,999
USD 4,249
tax inclusive*
Corporate License
Unlimited Users
USD 5,999
USD 5,099
tax inclusive*
*Please note that the prices mentioned below are starting prices for each bundle type. Kindly contact our team for further details.*
Flash Bundle
Small Business Bundle
Growth Bundle
Enterprise Bundle
*Please note that the prices mentioned below are starting prices for each bundle type. Kindly contact our team for further details.*
Flash Bundle
Number of Reports: 3
20%
tax inclusive*
Small Business Bundle
Number of Reports: 5
25%
tax inclusive*
Growth Bundle
Number of Reports: 8
30%
tax inclusive*
Enterprise Bundle
Number of Reports: 10
35%
tax inclusive*
How To Order

Select License Type
Choose the right license for your needs and access rights.

Click on ‘Buy Now’
Add the report to your cart with one click and proceed to register.

Select Mode of Payment
Choose a payment option for a secure checkout. You will be redirected accordingly.
Strategic Solutions for Informed Decision-Making
Gain insights to stay ahead and seize opportunities.

Get insights & trends for a competitive edge.

Track prices with detailed trend reports.

Analyse trade data for supply chain insights.

Leverage cost reports for smart savings

Enhance supply chain with partnerships.

Connect For More Information
Our expert team of analysts will offer full support and resolve any queries regarding the report, before and after the purchase.
Our expert team of analysts will offer full support and resolve any queries regarding the report, before and after the purchase.
We employ meticulous research methods, blending advanced analytics and expert insights to deliver accurate, actionable industry intelligence, staying ahead of competitors.
Our skilled analysts offer unparalleled competitive advantage with detailed insights on current and emerging markets, ensuring your strategic edge.
We offer an in-depth yet simplified presentation of industry insights and analysis to meet your specific requirements effectively.


