

Consumer Insights
Uncover trends and behaviors shaping consumer choices today
Procurement Insights
Optimize your sourcing strategy with key market data
Industry Stats
Stay ahead with the latest trends and market analysis.
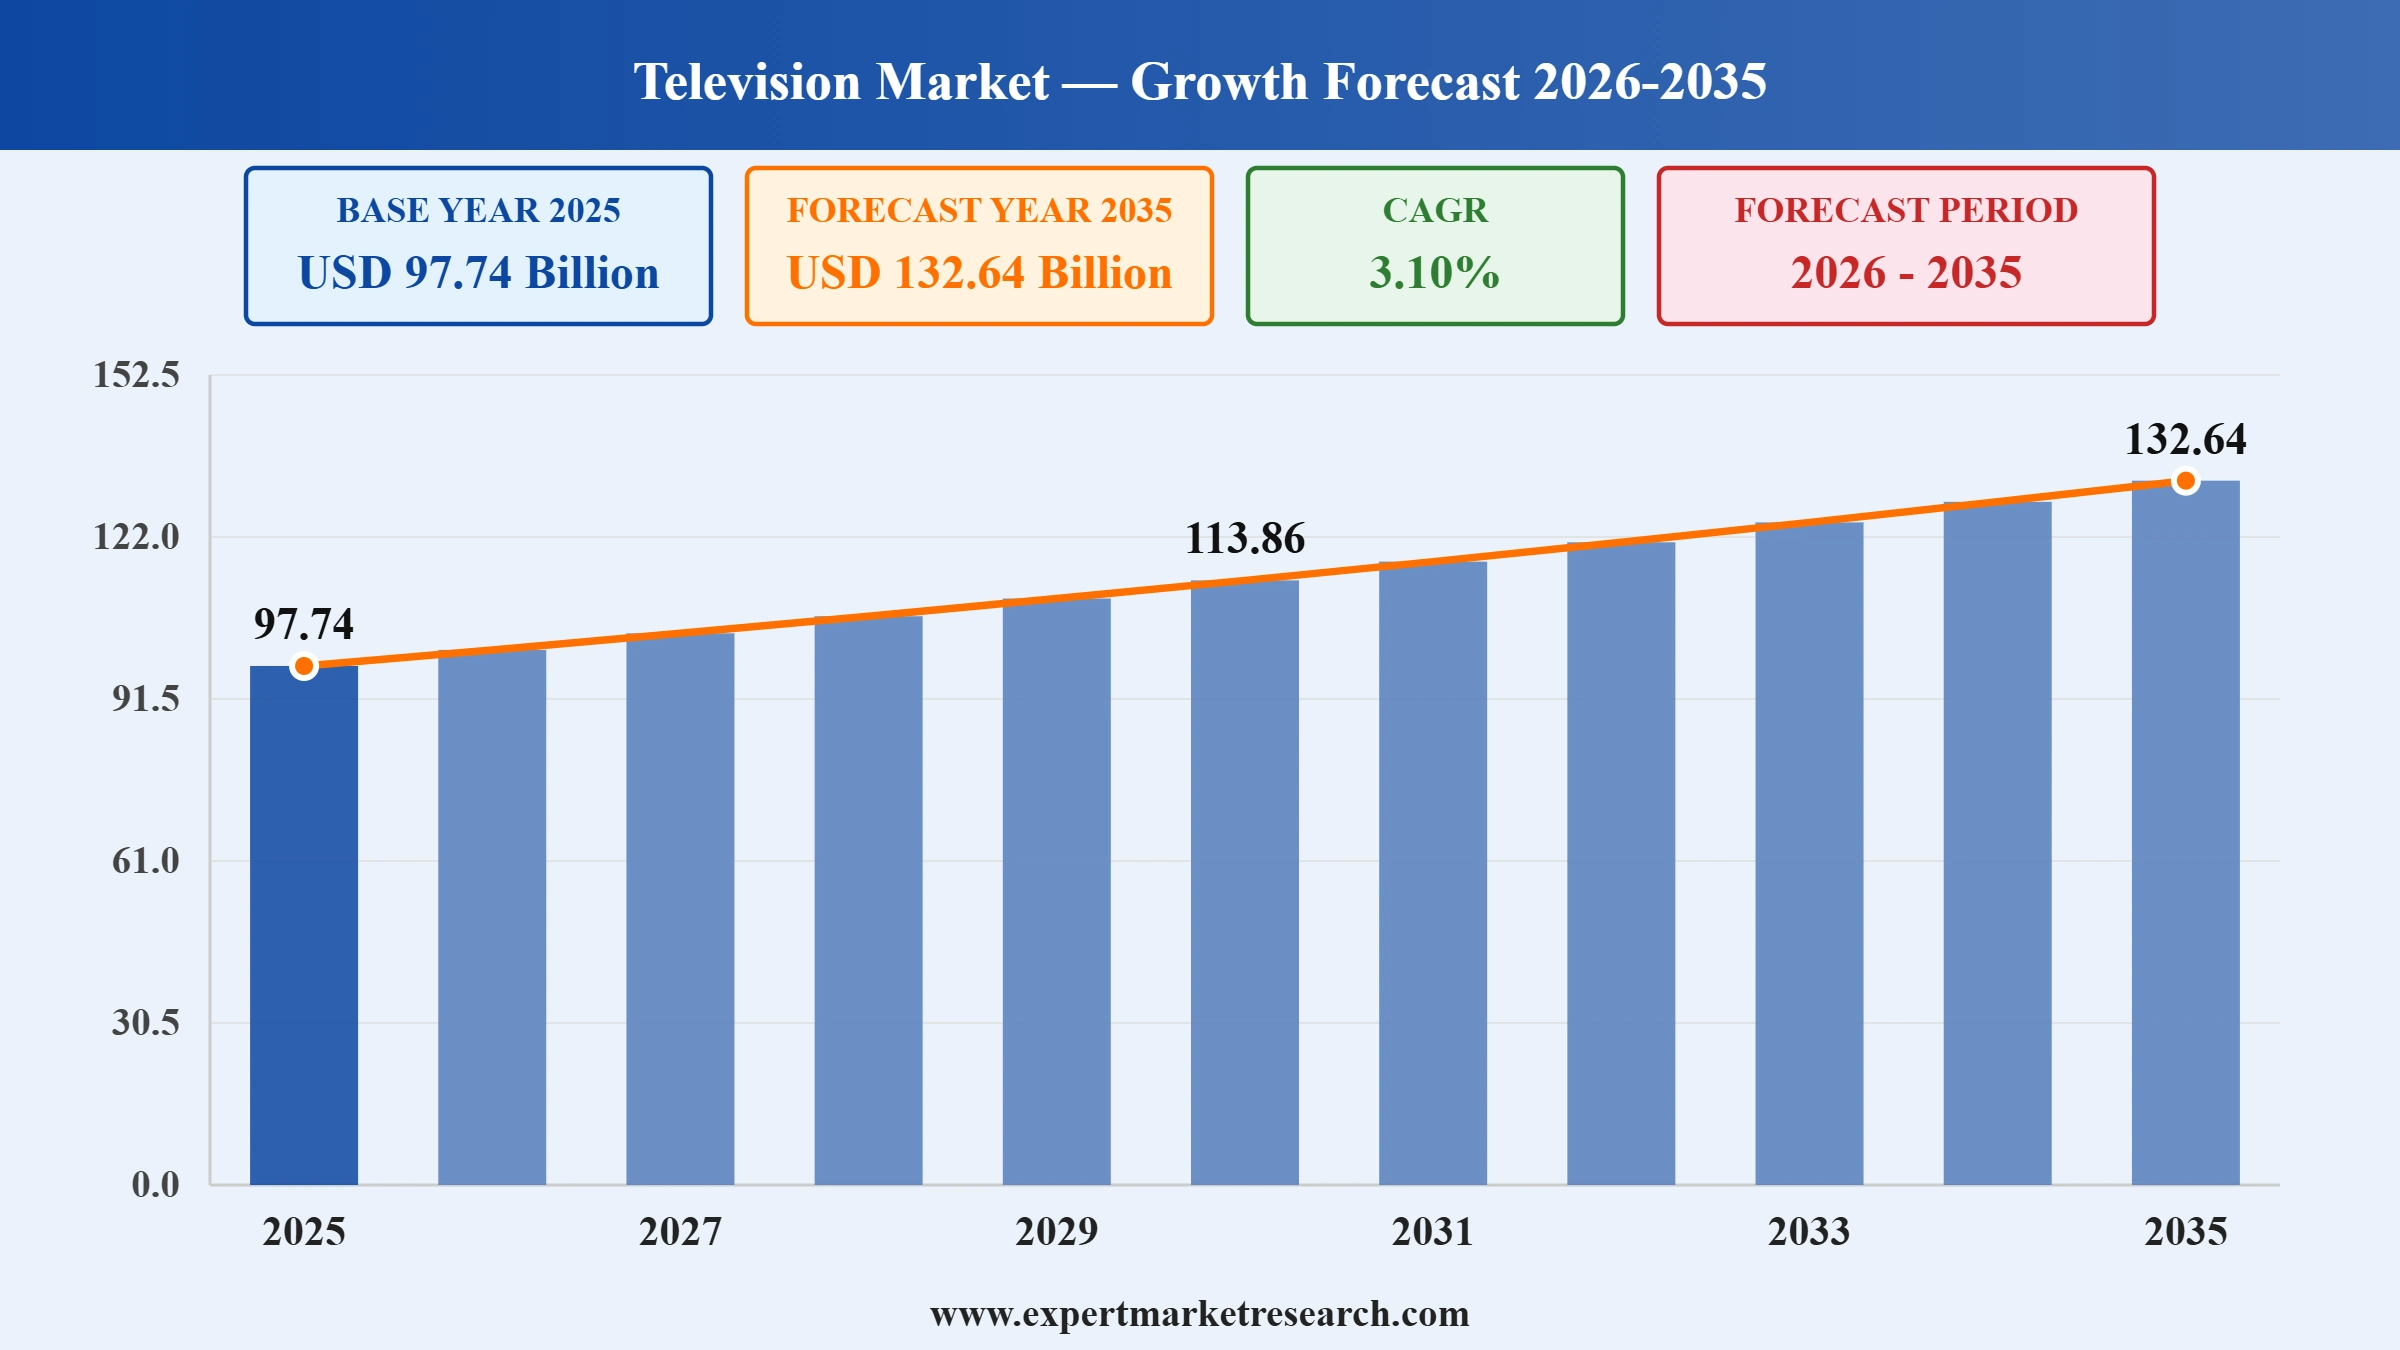
The global television market attained a value of USD 97.74 Billion in 2025 and is projected to expand at a CAGR of 3.10% through 2035. The market is further expected to achieve USD 132.64 Billion by 2035. Surging demands for ad-supported streaming user interfaces are driving companies to focus on software and content licensing deals, making the TV a revenue model in the long term.
There are two factors that are influencing the present television market trends. First, the ongoing trend towards bigger screen sizes, made possible by falling costs of production, allowing for the premiumization of even mid-tier products. Secondly, the increasing demand for high-quality displays in the corporate and hospitality sectors is leading to the development of a new business-to-business market channel distinct from the consumer retail sector.
Manufacturers of smart televisions are focusing on product roadmaps that must be aimed at content ecosystems and not just specifications of hardware products. Leading companies in the television market are redirecting their marketing messages from specification to operating systems and streaming partnerships in order to keep customers engaged even after selling a product. This shift is driven by the understanding that hardware profit margins are becoming increasingly narrow, making televisions more valuable as advertising platforms than as standalone hardware products. For example, in May 2026, Samsung launched its 2026 Vision AI TV lineup with 72 AI-powered models across premium display technologies in India.
The component sourcing strategy is becoming an important determinant of competitive position in the television market. Panel manufacturers are trying to consolidate contracts and fixing input costs while brands that have integrated component chains try to take the advantage and reduce prices for their premium products. Mini-LED and OLED technologies keep getting more attention in terms of R&D funding. In addition, in January 2025, TCL launched the 115-inch QD Mini LED TV 115X955 Max in India, delivering AI-powered premium large-screen home entertainment experiences.
Read more about this report - REQUEST FREE SAMPLE COPY IN PDF
TCL introduced the A400 Pro NXTVision TV with aesthetically inspired designs, QD Mini LED, and AI-based picture quality to provide premium entertainment. Companies may use lifestyle-oriented designs and AI-driven displays to attract premium consumers of home decor and entertainment.
Lumio unveiled Vision 7 and Vision 9 Smart TVs with Google TV, advanced processors, and audiovisual experience in Indian households. Companies may distinguish themselves by using premium smart TV platforms, streaming experiences, and value-based specifications.
Samsung rolled out its Performance TV product line with AI-enabled advertising solutions, helping firms to optimize targeting, measuring campaigns, and connecting TV engagement. Companies can therefore develop AI-enabled advertising ecosystems to enhance content monetization while delivering personalized connected TV experiences.
LG unveiled QNED Evo and OLED Evo AI TVs with AI processing, advanced brightness, and personalized experiences in premium categories. Firms can therefore invest in picture optimization through AI and advanced displays in the high-end television market.
The rise in income levels is leading consumers to purchase premium televisions with OLED, QLED, Mini-LED, and 8K display technologies, fueled by the demand for immersive entertainment. Televisions are becoming bigger in size than 65 inches, incorporating AI-driven picture optimization technology and gaming technologies to stand out from the crowd. For instance, Samsung upgraded its OLED TV lineup with premium AI features, Glare Free technology, refined designs, and advanced gaming capabilities in April 2026. The government's efforts to promote the production of semiconductors include the United States CHIPS and Science Act and India's Semiconductor Mission, further accelerating demand in the television market.
AI is turning televisions into entertainment portals by offering personalized content recommendation features, voice assistants, live picture optimization, and smart homes connectivity. Consumers are becoming more inclined to purchasing televisions that can easily integrate with IoT devices, streaming channels, and cloud-based technologies. For example, Samsung has equipped multiple television sets with Vision AI capabilities, which allow for the automatic detection of contents. Aligning with this trend in the television market, in July 2026, Aaj Tak launched India's first AI-powered Vertical TV, transforming live news into immersive mobile-first viewing through adaptive real-time broadcasting.
The increased adoption of console gaming, cloud gaming, and esports is driving the need for televisions with 120Hz or faster refresh rate, HDMI 2.1 connectivity, VRR and ultra-low latency, boosting demand in the television market. Manufacturers are collaborating with gaming firms to provide a premium gaming experience on large screens. For example, in July 2026, LG showcased its premium 4K AI television lineup, delivering cinematic visuals, immersive gaming, and intelligent personalized home entertainment experiences. Government investments in digital infrastructure and gaming industries, including South Korea's funding for immersive digital content and Japan's support for entertainment technologies, are accelerating innovation and market growth.
Sustainability is becoming an increasingly important purchase consideration as manufacturers develop energy efficient televisions that use recycled materials, environmentally sustainable packaging, and reduced emission manufacturing processes. Compliance with international energy regulations is fostering ongoing developments in efficiency within televisions, reshaping the overall television market dynamics and trends. For instance, in May 2026, LG expanded its ESG strategy with eco-certified OLED TVs, reducing carbon footprint through sustainable materials and energy-efficient display technologies. Regulative frameworks include EU Ecodesign Directive and Energy Labelling Regulations, along with the United States ENERGY STAR program.
The quick growth in streaming technology is promoting users to shift from normal television sets to smarter televisions connected to the Internet that can provide users with superior entertainment experience. Producers are now forming partnerships with the streaming companies to offer integrated software, unique content, and even subscriptions to the streaming services, creating new television market opportunities. Some examples include the development of smarter television sets by Roku and TCL through their partnership, and integration of Fire TV technology by Amazon in televisions made by different brands around the world. On the other hand, in June 2026, Dish TV launched VZY Smart TVs integrating DTH, OTT streaming, Google TV, and QLED displays for seamless entertainment experiences.
The EMR’s report titled “Television Market Report and Forecast 2026-2035” offers a detailed analysis of the market based on the following segments:
Market Breakup by Type
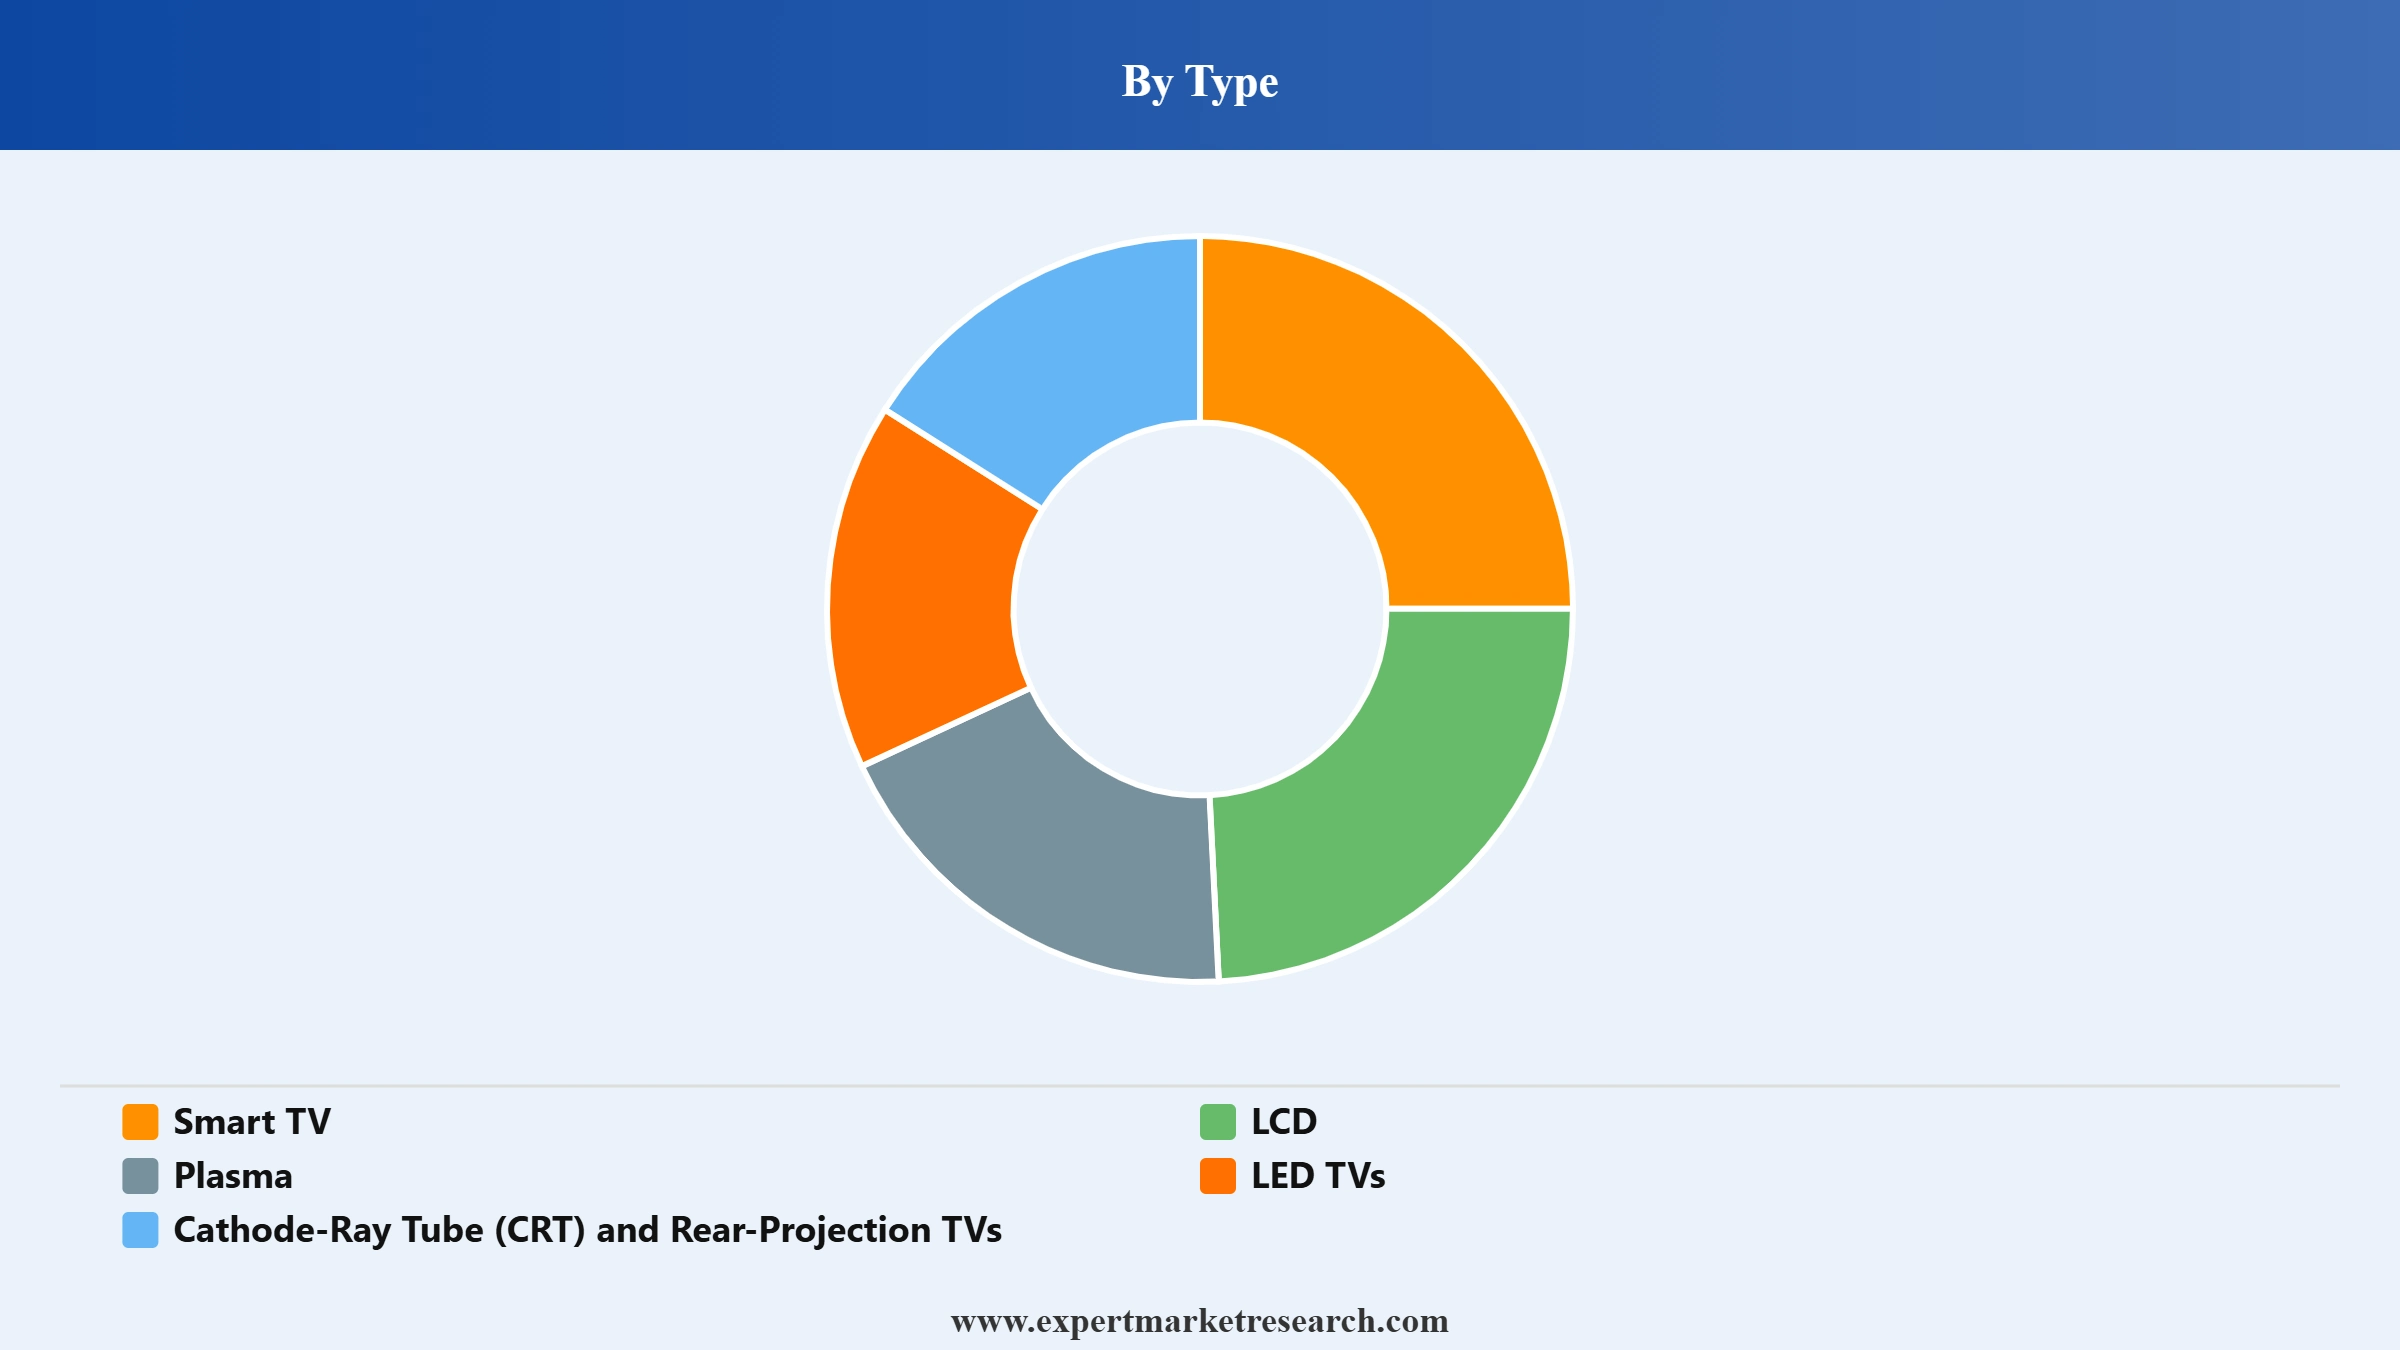
Key Insight: The television market displays different consumer considerations depending on the category of products. Smart TVs are dominating the industry due to the fact that connected entertainment, integrated applications, and intelligent software functionalities are becoming increasingly essential considerations in buying these products. LCD and LED TVs are expanding their shares rapidly as a result of offering better visuals at reduced costs. The popularity of CRTs and rear-projection TVs are declining as customers are moving towards more energy efficient and Internet enabled TV sets that provide better visuals.
Market Breakup by Distribution Channel
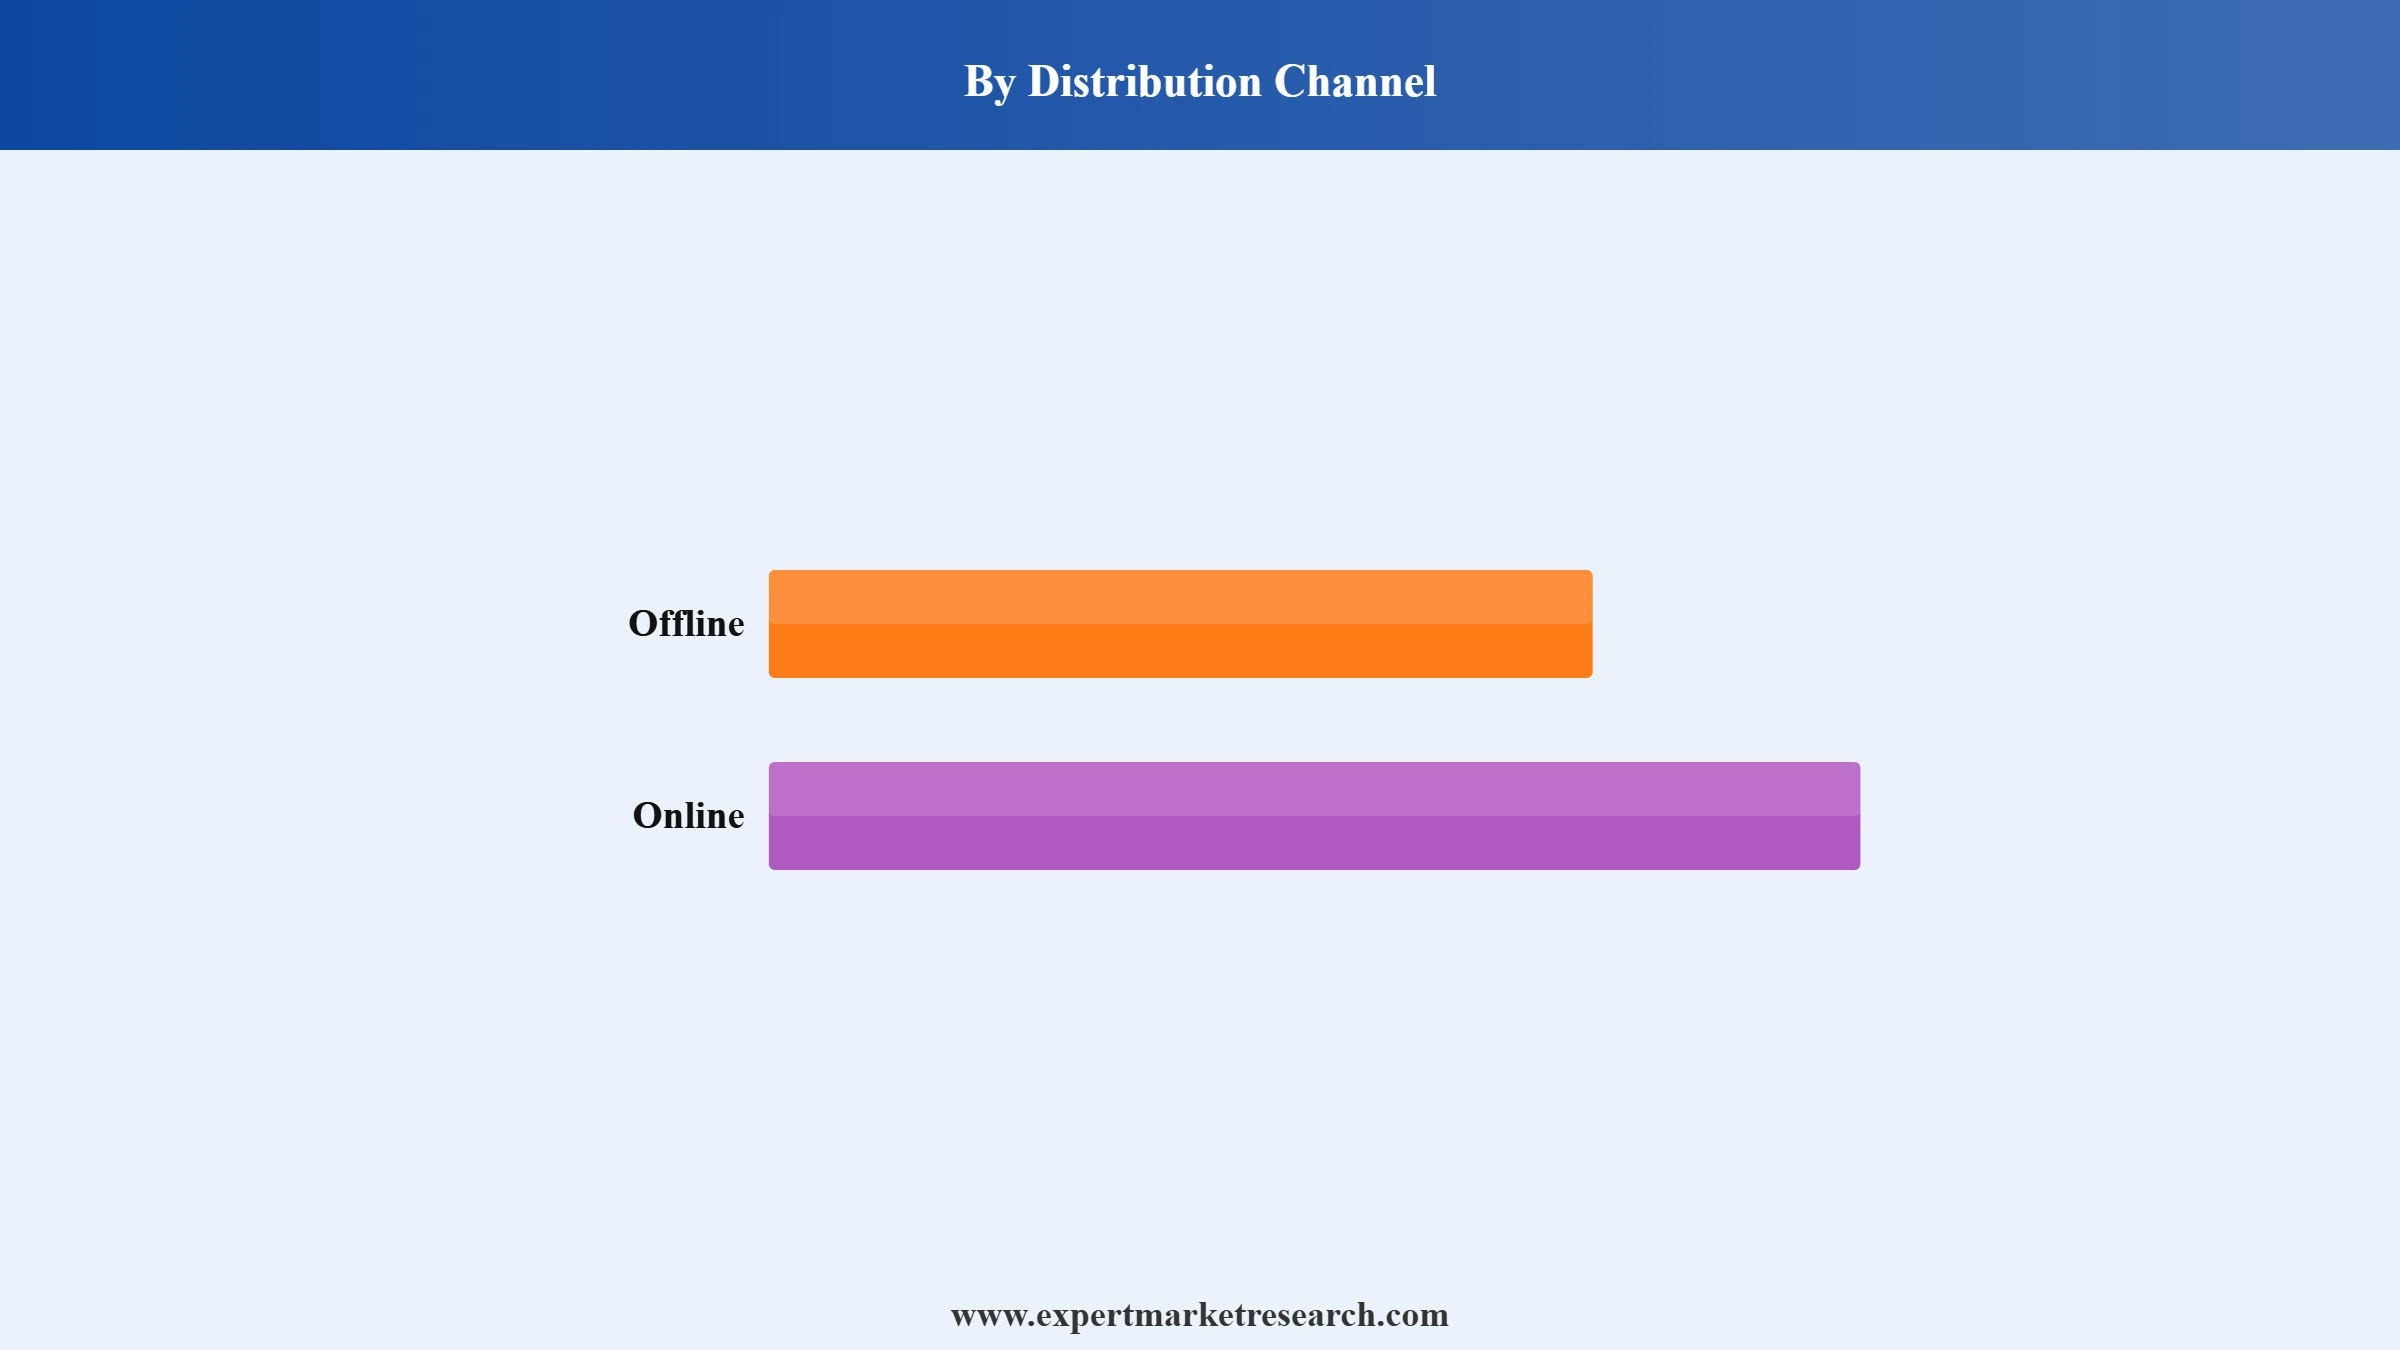
Key Insight: The distribution channels are changing alongside the changes in purchasing behavior, further reshaping the television market dynamics. Brick-and-mortar retailers lead in this regard due to their advantages of providing physical assessment of products, personalized service, installation and higher purchase assurance for luxury goods. The online retailing channel is growing at an incredible pace due to their provision of convenience, product availability, price transparency, and effective promotions through promotional campaigns. In June 2026, Glance partnered with Samsung to introduce AI-powered interactive shopping on smart TVs, enabling personalized commerce through connected television experiences.
Market Breakup by Screen size
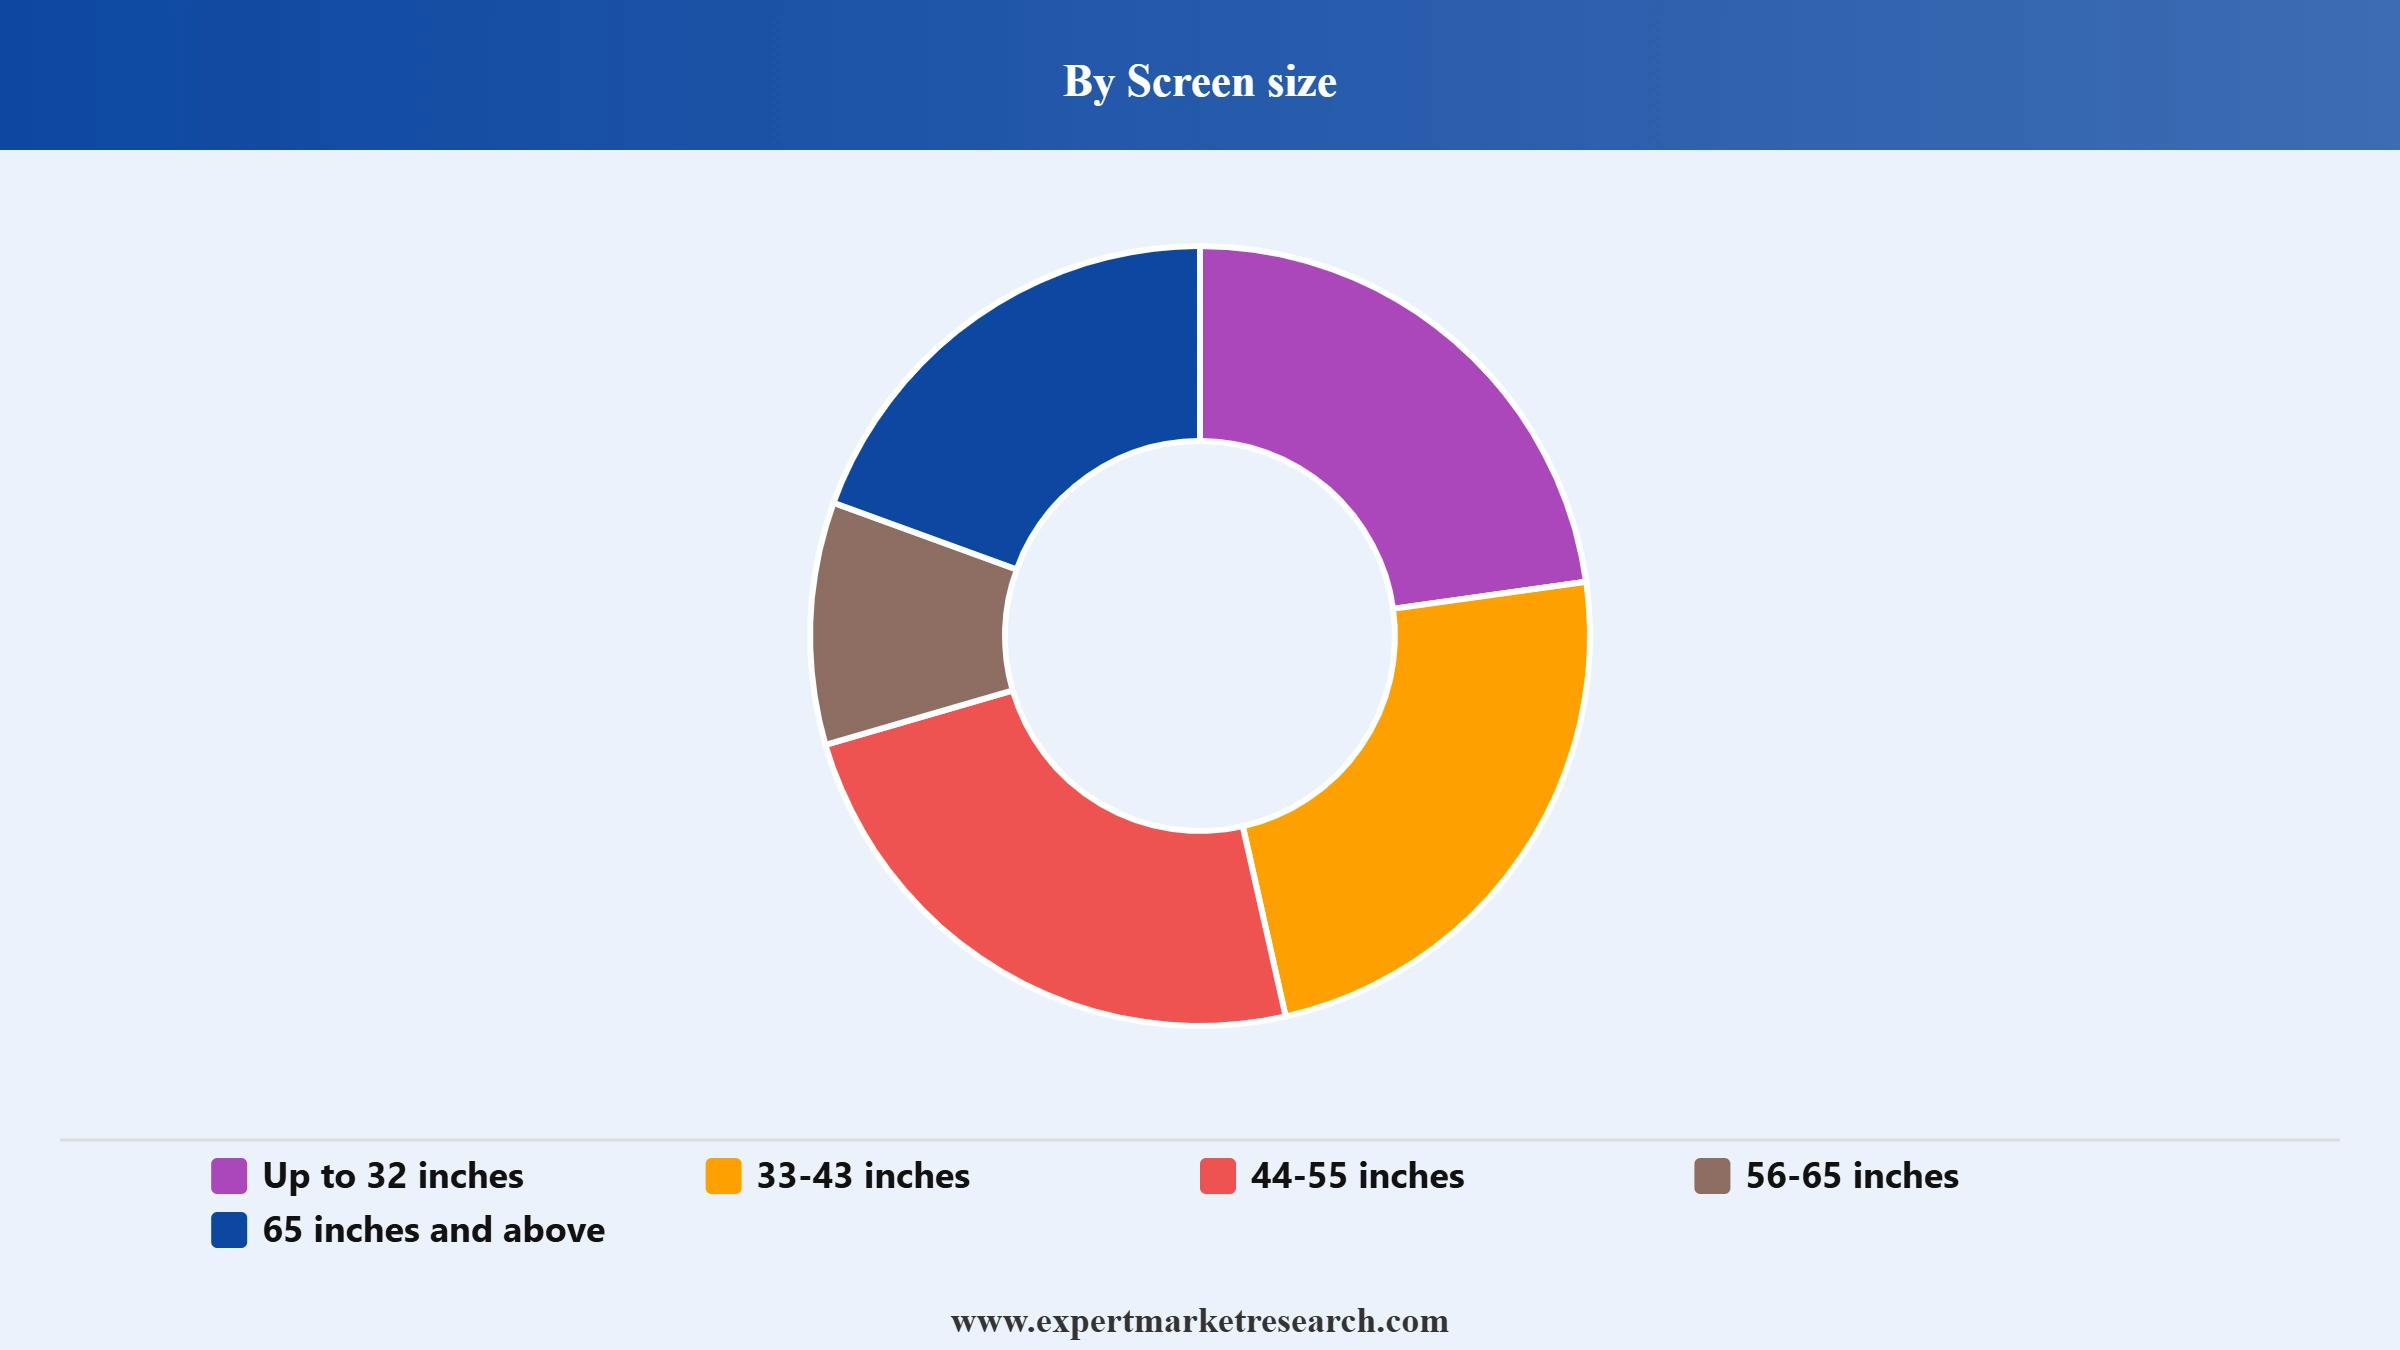
Key Insight: Consumer preference for television screen sizes varies based on household requirements, viewing distance, and budget. The size of 44-55 inches continues to be popular due to its ability to meet entertainment purposes without being too large. Small televisions are also used in additional rooms and smaller homes. The televisions ranging from 56-65 inches in size appeal to people desiring better cinematic enjoyment without having to pay for expensive ones. Televisions bigger than 65 inches are gaining popularity owing to luxury positioning and advanced display technologies.
Market Breakup by Resolution
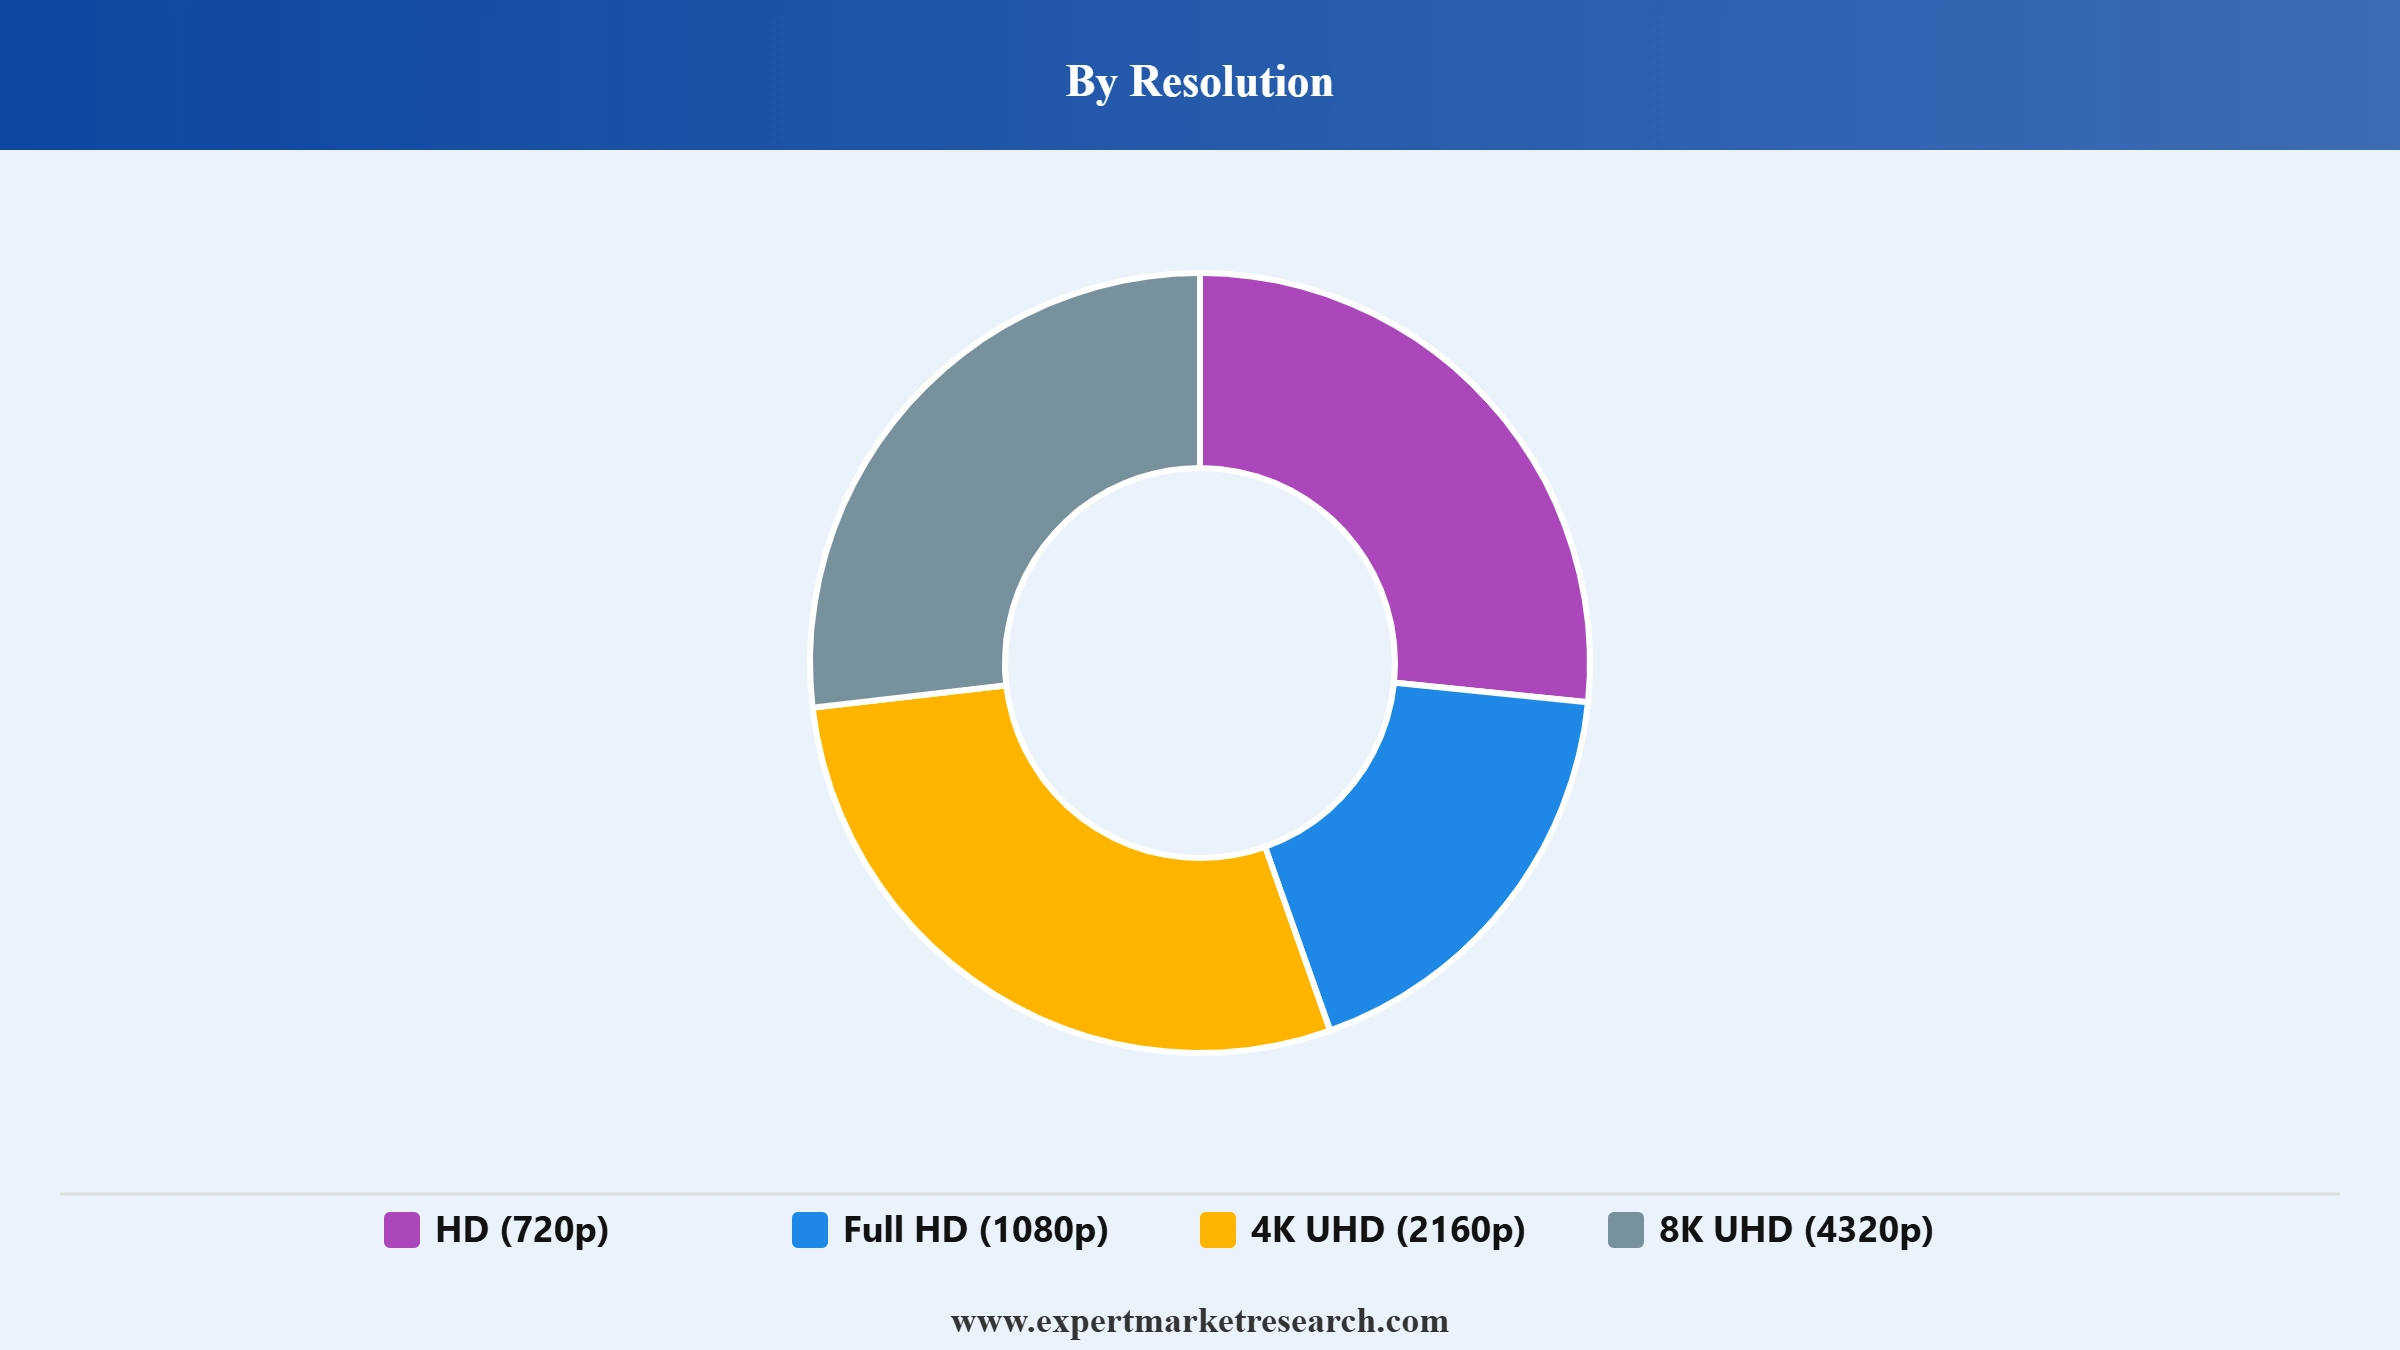
Key Insight: Resolution preferences across the television market scope are becoming more inclined towards consumer preference for higher-quality images and better visuals. HD and Full HD are used by first-time buyers or consumers who prefer smaller sizes. Yet, 4K UHD is now the standard since it offers great image quality without being expensive for many types of television sets. On the other hand, 8K UHD is gaining popularity as the premium one due to its processors and bigger screens. In April 2024, Samsung launched new 8K and 4K AI-powered TVs in India, enhancing picture quality, gaming, security, and personalized entertainment experiences.
Market Breakup by Smart Features
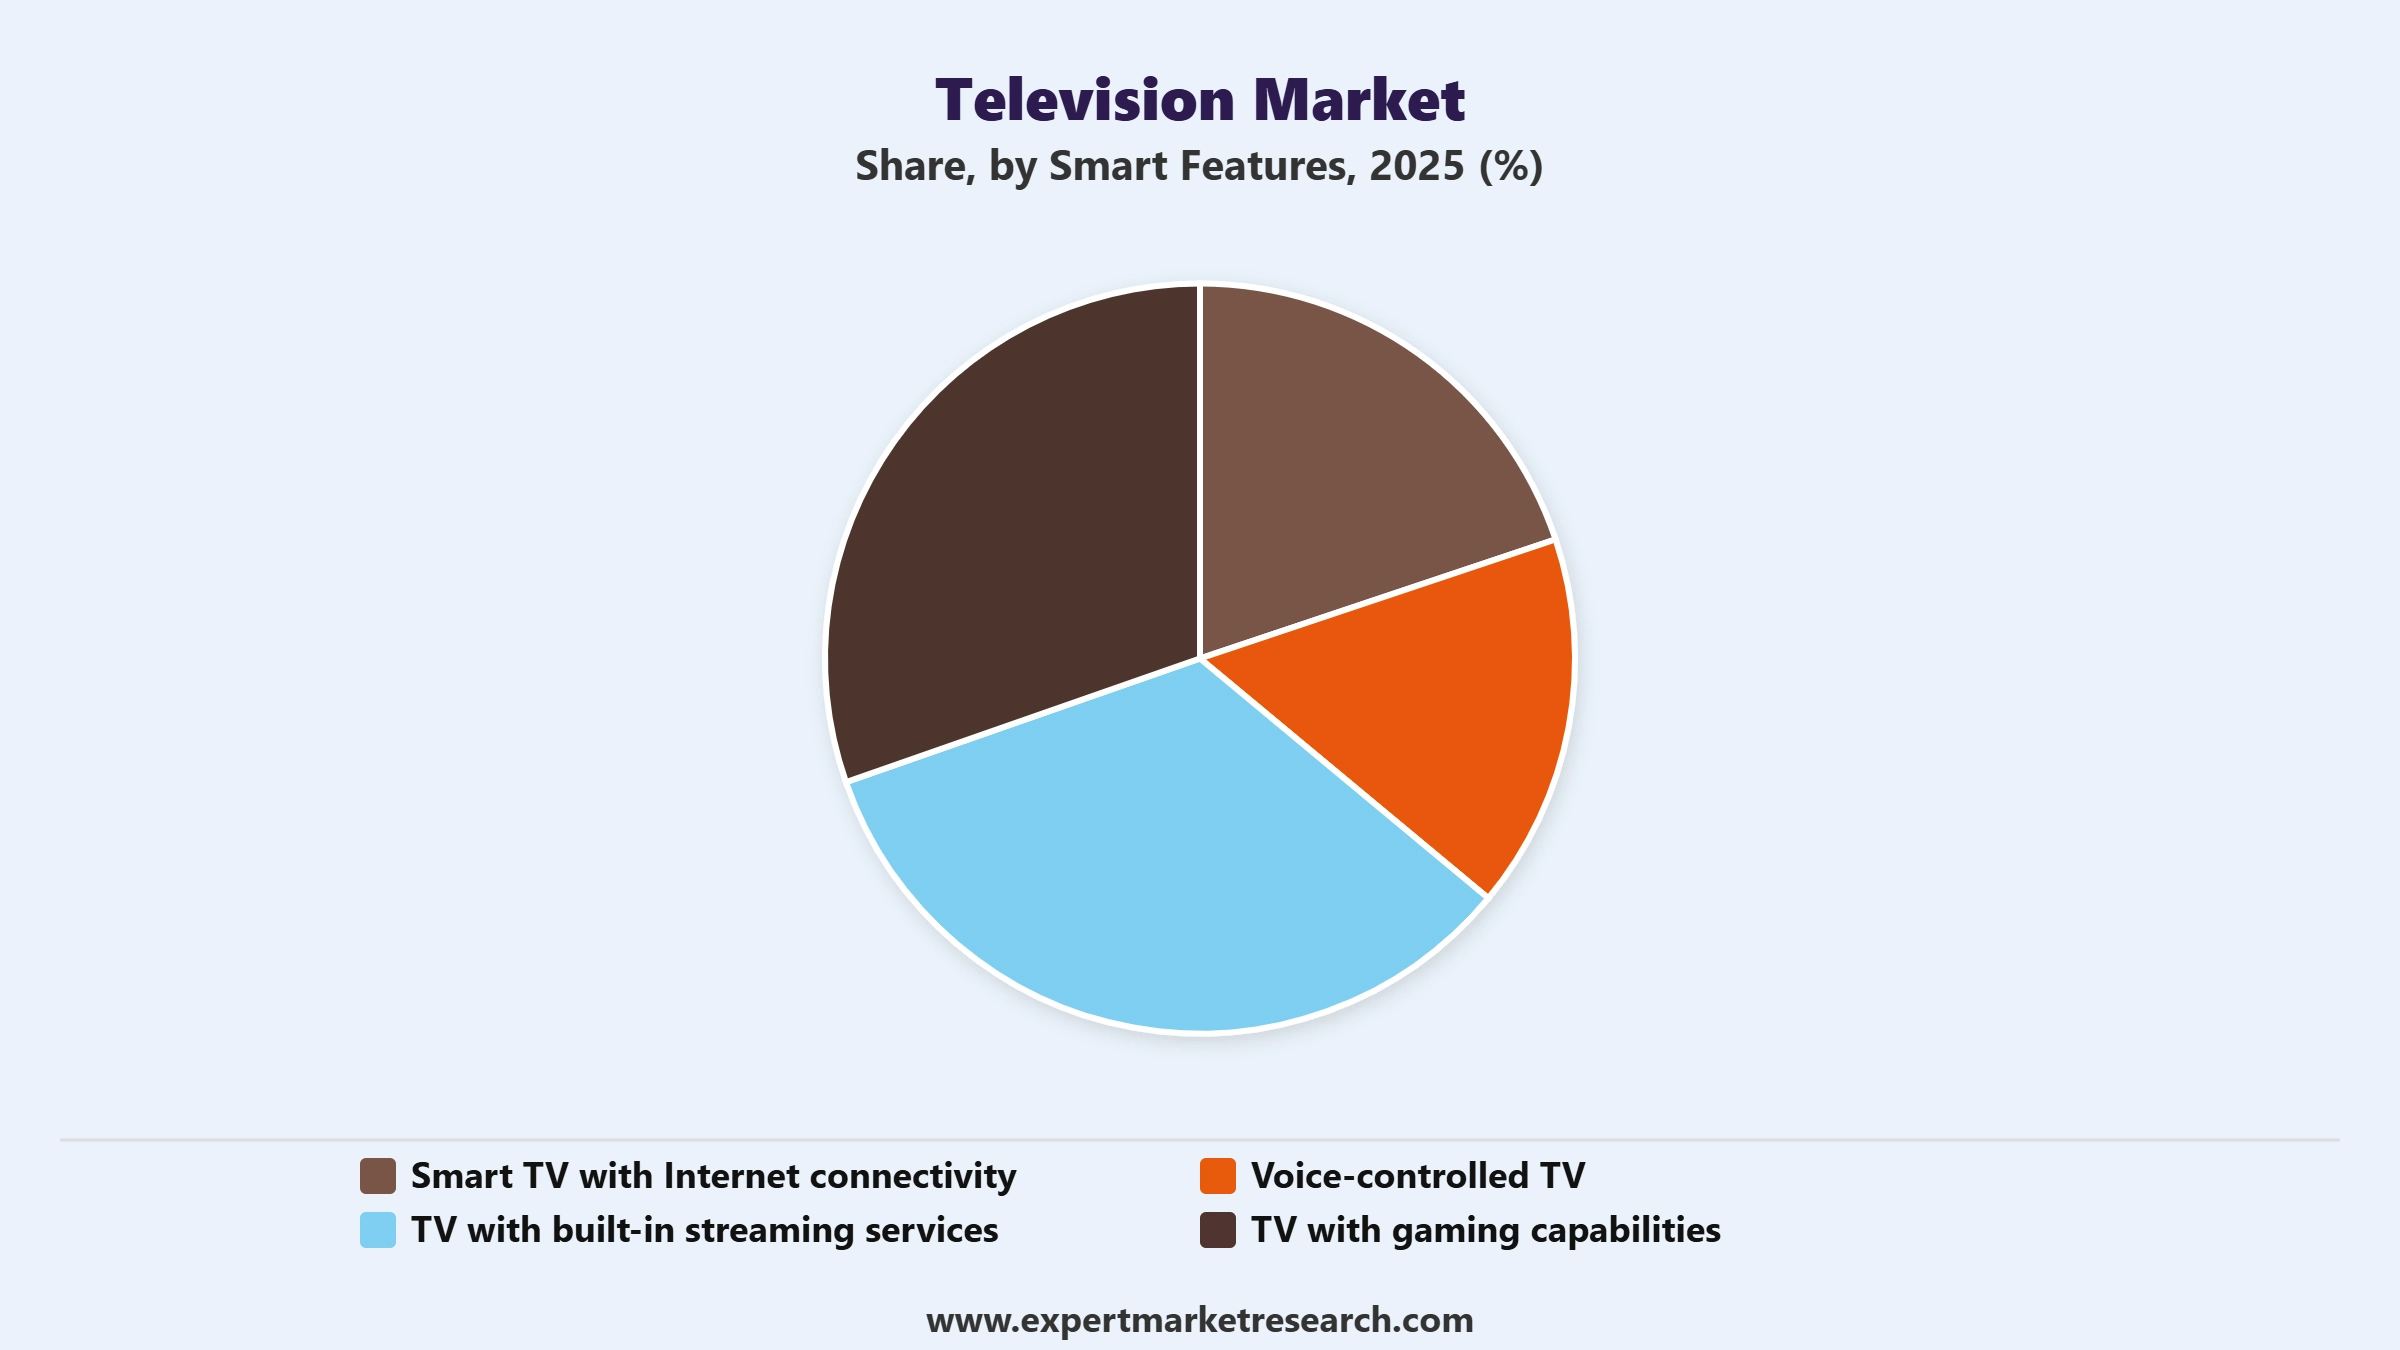
Key Insight: The smart televisions with Internet connectivity category captures the largest share within the television market revenue, owing to increased broadband penetration and the demand for connected entertainment options. There is an increasing preference for televisions that offer built-in internet connectivity and voice assistant technology, built-in streaming software and compatibility with smart home devices, minimizing the use of auxiliary devices. On the other hand, televisions that can be controlled via voice commands, televisions with streaming services built-in, and those that can be used to play games are being adopted extensively.
Market Breakup by Price Range
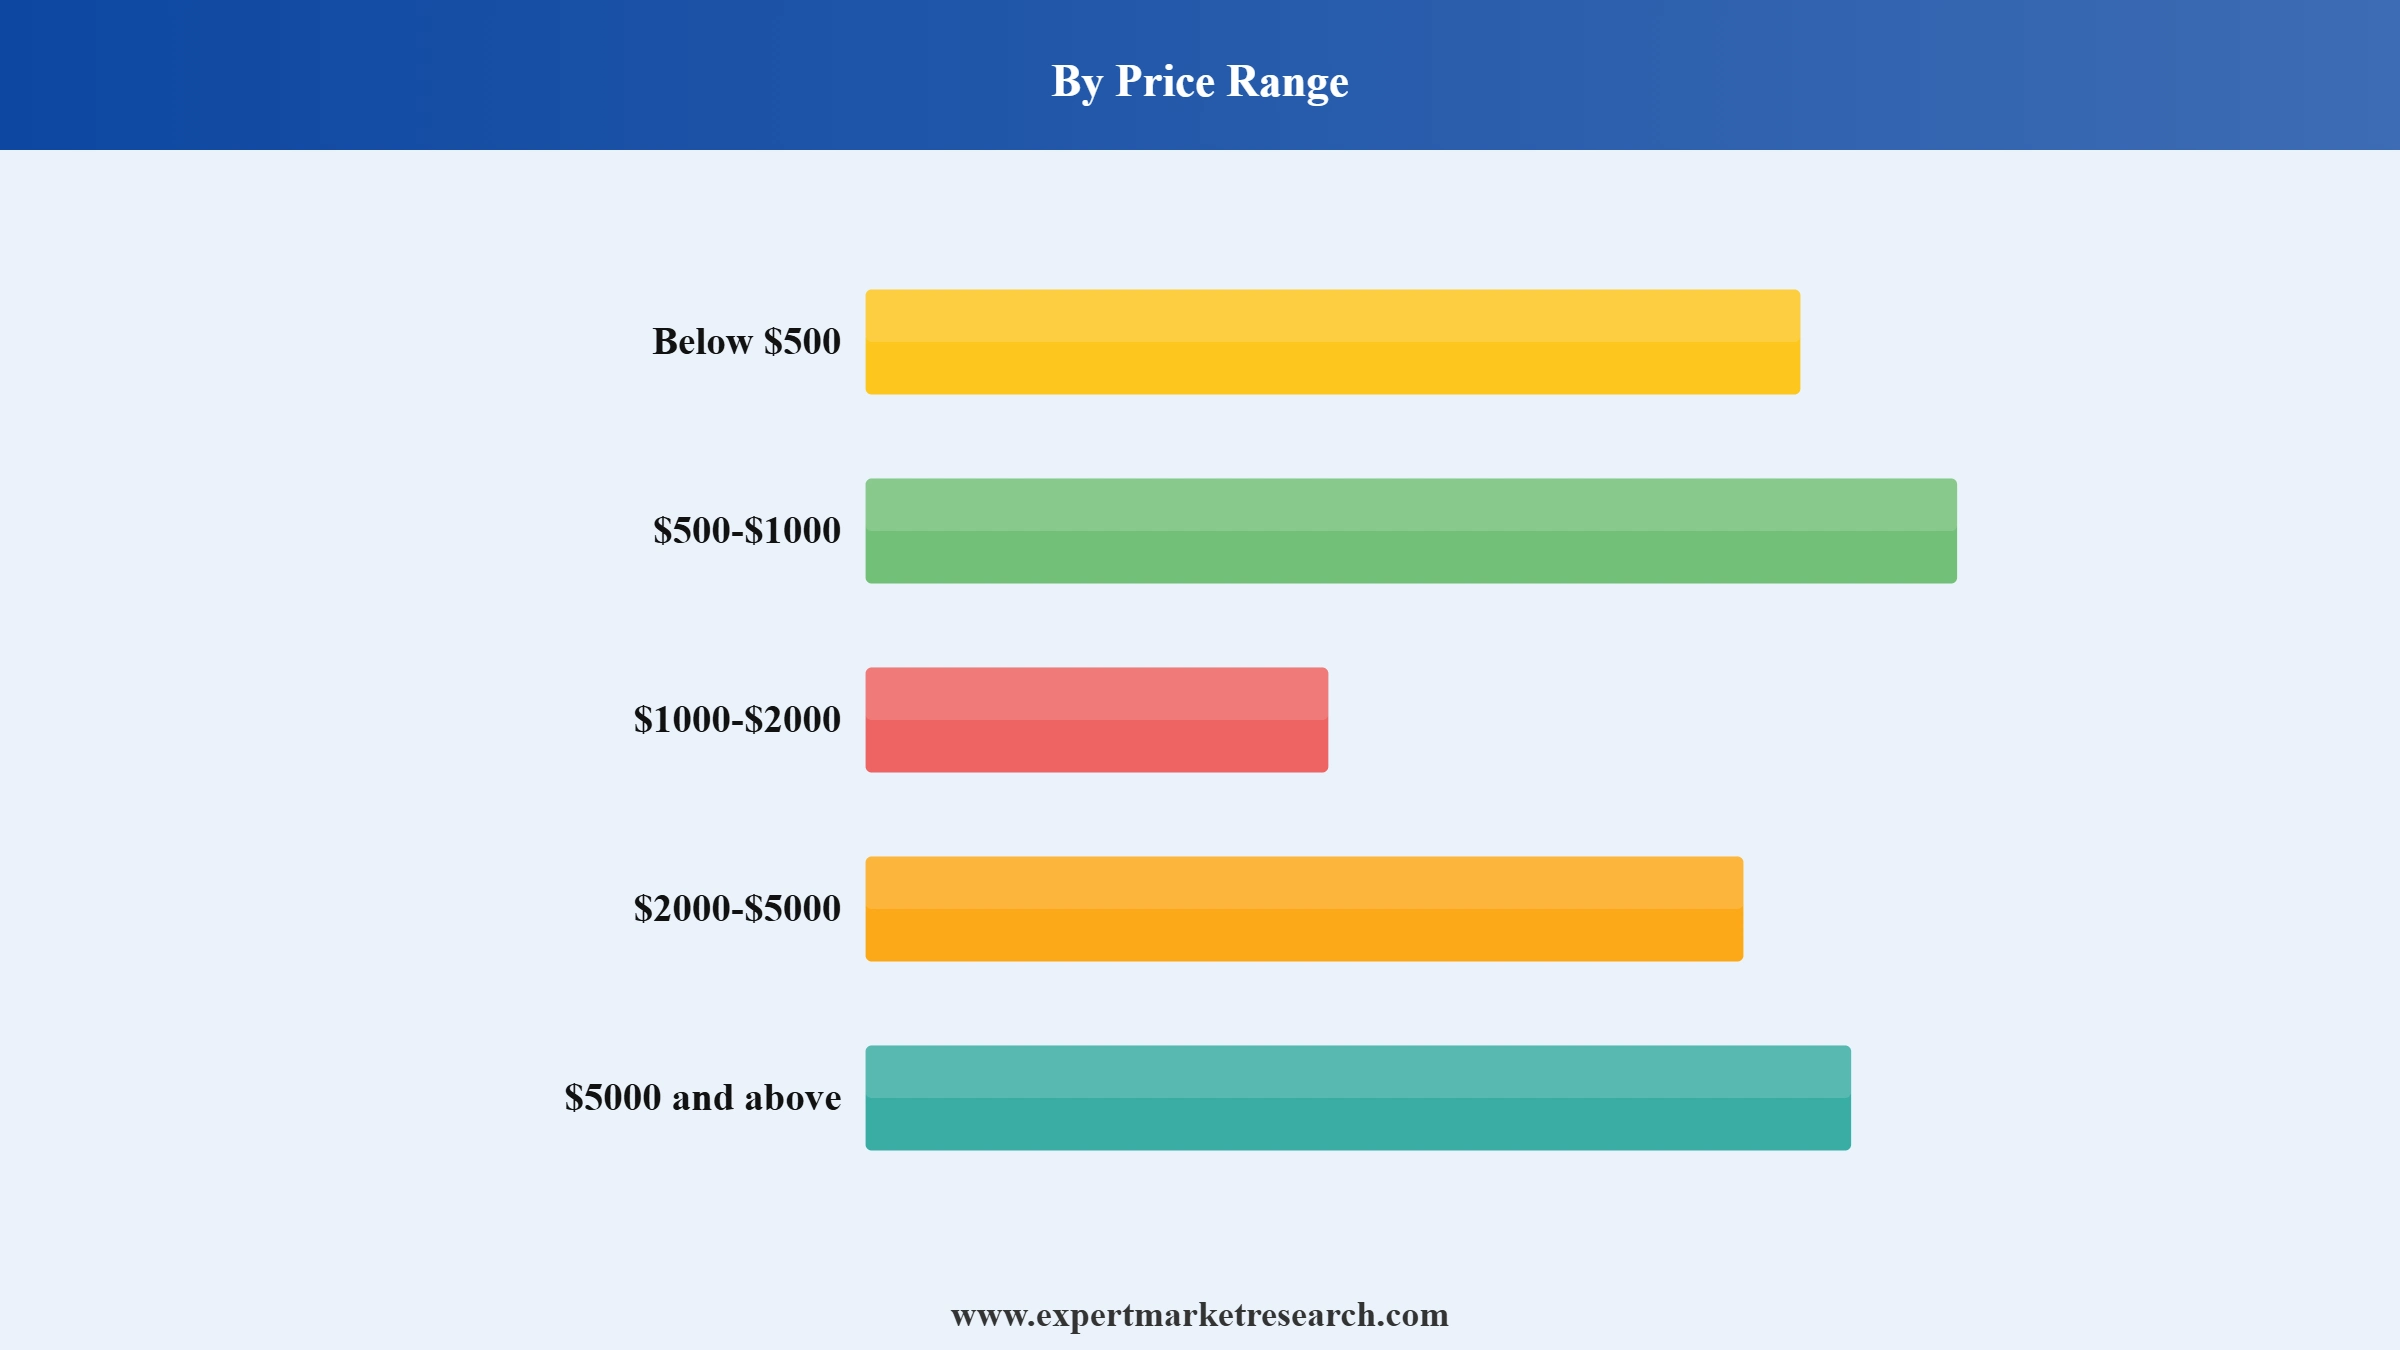
Key Insight: The television market caters to a broad range of consumers across multiple price segments. Models priced below USD 500 remain popular among budget-conscious buyers seeking essential smart features. The USD 500 USD 1,000 and USD 1,000- USD 2,000 categories attract mainstream consumers looking for larger displays, enhanced picture quality, and advanced connectivity. Premium televisions in the USD 2,000- USD 5,000 range offer technologies such as OLED, Mini-LED, and AI-powered features, while models priced above USD 5,000 target luxury buyers with ultra-large screens and immersive home entertainment experiences.
Market Breakup by Region
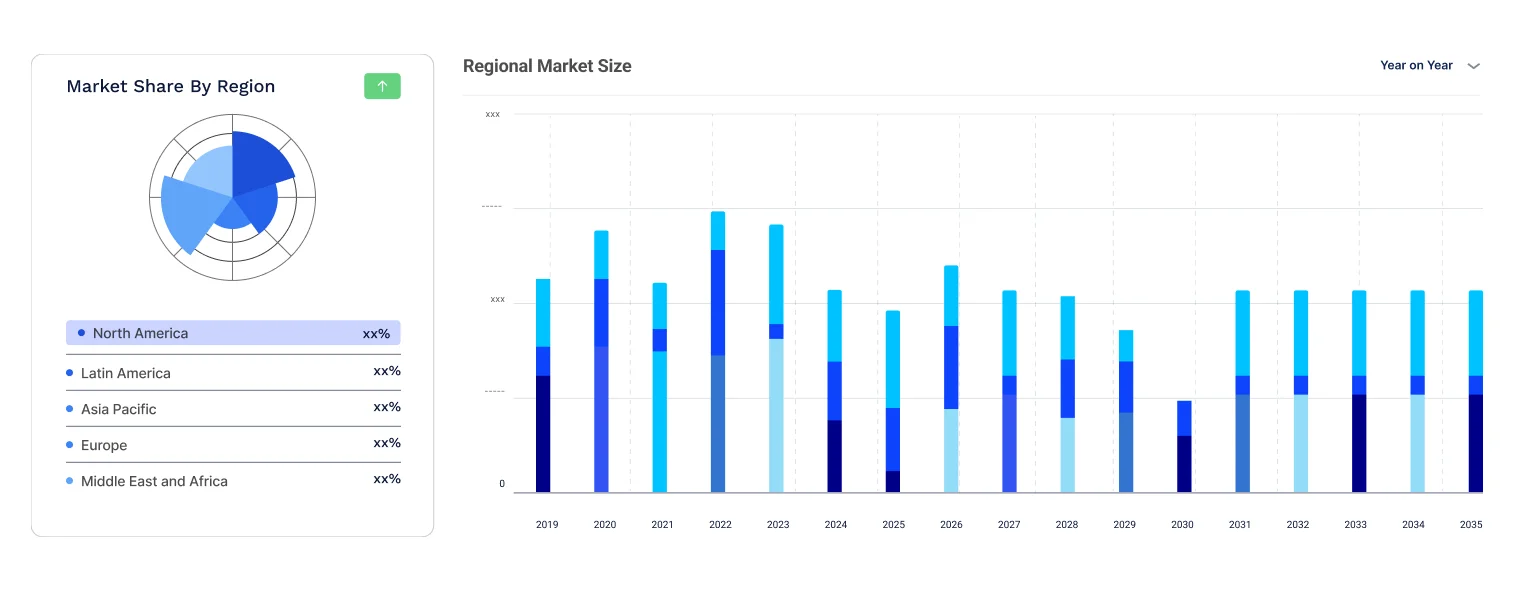
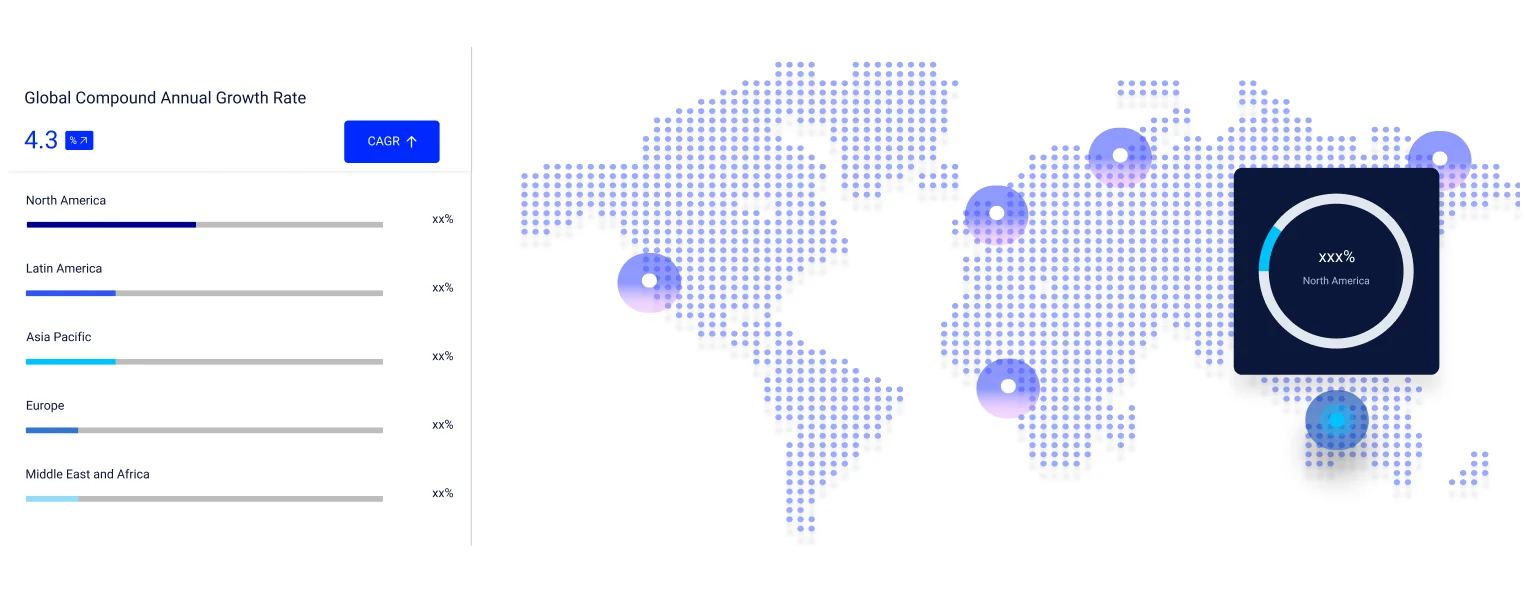
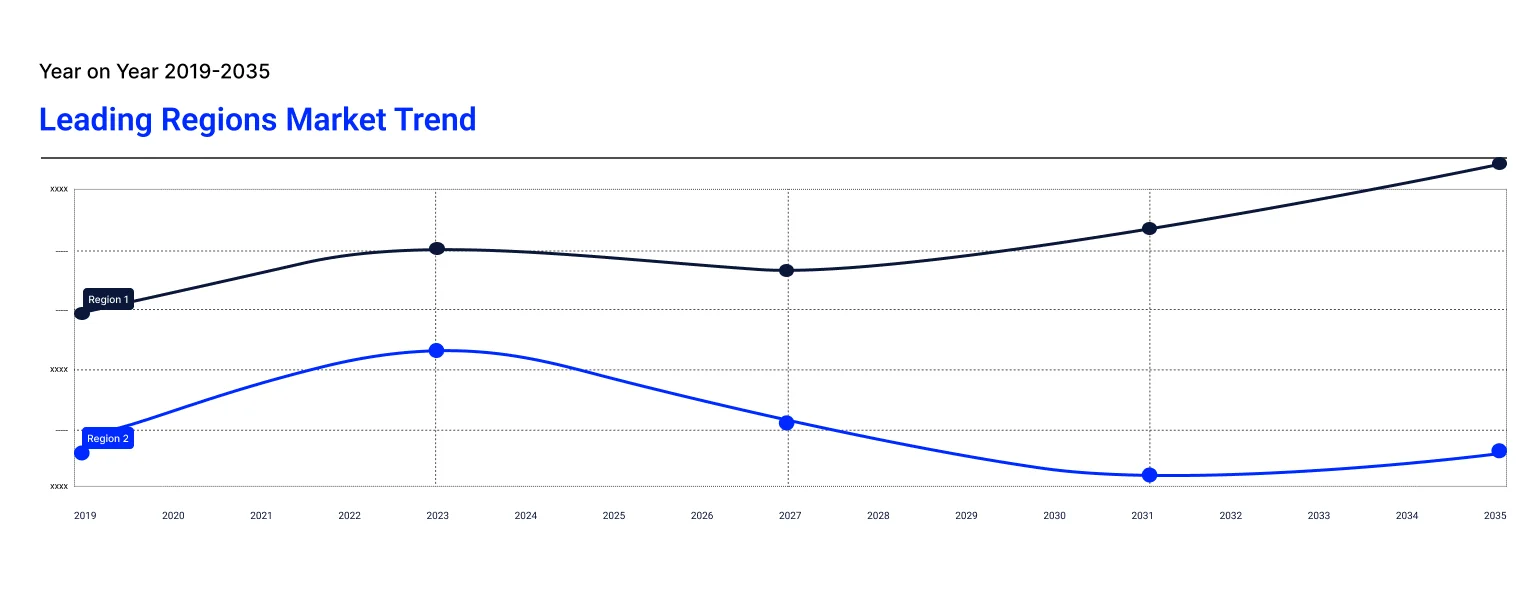
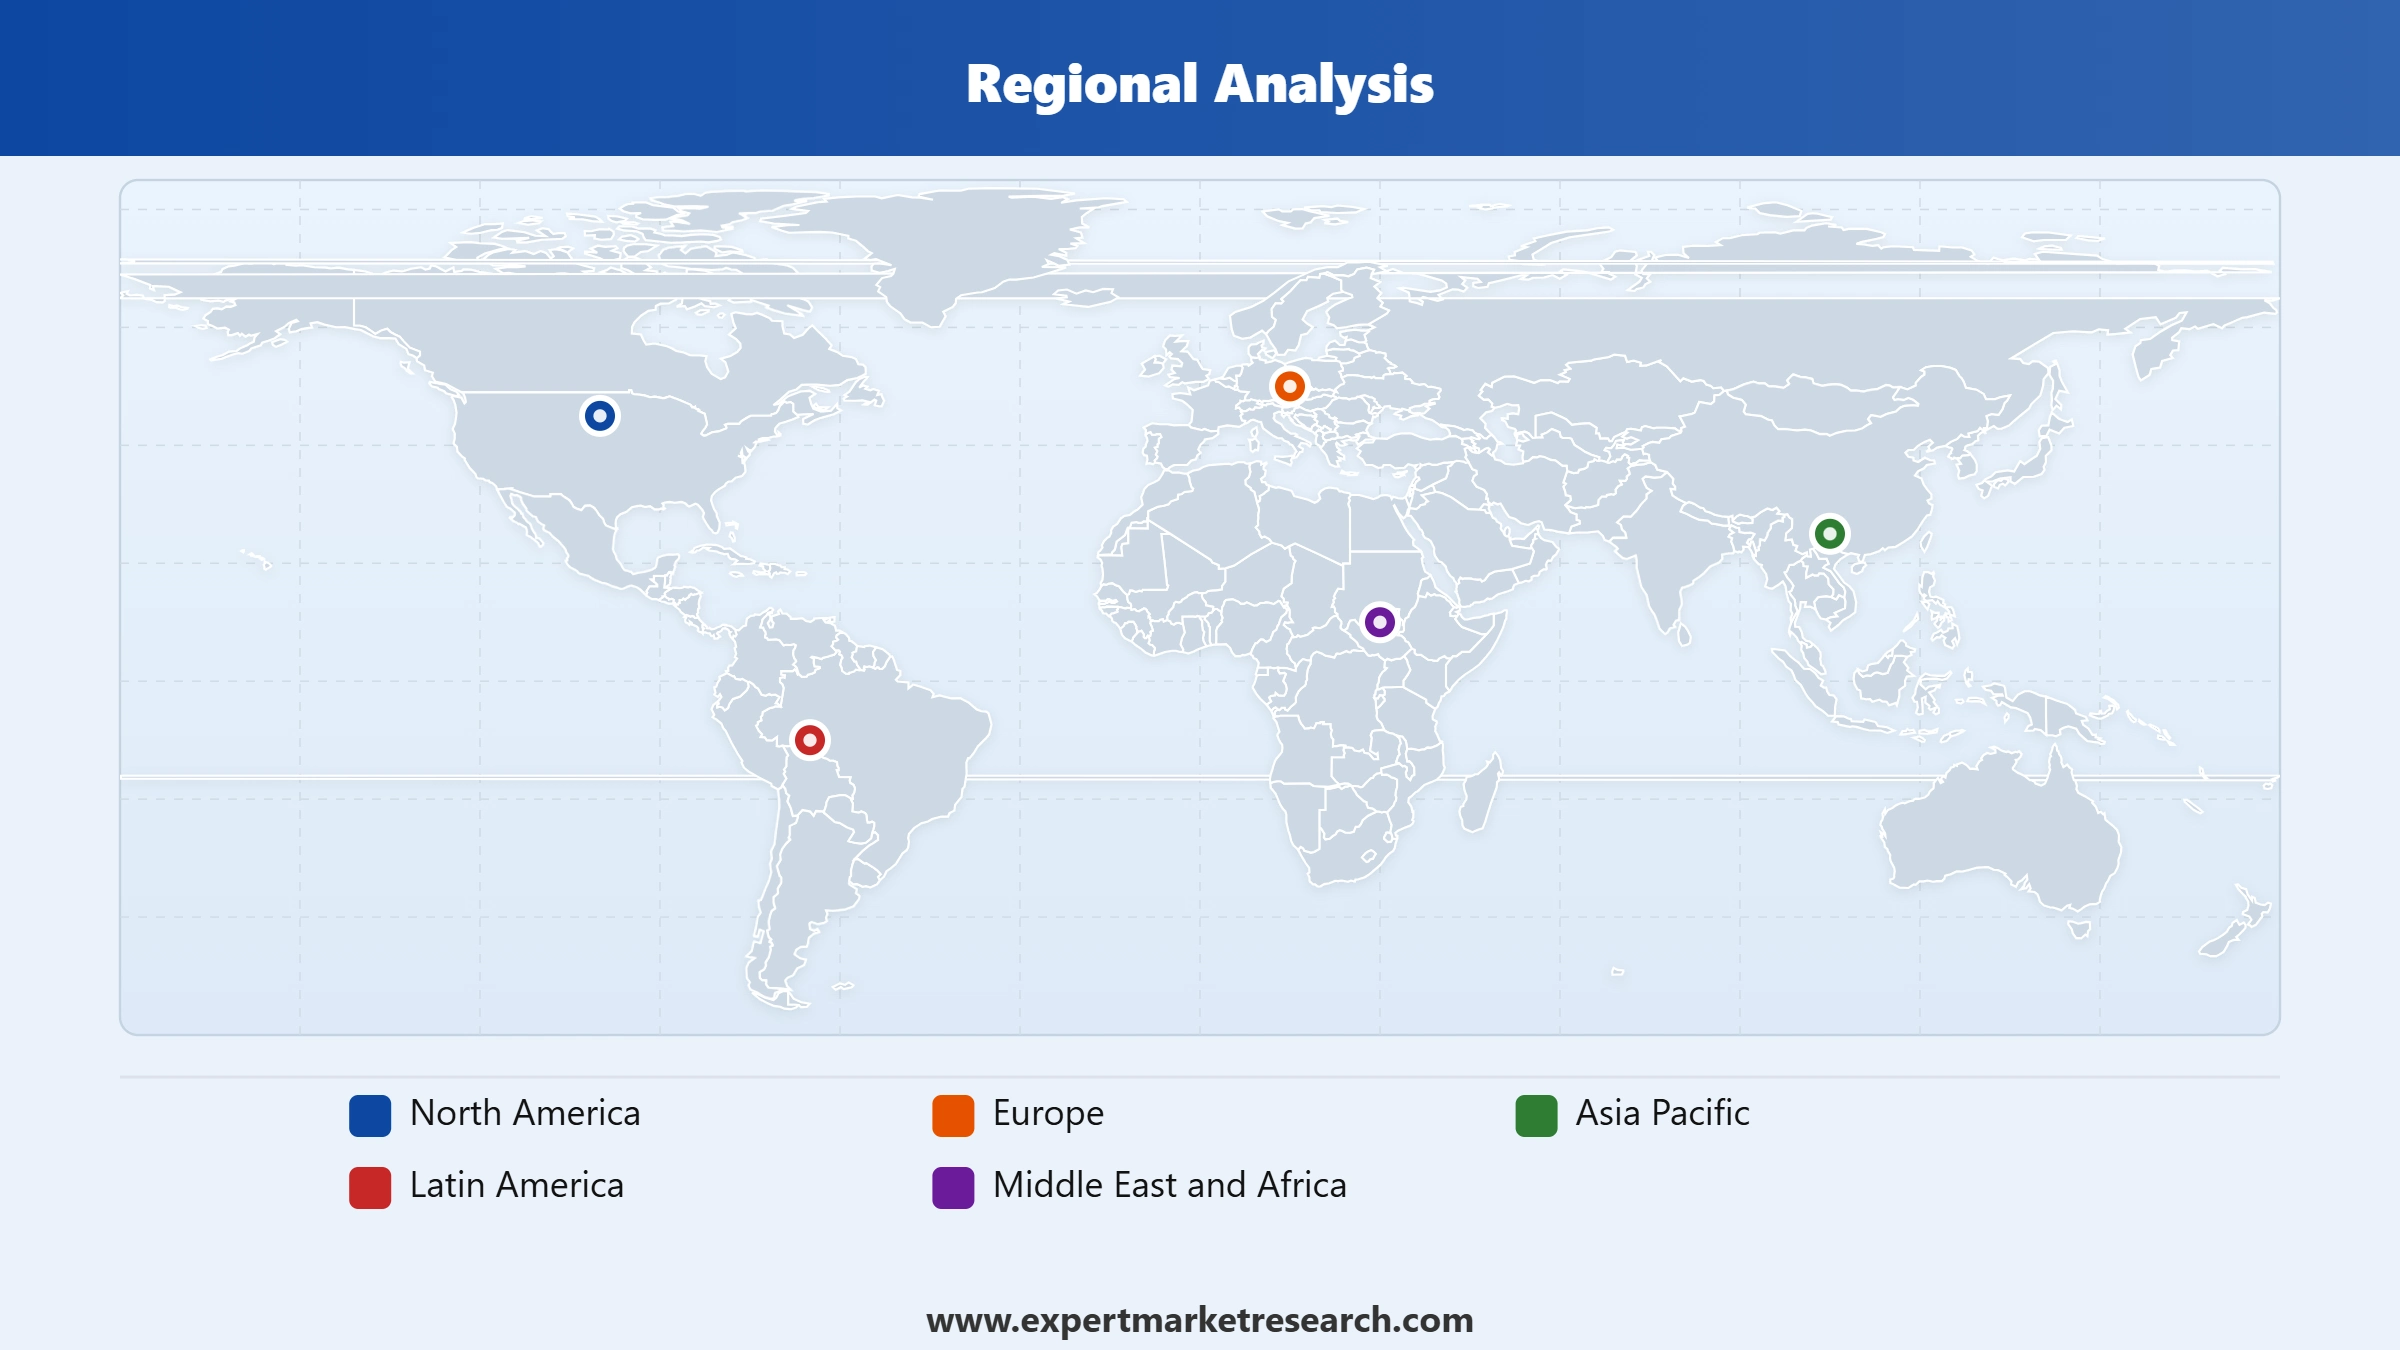
Key Insight: Demand trends in the television market vary in different regions according to the level of manufacturing, digitization technology, purchasing power, and consumer preference. The Asia Pacific leads owing to its efficient integrated production environment, technology knowledge base, and increased domestic consumption. North America witnesses the highest growth owing to the development of premium televisions and entertainment due to the streaming revolution, which changes the replacement period. Europe sustains stable demand due to high penetration of energy-efficient and premium display technology. Latin America keeps growing due to improved affordability and digitization. On the other hand, the Middle East and Africa offer promising long-term prospects due to urbanization, rising income levels, and entertainment services.
Read more about this report - REQUEST FREE SAMPLE COPY IN PDF
Smart TV dominates the market due to connected entertainment and AI-powered ecosystem adoption
Smart TVs represent the most extensive television market share as they integrate all the features mentioned above into one device. People prefer such televisions that allow them to watch content without additional devices and play games, participate in video calls, and control household appliances. Constantly updated software and the possibility to install many applications and access online services are the main advantages that provide a clear preference in both residential and commercial conditions. In August 2026, RunnTV partnered with Coolita to accelerate premium FAST TV distribution, expanding connected television reach and advertising monetization opportunities across India.
Read more about this report - REQUEST FREE SAMPLE COPY IN PDF
LCD and LED televisions experience the highest rates of growth in the television market since producers can constantly improve the quality of images while keeping relatively low prices and producing various screen sizes. The appearance of mini-LED and Quantum Dot technologies are contributing to increased light, color quality, and efficiency of energy use, becoming popular among people who want to replace their old televisions. They are available to masses, affordable to produce, and compatible with gaming and streaming applications. In August 2025, Samsung upgraded its 2026 OLED TVs with refined designs, brighter displays, AI enhancements, and expanded premium entertainment features.
Offline channels dominate the market due to product demonstrations and immediate purchasing confidence
Offline retail continues to be the dominant distribution mode as televisions are expensive products with consumers needing to evaluate their display, sound, and screen size prior to purchase. Electronic stores, specialist stores, and exclusive brand stores provide demonstration, installation, financing and after-sales support which boost consumer confidence. In addition, large sized televisions require consultation on issues like positioning and warranties among others in brick-and-mortar stores. In August 2026, Croma expanded its omnichannel retail presence with a new Borivali store, strengthening premium television accessibility and customer engagement in India.
Read more about this report - REQUEST FREE SAMPLE COPY IN PDF
The fastest growing retail mode is online retail since consumers are becoming more informed through comparison of prices, specifications, customer reviews, and special offers on the internet. E-commerce sites offer a wide variety of choices, home delivery, exchange options and different ways of payment which make it easier for consumers to make purchases. Additionally, manufacturers in the television market are building online portals for direct-to-consumer marketing of their exclusive products. Internet access, advanced payment options, and better logistics infrastructure are contributing to faster growth in online television sales.
By screen size, the 44-55 inches category accounts for the dominant share of the market due to balanced affordability and immersive viewing
The 44-55 inch segment is the dominant player in terms of television market share due to its ideal balance of viewing experience, cost-effectiveness, and compatibility with normal domestic settings. Customers feel that this segment is appropriate for watching, playing, doing sports and entertainment purposes without taking up too much room during installation. This particular segment is preferred by manufacturers for showcasing premium display technologies, ensuring their wide availability across different price segments. The segment continues to meet robust demand from first-time buyers and replacement customers.
Read more about this report - REQUEST FREE SAMPLE COPY IN PDF
The televisions with a screen size of 65 inches and above are currently experiencing the highest growth rates in the television market as consumers continue to seek cinematic experiences at their home. The drop in panel costs, development of display technologies, and high-resolution content availability are driving this segment’s popularity. Premium consumers, gamers, and luxurious housing projects prefer oversized televisions to make the best of their visual experience. In July 2026, PCMag highlighted top 55-inch TVs featuring OLED, Mini-LED, AI processing, premium gaming performance, and smart connectivity.
By resolution, 4K UHD dominates the market due to superior picture quality and content availability
4K UHD TVs command the largest share in the television market due to high-quality picture quality, compatibility with HDR standards, and wide availability on streaming services, game consoles, and broadcast channels. The falling costs of panels are enabling 4K displays to be widely available at different price ranges, driving adoption. TV manufacturers are positioning 4K resolution as the norm for mid-to-high-end TVs to offer users improved picture quality without the need to pay extra costs for newer higher-resolution standards. In August 2025, Samsung expanded its super-big TV lineup with a 115-inch Neo QLED 4K model, delivering immersive premium home entertainment.
Read more about this report - REQUEST FREE SAMPLE COPY IN PDF
The 8K UHD TVs are experiencing the fastest expansion in the television market as manufacturers demonstrate their newest display technologies for premium customers. Artificial intelligence-based upscaling algorithms address the problem of low availability of native 8K content by improving the quality of lower-resolution videos. Higher screen sizes make ultra-high resolutions more valuable, which is why 8K displays are especially attractive for luxury home entertainment systems. Further developments in processor technology and falling manufacturing costs are expected to drive adoption among early technology adopters.
By smart features, smart TV with Internet connectivity dominates due to complete digital entertainment integration
Smart TVs with internet capability dominate the television market since they enable direct access to streaming services, cloud storage services, app stores, updates, and other home-related services. The trend shows that people require televisions to be the entertainment center of their homes. Wi-Fi capability and personalized content suggestions increase user comfort and the ability to use more digital services at once. In March 2024, Epic partnered with Samsung to bundle Smart TVs with broadband plans, expanding premium connected home entertainment accessibility and customer value.
Read more about this report - REQUEST FREE SAMPLE COPY IN PDF
Gaming televisions are emerging as one of the fastest-growing smart TV segments, driven by the rising adoption of next-generation gaming consoles, cloud gaming platforms, and demand for low-latency, high-refresh-rate displays. Consumers are paying much attention to televisions capable of having higher refresh rates, variable refresh rates, lower input lag, HDMI 2.1 connections, and image processing. Many gamers prefer OLED and Mini-LED screens due to better responsiveness and picture quality, boosting the overall television market penetration. In July 2026, Xbox Cloud Gaming rolled out to millions of VIDAA OS-powered TVs, enabling console-free gaming through integrated cloud streaming experiences.
The below USD 500 television category dominates the global industry due to strong affordability and mass consumer demand
The below USD 500 segment dominates the television market because of their cost-effectiveness and wide consumer appeal in both developing and developed countries. Customers' inclination towards feature-filled smart TVs that come with 4K resolution, streaming apps, voice assistants, and internet connectivity is also increasing. Producers keep launching smart TVs with better display and artificial intelligence features, making high-quality entertainment available to customers at affordable prices. Wide availability of products, online discounts, and replacement support boost the sales of TVs in this price range. In July 2026, Nexstar launched NextGen TV in Cleveland, completing ATSC 3.0 deployment across all top 25 United States television markets.
Read more about this report - REQUEST FREE SAMPLE COPY IN PDF
Fast growth is being seen in the USD 1000 - USD 2000 segment as the demand for premium televisions with features like OLED, Mini LED, AI-powered picture enhancement and gaming is increasing among customers. This is because of increased disposable incomes and demand for bigger screens, better sound and smart connectivity features among others. Producers keep expanding this segment through advanced display features, faster refresh rates, and personalized viewing experience.
Asia Pacific accounts for a substantial share of the market due to manufacturing leadership and expanding consumer demand
The largest regional television market is that of Asia Pacific owing to its significant television manufacturing abilities and high consumer demand among both developed and emerging economies. China, South Korea, Japan, India, and other countries form the basis of television manufacturing, innovations, and use. Growth in urbanization, rise in disposable income, and internet usage contribute to the need for television replacements. Availability of the world's top manufacturing firms, supply chain operations, and large middle-class population further ensure the leadership of the region in the global industry. In April 2025, Whale TV partnered with TPV to launch AI-powered smart TVs across Asia, expanding personalized streaming and connected entertainment experiences.
Read more about this report - REQUEST FREE SAMPLE COPY IN PDF
Fastest growth is seen in the North America television market with fast replacements of the existing televisions by larger versions with Smart TVs equipped with OLED, Mini-LED, AI functions, and gaming ability. High purchasing power among households, availability of broadband connectivity, and penetration of streaming services further promote the regular upgrade of technologies. Home entertainment spending increases and high preferences for premium display devices drive the demand. The introduction of flagship models of televisions in North America continues to help in regional market expansion.
The global industry witnesses intense competition, as television companies are emphasizing AI-supported viewing, premium screen display, energy-efficient design, and ecosystem of smart televisions. The development and expansion of OLED, Mini-LED, and MicroLED along with intelligent software through content recommendations and smart home integration is being emphasized. Other areas of emphasis include gaming-oriented televisions with high refresh rates and low latencies.
Sustainability is also being enhanced by the use of more recyclable materials and higher energy efficiency. Leading television market players are finding significant opportunities in large screen televisions, AI-based personalization, cloud gaming, and premium home entertainment. There is also significant potential in emerging markets due to increased broadband availability and higher disposable income encouraging use of smart televisions.
Founded in 1969 and based in Suwon, South Korea, Samsung Electronics is a leading player in the global television market. The brand offers Neo QLED, OLED, MicroLED, and Lifestyle televisions powered by Vision AI, innovative processors, and smart home solutions. Samsung keeps on developing advanced display technologies while forging collaborations with various gaming platforms and streaming services to create better connected entertainment experiences.
Founded in 1947 and based in Seoul, South Korea, LG supports the television market through the premium OLED, QNED, and smart television ranges. The company relies on self-lit OLED technology, AI image processing, and webOS software for immersive entertainment experiences. Moreover, LG enhances its presence by developing gaming technologies, sustainability initiatives, and connected home environments in various types of televisions.
Founded in 1918 and based in Osaka, Japan, Panasonic aids the TV industry through high-end OLED and LED televisions that offer movie-like experience to viewers. Some notable features of Panasonic are professional grade color accuracy, excellent HDR experience, and high-quality sound systems.
Founded in 1946 and based in Tokyo, Japan, Sony provides high-end BRAVIA televisions that use Cognitive Processor XR, Mini-LED and OLED technologies. Sony differentiates itself through PlayStation gaming technology, cinematic picture processing, and immersive audio technology. Sony takes advantage of its entertainment platform through a combination of television technology and entertainment content.
Other key players in the market include Toshiba Corporation, Hisense International Co., Ltd., Haier Smart Home Co. Ltd., KONKA Group Co. Ltd., Sansui Electric Co., Ltd., Vizio Holding Corp., Hon Hai Precision Industry Co., Ltd. (Sharp Corp.), Changhong, Philips, Skyworth Group, Xiaomi, and TCL, among others.
*Please note that this is only a partial list; the complete list of key players is available in the full report. Additionally, the list of key players can be customized to better suit your needs.*
Unlock the latest insights with our television market trends 2026 report. Discover regional growth patterns, consumer preferences, and key industry players. Stay ahead of competition with trusted data and expert analysis. Download your free sample report today and drive informed decisions in the market.
North America Television Market


Upto 15% Off
USD
$2499 $2249
$3999 $3599
$4999 $4249
$5999 $5099


*While we strive to always give you current and accurate information, the numbers depicted on the website are indicative and may differ from the actual numbers in the main report. At Expert Market Research, we aim to bring you the latest insights and trends in the market. Using our analyses and forecasts, stakeholders can understand the market dynamics, navigate challenges, and capitalize on opportunities to make data-driven strategic decisions.*
In 2025, the market reached an approximate value of USD 97.74 Billion.
The market is projected to grow at a CAGR of 3.10% between 2026 and 2035.
The market is estimated to witness healthy growth during 2026-2035 to reach around USD 132.64 Billion by 2035.
Investing in AI-powered platforms, expanding premium display portfolios, strengthening streaming partnerships, improving sustainability initiatives, targeting emerging markets, and enhancing omnichannel customer experiences are driving long-term competitive growth.
The key trends aiding the market include growing demand for higher resolution TVs, the emergence of OLED technology, and the integration of TVs with smart home voice assistants.
The market is broken down into North America, Europe, Asia Pacific, Latin America, the Middle East, and Africa.
Based on type, market segmentations include smart TV, LCD, plasma, and LED TVs, and cathode-ray tube (CRT) and rear-projection TVs.
Different distribution channels are offline and online.
The key players in the market include Samsung Electronics Co., Ltd., LG Corp., Panasonic Holdings Corp., Sony Group Corp., Toshiba Corporation, Hisense International Co., Ltd., Haier Smart Home Co. Ltd., KONKA Group Co. Ltd., Sansui Electric Co., Ltd., Vizio Holding Corp., Hon Hai Precision Industry Co., Ltd. (Sharp Corp.), Changhong, Philips, Skyworth Group, Xiaomi, and TCL, among others.
The Asia Pacific region led the television market, driven by the growing demand for smart TVs in developing countries, along with a rising middle-class population and increasing disposable income.
COVID-19 boosted television market growth, increasing demand for home entertainment and streaming services as people stayed indoors.
AI-powered Smart TVs, OLED and Mini-LED adoption, larger screen demand, gaming-optimized televisions, and sustainable energy-efficient manufacturing are collectively reshaping consumer preferences and driving premium market expansion.
Explore our key highlights of the report and gain a concise overview of key findings, trends, and actionable insights that will empower your strategic decisions.
| REPORT FEATURES | DETAILS |
| Base Year | 2025 |
| Historical Period | 2019-2025 |
| Forecast Period | 2026-2035 |
| Scope of the Report |
Historical and Forecast Trends, Industry Drivers and Constraints, Historical and Forecast Market Analysis by Segment:
|
| Breakup by Type |
|
| Breakup by Distribution Channel |
|
| Breakup by Screen size |
|
| Breakup by Resolution |
|
| Breakup by Smart Features |
|
| Breakup by Price Range |
|
| Breakup by Region |
|
| Market Dynamics |
|
| Competitive Landscape |
|
| Companies Covered |
|
Datasheet
One User
USD 2,499
USD 2,249
tax inclusive*
Single User License
One User
USD 3,999
USD 3,599
tax inclusive*
Five User License
Five User
USD 4,999
USD 4,249
tax inclusive*
Corporate License
Unlimited Users
USD 5,999
USD 5,099
tax inclusive*
*Please note that the prices mentioned below are starting prices for each bundle type. Kindly contact our team for further details.*
Flash Bundle
Small Business Bundle
Growth Bundle
Enterprise Bundle
*Please note that the prices mentioned below are starting prices for each bundle type. Kindly contact our team for further details.*
Flash Bundle
Number of Reports: 3
20%
tax inclusive*
Small Business Bundle
Number of Reports: 5
25%
tax inclusive*
Growth Bundle
Number of Reports: 8
30%
tax inclusive*
Enterprise Bundle
Number of Reports: 10
35%
tax inclusive*
How To Order

Select License Type
Choose the right license for your needs and access rights.

Click on ‘Buy Now’
Add the report to your cart with one click and proceed to register.

Select Mode of Payment
Choose a payment option for a secure checkout. You will be redirected accordingly.
Strategic Solutions for Informed Decision-Making
Gain insights to stay ahead and seize opportunities.

Get insights & trends for a competitive edge.

Track prices with detailed trend reports.

Analyse trade data for supply chain insights.

Leverage cost reports for smart savings

Enhance supply chain with partnerships.

Connect For More Information
Our expert team of analysts will offer full support and resolve any queries regarding the report, before and after the purchase.
Our expert team of analysts will offer full support and resolve any queries regarding the report, before and after the purchase.
We employ meticulous research methods, blending advanced analytics and expert insights to deliver accurate, actionable industry intelligence, staying ahead of competitors.
Our skilled analysts offer unparalleled competitive advantage with detailed insights on current and emerging markets, ensuring your strategic edge.
We offer an in-depth yet simplified presentation of industry insights and analysis to meet your specific requirements effectively.




