

Consumer Insights
Uncover trends and behaviors shaping consumer choices today
Procurement Insights
Optimize your sourcing strategy with key market data
Industry Stats
Stay ahead with the latest trends and market analysis.
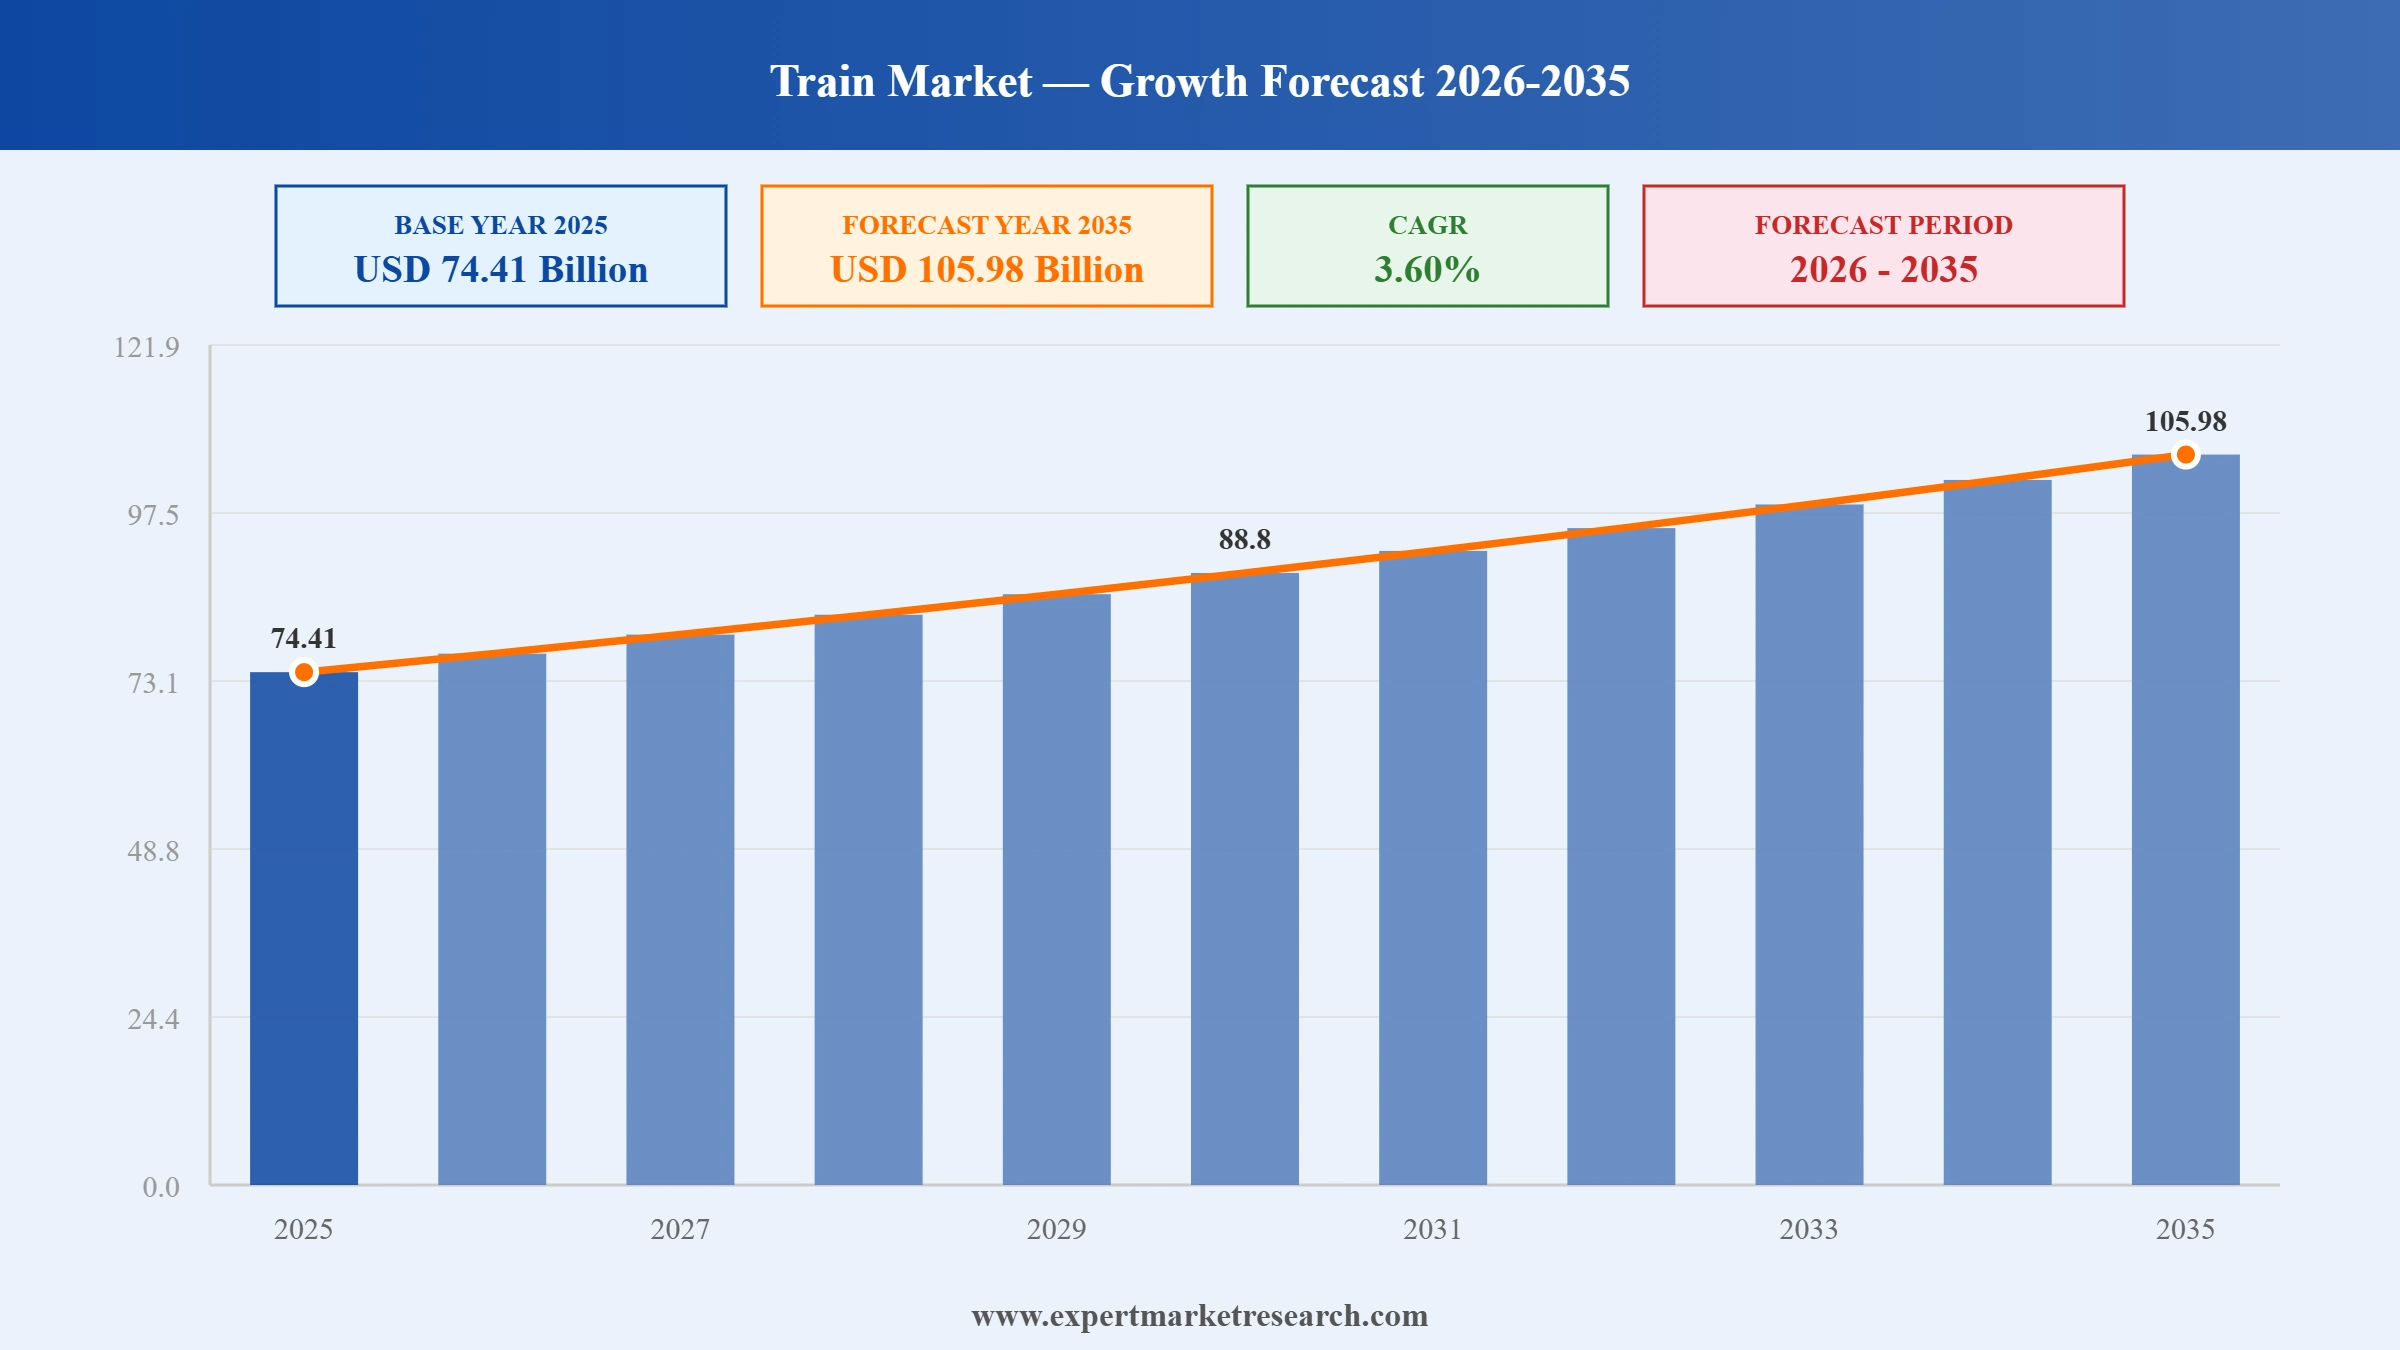
The train market reached around USD 74.41 Billion in 2025. The market is projected to grow at a CAGR of 3.60% between 2026 and 2035 to reach nearly USD 105.98 Billion by 2035. Growth is being supported by rising investments in railway infrastructure, urban transit systems, and high-speed rail networks. Increasing demand for efficient and lower-emission transportation is encouraging governments to expand and modernize rail fleets. Population growth and urbanization are also boosting passenger rail demand, while freight operators are investing in advanced locomotives and digital rail technologies to improve capacity and operational efficiency.
The train market covers passenger rail travel as a service, spanning the journeys sold by national operators, regional franchises, high-speed carriers and open access entrants, together with the channels through which those journeys reach the traveller. It takes in commuter and suburban services, intercity and long-distance routes, high-speed corridors, night trains and cross-border connections, and it extends to the onboard products and ancillary services that operators sell alongside the seat itself.
Distribution splits between online channels, where travellers book through operator websites, mobile applications and third-party retail platforms, and offline channels covering station ticket offices, machines and travel agents. Demand responds to fare levels, journey time against competing modes, service frequency and reliability, and increasingly to the emissions profile of the trip. Operators compete on punctuality, comfort and connectivity, while governments shape the market directly through infrastructure investment, franchising and ownership decisions, and safety regulation.
Read more about this report - REQUEST FREE SAMPLE COPY IN PDF
| Global Train Market Report Summary | Description | Value |
| Base Year | USD Billion | 2025 |
| Historical Period | USD Billion | 2019-2025 |
| Forecast Period | USD Billion | 2026-2035 |
| Market Size 2025 | USD Billion | 74.41 |
| Market Size 2035 | USD Billion | 105.98 |
| CAGR 2019-2025 | Percentage | XX% |
| CAGR 2026-2035 | Percentage | 3.60% |
| CAGR 2026-2035 - Market by Region | Asia Pacific | 4.3% |
| CAGR 2026-2035 - Market by Country | India | 5.0% |
| CAGR 2026-2035 - Market by Country | United Kingdom | 4.4% |
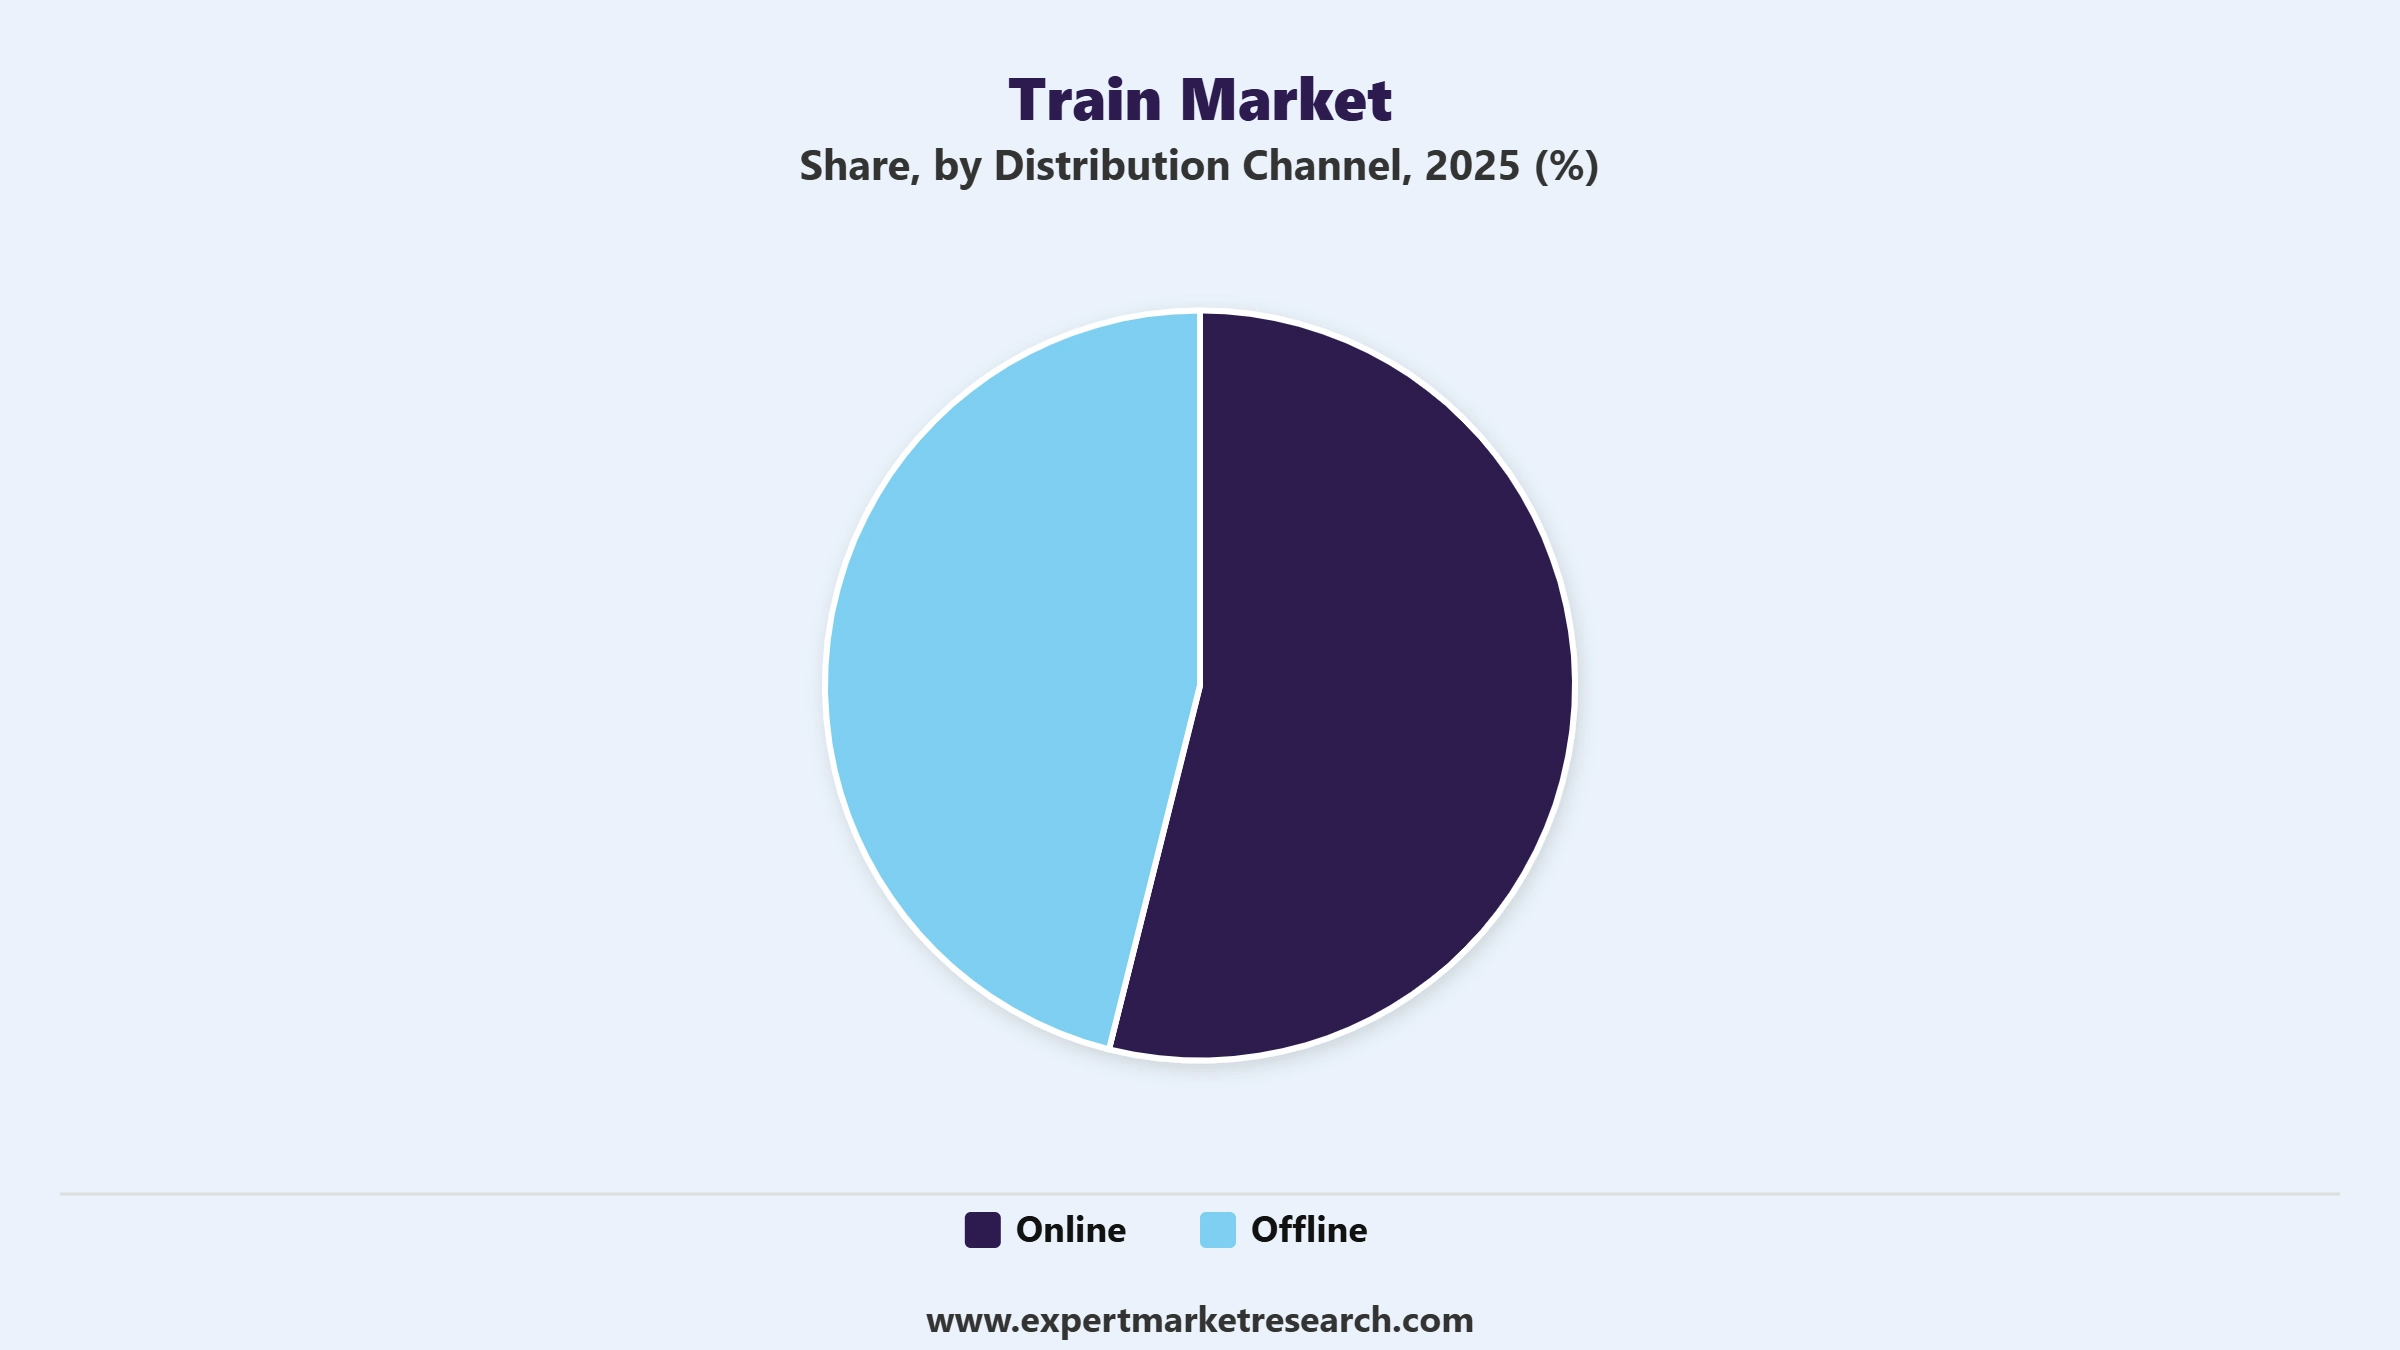
| CAGR 2026-2035 - Market by Format | Online | 4.0% |
| Market Share by Country 2025 | USA | XX% |
The global rail industry accounted for around 1.1 billion tons of carbon emissions in 2022. As concerns for environmental protection intensify, the sector is boosting its commitment to sustainable practices. In 2023, over 10,000 electric trains were globally in operation. Multiple stakeholders are enhancing their investments to produce emissions-free trains. For instance, as a part of its commitment to reduce carbon emissions by 50% by 2030, the European Investment Bank is investing EUR 39 trillion towards the development of its railways.
The United Kingdom’s watchdog for British transport users, Transport Focus, suggests that over 80% of passengers feel safe when travelling by train. However, the mounting incidences of train accidents in 2022 have necessitated investments in the development of cutting-edge safety technologies like automatic train protection systems to minimise the risk of loss of human lives and enhance the safety of travelling.
Digitalisation is reshaping the future of the railway industry by providing opportunities for various data-driven enhancements. This includes the use of AI-powered cameras for detecting anomalies in railway tracks and promptly notifying railway operators to bolster their security measures to prevent train accidents. Moreover, AI tools can be used to analyse passenger behaviour and optimise train schedules, thereby boosting the travelling experience of passengers.
Decarbonisation and modal shift from short-haul aviation
Rail carries a far lower emissions burden per passenger-kilometre than road or air, which has made it the policy instrument of choice for governments trying to cut transport emissions without suppressing mobility. Travellers are responding as well, choosing rail over short-haul flights on routes where journey times have become competitive. The effect is visible in the aggregate numbers, with European Union rail journeys reaching a record 8.7 billion and 444.5 billion passenger-kilometres, an increase of nearly nine percent against 2023. Electrification underpins the environmental case, and Indian Railways reported 99.6 percent electrification of its broad-gauge network across 69,873 route kilometres by March 2026.
Network investment and new corridor openings
Governments are committing substantial capital to new lines, rolling stock and station capacity, and each opening adds addressable journeys to the market. India's Union Budget for 2026-27 allocated Rs 2,78,000 crore, around USD 29.94 billion, including seven new high-speed corridors. New networks are appearing where none existed, with Etihad Rail Passenger Services launching the United Arab Emirates' first intercity passenger service between Abu Dhabi and Fujairah on 30 June 2026, using 13 trains from CAF and CRRC Qingdao Sifang rated for 200 km/h and desert temperatures up to 55 degrees Celsius, with Dubai, Al Dhaid, Al Dhafra and Sharjah stations following through to March 2027.
Digital retailing, safety technology and market restructuring
Online booking has become the default purchase route on most networks, giving operators dynamic pricing, richer passenger data and lower distribution cost while removing queueing friction for travellers. Safety investment is running alongside, with automatic train protection systems reducing collision risk on busy corridors and Indian Railways commissioning its Kavach system across more than 3,100 route kilometres. Ownership structures are shifting in parallel, with Britain transferring Govia Thameslink Railway, responsible for one in six national rail journeys, into public ownership on 31 May 2026 as part of a programme due to complete by the end of 2027.
Global Train Market Report and Forecast 2026-2035 offers a detailed analysis of the market based on the following segments:
Market Breakup by Distribution Channel
Key Insight: The online channel is the faster growing distribution route at a 4.0% CAGR between 2026 and 2035, driven by mobile applications, integrated journey planners and third-party rail retail platforms that let travellers compare operators and book cross-border itineraries in a single transaction. Advance online sales now shape capacity planning as well as revenue, illustrated by Etihad Rail Passenger Services selling over 10,000 tickets before its Abu Dhabi to Fujairah service carried its first passenger in June 2026. Digital channels also carry the loyalty programmes, seat selection and ancillary products that operators use to lift revenue per journey.
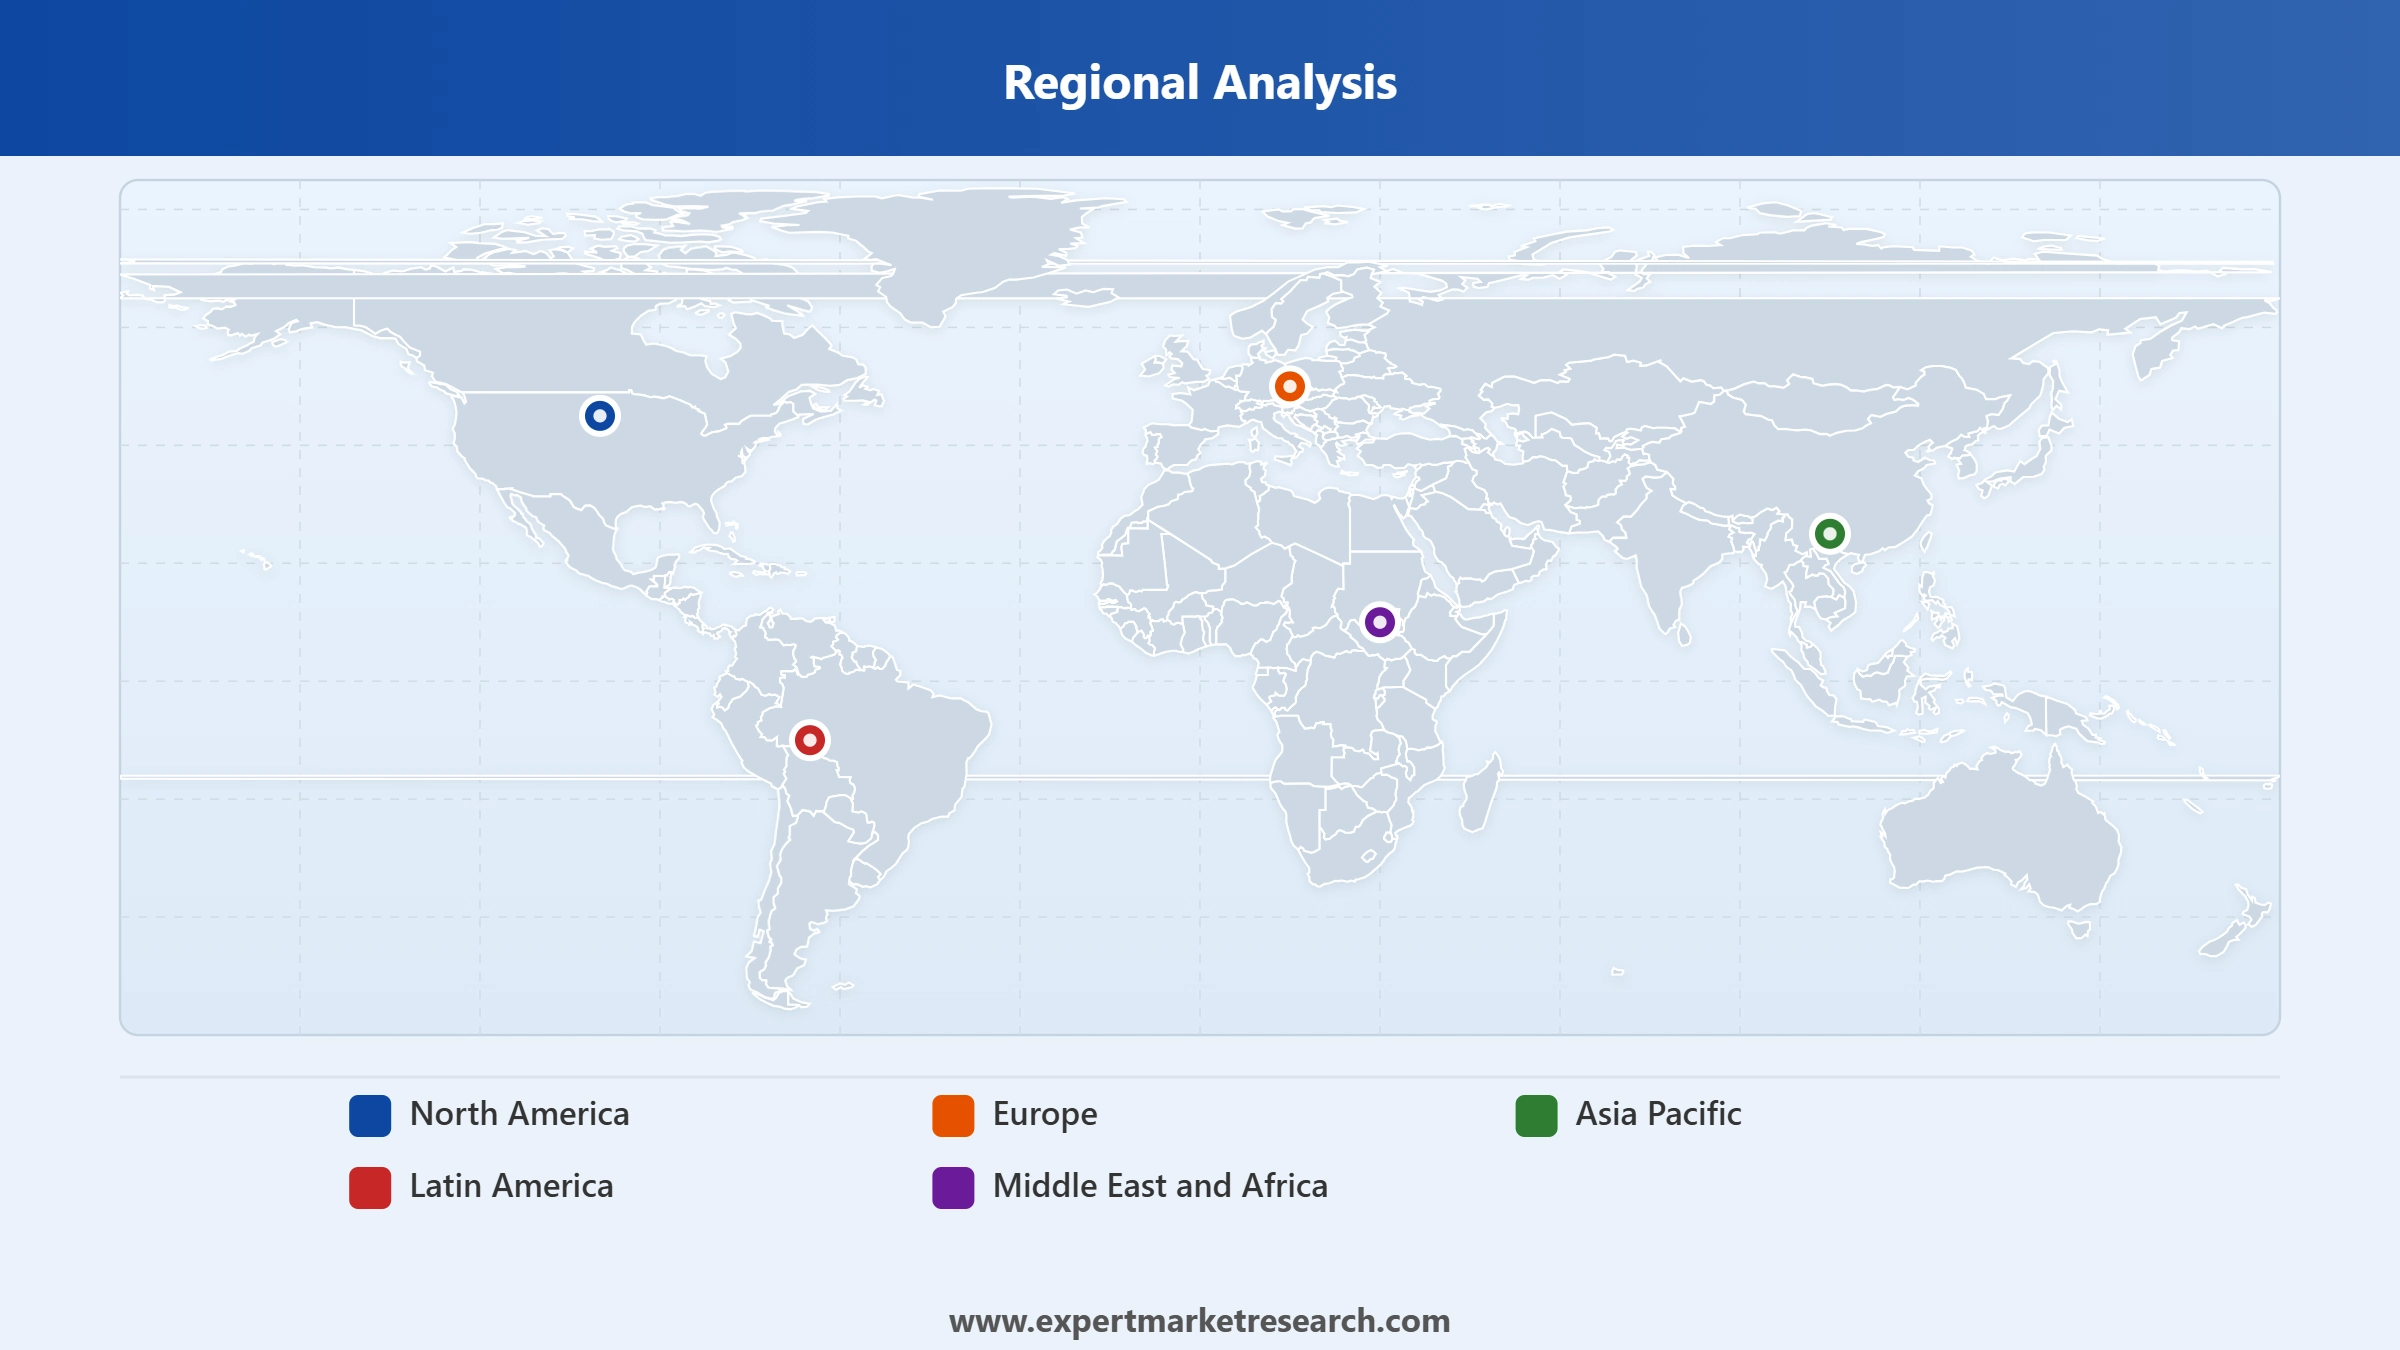
Market Breakup by Region
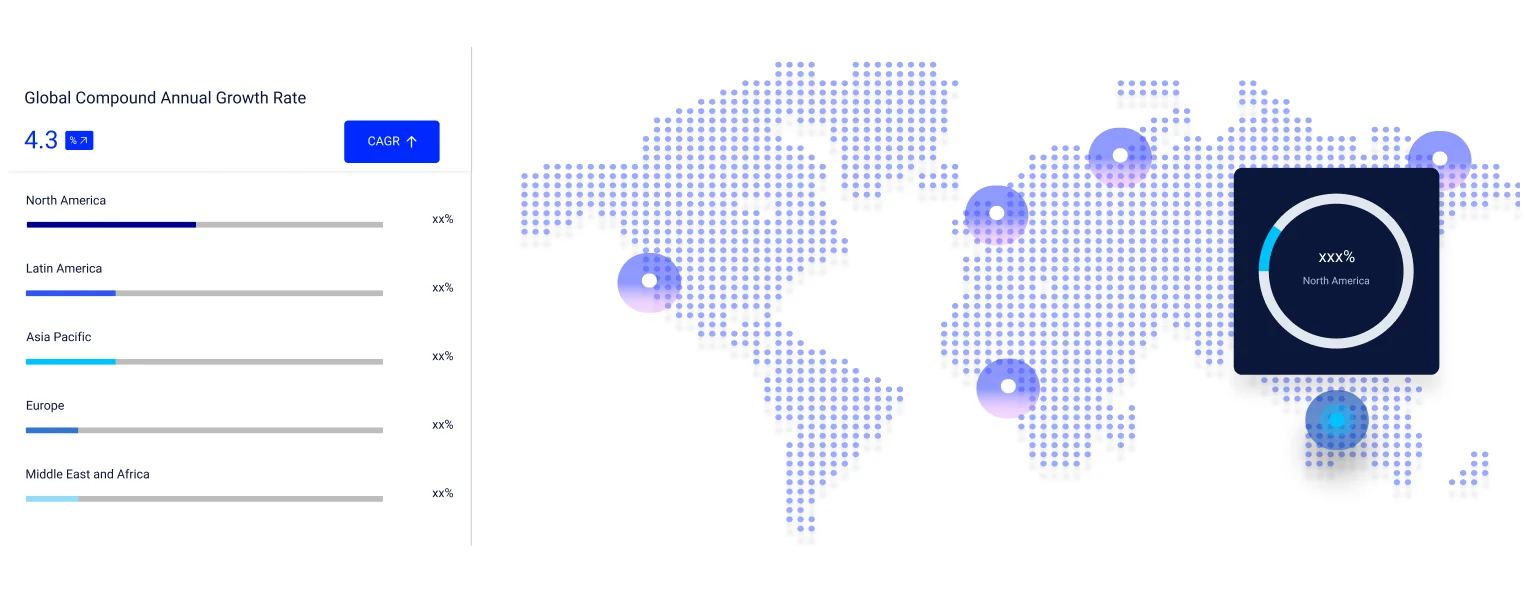
Key Insight: Asia Pacific is projected to dominate the market with 46% of overall share while registering a 4.3% CAGR over 2026-2035, driven by infrastructure development across India and China. India is assessed to grow at a 5.0% CAGR through the forecast period on rolling stock modernisation and the integration of advanced technologies, and the network carried a record 741 crore passengers in 2025-26 while reaching 99.6 percent broad-gauge electrification. Sustained state capital commitment underpins the outlook, with India allocating Rs 2,78,000 crore in its 2026-27 budget including seven new high-speed corridors.
Read more about this report - REQUEST FREE SAMPLE COPY IN PDF
Offline Channel to Retain a Substantial Base
The offline channel holds a substantial share through station ticket offices, self-service machines and travel agents, and it remains essential for walk-up travel, for passengers without smartphones or payment cards, and for complex itineraries that online systems handle poorly. Regulatory and social obligations keep staffed counters open on many networks even where digital adoption is high, since operators are frequently required to serve passengers with accessibility needs or those buying discounted regulated fares. Station machines also absorb a large volume of short-notice commuter purchases where the journey decision is made minutes before departure.
Read more about this report - REQUEST FREE SAMPLE COPY IN PDF
Europe and the Restructuring of Operator Ownership
Europe accounts for a large share of global passenger rail activity, with the European Union recording 8.7 billion journeys and 444.5 billion passenger-kilometres. Germany leads on absolute volume at 109.1 billion passenger-kilometres, followed by France at 107.3 billion and Italy at 55.9 billion, while Luxembourg records the highest per capita usage at 46.2 trips per person against 35.6 in Austria and 35.2 in Denmark. Greece, Lithuania and Bulgaria sit at the bottom of the per capita table, indicating where growth headroom is largest.
Ownership is being restructured rather than expanded in several markets. Britain nationalised Govia Thameslink Railway on 31 May 2026, transferring the operator responsible for one in six national journeys into the Department for Transport Operator Ltd holding structure, with Chiltern Railways due in September 2026 and Great Western Railway in December 2026. The United Kingdom is assessed to grow at a 4.4% CAGR through 2035.
North America and Latin America
North America's passenger rail market is concentrated in the Northeast Corridor and in commuter networks around major metropolitan areas, with Amtrak and Via Rail Canada anchoring intercity service. Growth depends heavily on federal and state capital programmes rather than on commercial expansion, since low population density across much of the continent limits the corridors where rail competes with driving and flying.
Latin America remains a smaller market where suburban and metro networks carry most passenger volume and intercity rail is limited. Urbanisation and congestion in the largest cities support commuter rail investment, though fiscal constraints slow the pace at which projects reach service.
Middle East and Africa
The Middle East and Africa is the region adding new passenger networks fastest from a low base. The United Arab Emirates launched intercity passenger service in June 2026 through Etihad Rail Passenger Services, a joint venture between Etihad Rail and Keolis, covering 200 km between Abu Dhabi and Fujairah in one hour 45 minutes with fares from 55 dirhams in comfort class and 120 dirhams in premium. Network extensions to Dubai, Al Dhaid, Al Dhafra and Sharjah are scheduled through March 2027.
Read more about this report - REQUEST FREE SAMPLE COPY IN PDF
Major rail companies are focusing on the integration of new onboard equipment into passenger trains that enable people to stay connected and enjoy a delightful travel experience with the provision of personalised information and services.
Infrastructure capacity limits how much the market can grow in the short term. Track, signalling and station throughput on busy corridors are frequently at their design limits, and adding services requires capital projects that take years to deliver. The European Union's railway network has contracted by nearly 8 percent since 1990, which means demand growth is being absorbed by a smaller physical asset base. Reliability and punctuality problems damage the modal shift argument directly, since travellers compare rail against a car journey they control.
Cost restrains both operators and passengers. Fares on many long-distance routes remain uncompetitive against low-cost aviation once advance booking is factored in, and cross-border ticketing still fragments at national boundaries, complicating exactly the journeys where rail has the strongest environmental case. Public ownership transitions and franchising changes introduce uncertainty over investment commitments during the handover period.
Opportunity sits in new networks and digital retail. The Middle East is opening intercity passenger rail where none existed, India is building seven high-speed corridors under a Rs 2,78,000 crore budget allocation, and per capita usage figures across southern and eastern Europe show substantial untapped demand. Online distribution, growing at a 4.0% CAGR, lowers the cost of reaching those travellers.


Upto 15% Off
USD
$2499 $2249
$3999 $3599
$4999 $4249
$5999 $5099


*While we strive to always give you current and accurate information, the numbers depicted on the website are indicative and may differ from the actual numbers in the main report. At Expert Market Research, we aim to bring you the latest insights and trends in the market. Using our analyses and forecasts, stakeholders can understand the market dynamics, navigate challenges, and capitalize on opportunities to make data-driven strategic decisions.*
The market reached nearly USD 74.41 Billion in 2025.
The market is projected to grow at a CAGR of 3.60% between 2026 and 2035.
The market is assessed to witness healthy growth in the forecast period to reach around USD 105.98 Billion in 2035.
The different distribution channels in the market are online and offline.
The different regions covered in the market report are North America, Europe, the Asia Pacific, Latin America, and the Middle East and Africa.
The key market players are Amtrak Corporation, Deutsche Bahn AG, SNCF Group, East Japan Railway Company, Italian State Railways, ÖBB Group, Via Rail Canada Inc., Korea Railroad Corporation, Central Japan Railway Company, and Greater Anglia, among others.
Explore our key highlights of the report and gain a concise overview of key findings, trends, and actionable insights that will empower your strategic decisions.
| REPORT FEATURES | DETAILS |
| Base Year | 2025 |
| Historical Period | 2019-2025 |
| Forecast Period | 2026-2035 |
| Scope of the Report |
Historical and Forecast Trends, Industry Drivers and Constraints, Historical and Forecast Market Analysis by Segment:
|
| Breakup by Distribution Channel |
|
| Breakup by Region |
|
| Market Dynamics |
|
| Competitive Landscape |
|
| Companies Covered |
|
Datasheet
One User
USD 2,499
USD 2,249
tax inclusive*
Single User License
One User
USD 3,999
USD 3,599
tax inclusive*
Five User License
Five User
USD 4,999
USD 4,249
tax inclusive*
Corporate License
Unlimited Users
USD 5,999
USD 5,099
tax inclusive*
*Please note that the prices mentioned below are starting prices for each bundle type. Kindly contact our team for further details.*
Flash Bundle
Small Business Bundle
Growth Bundle
Enterprise Bundle
*Please note that the prices mentioned below are starting prices for each bundle type. Kindly contact our team for further details.*
Flash Bundle
Number of Reports: 3
20%
tax inclusive*
Small Business Bundle
Number of Reports: 5
25%
tax inclusive*
Growth Bundle
Number of Reports: 8
30%
tax inclusive*
Enterprise Bundle
Number of Reports: 10
35%
tax inclusive*
How To Order

Select License Type
Choose the right license for your needs and access rights.

Click on ‘Buy Now’
Add the report to your cart with one click and proceed to register.

Select Mode of Payment
Choose a payment option for a secure checkout. You will be redirected accordingly.
Strategic Solutions for Informed Decision-Making
Gain insights to stay ahead and seize opportunities.

Get insights & trends for a competitive edge.

Track prices with detailed trend reports.

Analyse trade data for supply chain insights.

Leverage cost reports for smart savings

Enhance supply chain with partnerships.

Connect For More Information
Our expert team of analysts will offer full support and resolve any queries regarding the report, before and after the purchase.
Our expert team of analysts will offer full support and resolve any queries regarding the report, before and after the purchase.
We employ meticulous research methods, blending advanced analytics and expert insights to deliver accurate, actionable industry intelligence, staying ahead of competitors.
Our skilled analysts offer unparalleled competitive advantage with detailed insights on current and emerging markets, ensuring your strategic edge.
We offer an in-depth yet simplified presentation of industry insights and analysis to meet your specific requirements effectively.




