

Consumer Insights
Uncover trends and behaviors shaping consumer choices today
Procurement Insights
Optimize your sourcing strategy with key market data
Industry Stats
Stay ahead with the latest trends and market analysis.

The United States semiconductor market size reached USD 86.42 Billion in 2025. The market is expected to grow at a CAGR of 8.70% between 2026 and 2035, reaching almost USD 199.03 Billion by 2035.
Base Year
Historical Period
Forecast Period
In 2023, Texas ranks second in the U.S. for semiconductor manufacturing firms, according to the Office of the Texas Governor, supporting the nation's semiconductor market growth.
In 2021, California led U.S. semiconductor exports with $11.2 billion, as noted by the U.S. Semiconductor Industry Association.
According to the 2022 report from the U.S. Semiconductor Industry Association, U.S. semiconductor exports hit $62 billion in 2021, thus boosting the United States semiconductor market.
Compound Annual Growth Rate
8.7%
Value in USD Billion
2026-2035
*this image is indicative*
A semiconductor is a substance that exhibits a conductivity level between that of conductors and insulators, essential in the development of modern electronic devices. Intrinsic and extrinsic semiconductors are commonly used types with varying capacities to conduct electrical charges.
As per the United States semiconductor market report, these semiconductors are utilized in various industries such as computing, telecommunications, aerospace, medical technology, automotive, defence, and robotics, acting as vital elements in a wide array of electronic devices like microprocessors, transistors, diodes, and integrated circuits (ICs).
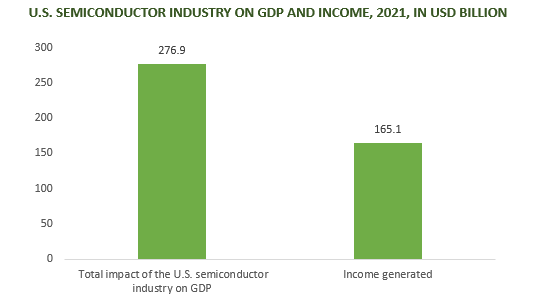
As per the 2022 State of the U.S. Semiconductor Industry Association report, semiconductor exports from the U.S. reached $62 billion in 2021, ranking as the fourth highest among U.S. exports, following aeroplanes, refined oil, and crude oil. The semiconductor industry in the U.S. also contributed to supporting 1.84 million jobs in the country in 2021, thereby contributing significantly to the United States semiconductor market growth.
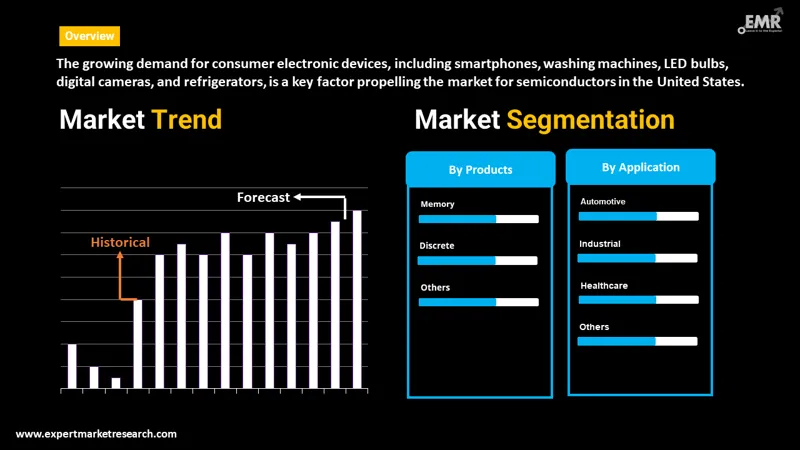
The United States semiconductor market growth is driven by factors such as environmental considerations, the needs of defence and aerospace industries, advancements in technology, and the increasing demand for consumer electronics.
The United States semiconductor market is experiencing growth due to the increasing adoption of fifth generation (5G) communication, artificial intelligence (AI), and machine learning (ML). Semiconductors are crucial for manufacturing advanced equipment in these technologies, facilitating faster data processing and low-latency communication.
Semiconductors are integral components in numerous digital consumer products like smartphones, digital cameras, televisions, washing machines, refrigerators, and LED bulbs. Additionally, they're employed in personal computers to manage overheating and vibration, enhancing the longevity and performance of these devices.
The rising preference for hybrid and electric vehicles (EVs), propelled by increasing environmental consciousness, is driving the need for semiconductor-based products. These encompass motor controls, power electronics, battery management systems (BMS), communication devices, and infotainment systems, all contributing to the market growth.
The United States semiconductor market developments are attributed to the growing emphasis on the manufacturing of semiconductors for navigation, communication, and radar systems. Additionally, the expanded application of these products in railway systems for signal processing, control systems, and communication devices is driving market expansion.


The market is witnessing enhanced growth driven by the widespread use of products in Internet of Things (IoT) technology, facilitating connectivity and rapid data processing. Moreover, the rising demand for products in the manufacturing of various medical devices such as magnetic resonance imaging (MRI), ultrasound machines, and computed tomography (CT) scanners is bolstering market expansion.
Read more about this report - REQUEST FREE SAMPLE COPY IN PDF
United States Semiconductor Market Report and Forecast 2026-2035 offers a detailed analysis of the market based on the following segments:
Market Breakup by Products
Market Breakup by Application
Market Breakup by Region
Sensors/MEMS are driving demand in the United States semiconductor market growth, as they find application in a wide range of products such as microvalves, micromirrors, pressure sensors for microphones, and labs-on-a-chip
MEMS sensors offer the benefit of compact size, allowing quick response to slight pressure changes and opening doors to new applications like implantable medical devices.
Optoelectronics primarily function as energy converters, transforming light into electricity or emitting light. As the demand for energy conversion devices increases, the quest for renewable and environmentally friendly energy sources rises as well.
In terms of applications, the United States semiconductor market share is driven by consumer electronics
Consumer electronics play a vital role in contemporary society, serving as the main channels for communication, entertainment, and a multitude of functions that enrich daily life, all reliant on semiconductors.
Semiconductors in automotive applications analyse engine temperature and pressure sensor data, regulate fuel injection for optimal combustion, optimize ignition timing, and manage emissions.
The key market players are boosting the United States semiconductor market by manufacturing semiconductor chips and microprocessors that are extensively utilised globally.
Intel Corporation, established in 1968 and headquartered in California, is an American semiconductor and technology firm renowned for producing semiconductor chips and microprocessors widely used in personal computers worldwide.
Samsung Corporation, established in 1969 and headquartered in Suwon-si, South Korea, is a prominent electronics company from South Korea, specializing in manufacturing various products such as consumer electronics, home appliances, semiconductors, and medical equipment.
NVIDIA Corporation, established in 1993 and located in California, is a leader in GPU-accelerated computing, focusing on developing products and platforms for expanding markets such as gaming, professional visualization, data centres, and automotive industries.
Texas Instruments Incorporated, founded in 1930 and based in the United States, designs, manufactures, tests, and sells analogue and embedded semiconductors crucial for electronic system development.
*Please note that this is only a partial list; the complete list of key players is available in the full report. Additionally, the list of key players can be customized to better suit your needs.*
Other key players in the United States semiconductor market include Broadcom Inc., Micron Technology, Inc., Qualcomm Technologies, Inc., NXP Semiconductors, Infineon Technologies AG, and Advanced Micro Devices, Inc. among others.
The Far West region, particularly notable for its growing semiconductor production, plays a key role in meeting the escalating demand for semiconductors in the United States.
In 2021, California, in the Far West region, was noted by the U.S. Semiconductor Industry Association as having $11.2 billion in semiconductor exports, ranking as the top export by value nationwide with 643 semiconductor establishments.
Texas, in the southwest region, holds the second position in the U.S. for semiconductor manufacturing firms, as per the Office of the Texas Governor in 2023, boasting the second-largest semiconductor workforce in the country.
United Kingdom Semiconductor Market
Australia Semiconductor Market
South Korea Semiconductor Market


Upto 15% Off
USD
$2499 $2249
$3999 $3599
$4999 $4249
$5999 $5099


*While we strive to always give you current and accurate information, the numbers depicted on the website are indicative and may differ from the actual numbers in the main report. At Expert Market Research, we aim to bring you the latest insights and trends in the market. Using our analyses and forecasts, stakeholders can understand the market dynamics, navigate challenges, and capitalize on opportunities to make data-driven strategic decisions.*
Get in touch with us for a customized solution tailored to your unique requirements and save upto 35%!
The market was valued at USD 86.42 Billion in 2025.
The market is projected to grow at a CAGR of 8.70% between 2026 and 2035.
The revenue generated from the market is expected to reach USD 199.03 Billion in 2035.
The United States semiconductor market growth is driven by factors such as environmental considerations, the needs of defence and aerospace industries, advancements in technology, and the increasing demand for consumer electronics.
The market is categorised according to its products, which include sensors/MEMS, microprocessors, optoelectronics, memory, analog/RF/mixed-signal, discrete and others.
The market key players are Intel Corporation, Samsung Corporation, NVIDIA Corporation, Texas Instruments Incorporated, Broadcom Inc., Micron Technology, Inc., Qualcomm Technologies, Inc., NXP Semiconductors, Infineon Technologies AG, and Advanced Micro Devices, Inc. among others.
Based on the application, the market is divided into automotive, telecommunication, consumer electronics, aerospace, and defence, industrial, and healthcare.
The major market areas include New England, Mideast, Great Lakes, Plains, Southeast, Southwest, Rocky Mountain, and Far West.
Explore our key highlights of the report and gain a concise overview of key findings, trends, and actionable insights that will empower your strategic decisions.
| REPORT FEATURES | DETAILS |
| Base Year | 2025 |
| Historical Period | 2019-2025 |
| Forecast Period | 2026-2035 |
| Scope of the Report |
Historical and Forecast Trends, Industry Drivers and Constraints, Historical and Forecast Market Analysis by Segment:
|
| Breakup by Products |
|
| Breakup by Application |
|
| Breakup by Region |
|
| Market Dynamics |
|
| Competitive Landscape |
|
| Companies Covered |
|
Datasheet
One User
USD 2,499
USD 2,249
tax inclusive*
Single User License
One User
USD 3,999
USD 3,599
tax inclusive*
Five User License
Five User
USD 4,999
USD 4,249
tax inclusive*
Corporate License
Unlimited Users
USD 5,999
USD 5,099
tax inclusive*
*Please note that the prices mentioned below are starting prices for each bundle type. Kindly contact our team for further details.*
Flash Bundle
Small Business Bundle
Growth Bundle
Enterprise Bundle
*Please note that the prices mentioned below are starting prices for each bundle type. Kindly contact our team for further details.*
Flash Bundle
Number of Reports: 3
20%
tax inclusive*
Small Business Bundle
Number of Reports: 5
25%
tax inclusive*
Growth Bundle
Number of Reports: 8
30%
tax inclusive*
Enterprise Bundle
Number of Reports: 10
35%
tax inclusive*
How To Order

Select License Type
Choose the right license for your needs and access rights.

Click on ‘Buy Now’
Add the report to your cart with one click and proceed to register.

Select Mode of Payment
Choose a payment option for a secure checkout. You will be redirected accordingly.
Gain insights to stay ahead and seize opportunities.

Get insights & trends for a competitive edge.

Track prices with detailed trend reports.

Analyse trade data for supply chain insights.

Leverage cost reports for smart savings

Enhance supply chain with partnerships.

Connect For More Information
Our expert team of analysts will offer full support and resolve any queries regarding the report, before and after the purchase.
Our expert team of analysts will offer full support and resolve any queries regarding the report, before and after the purchase.
We employ meticulous research methods, blending advanced analytics and expert insights to deliver accurate, actionable industry intelligence, staying ahead of competitors.
Our skilled analysts offer unparalleled competitive advantage with detailed insights on current and emerging markets, ensuring your strategic edge.
We offer an in-depth yet simplified presentation of industry insights and analysis to meet your specific requirements effectively.


Share