

Consumer Insights
Uncover trends and behaviors shaping consumer choices today
Procurement Insights
Optimize your sourcing strategy with key market data
Industry Stats
Stay ahead with the latest trends and market analysis.
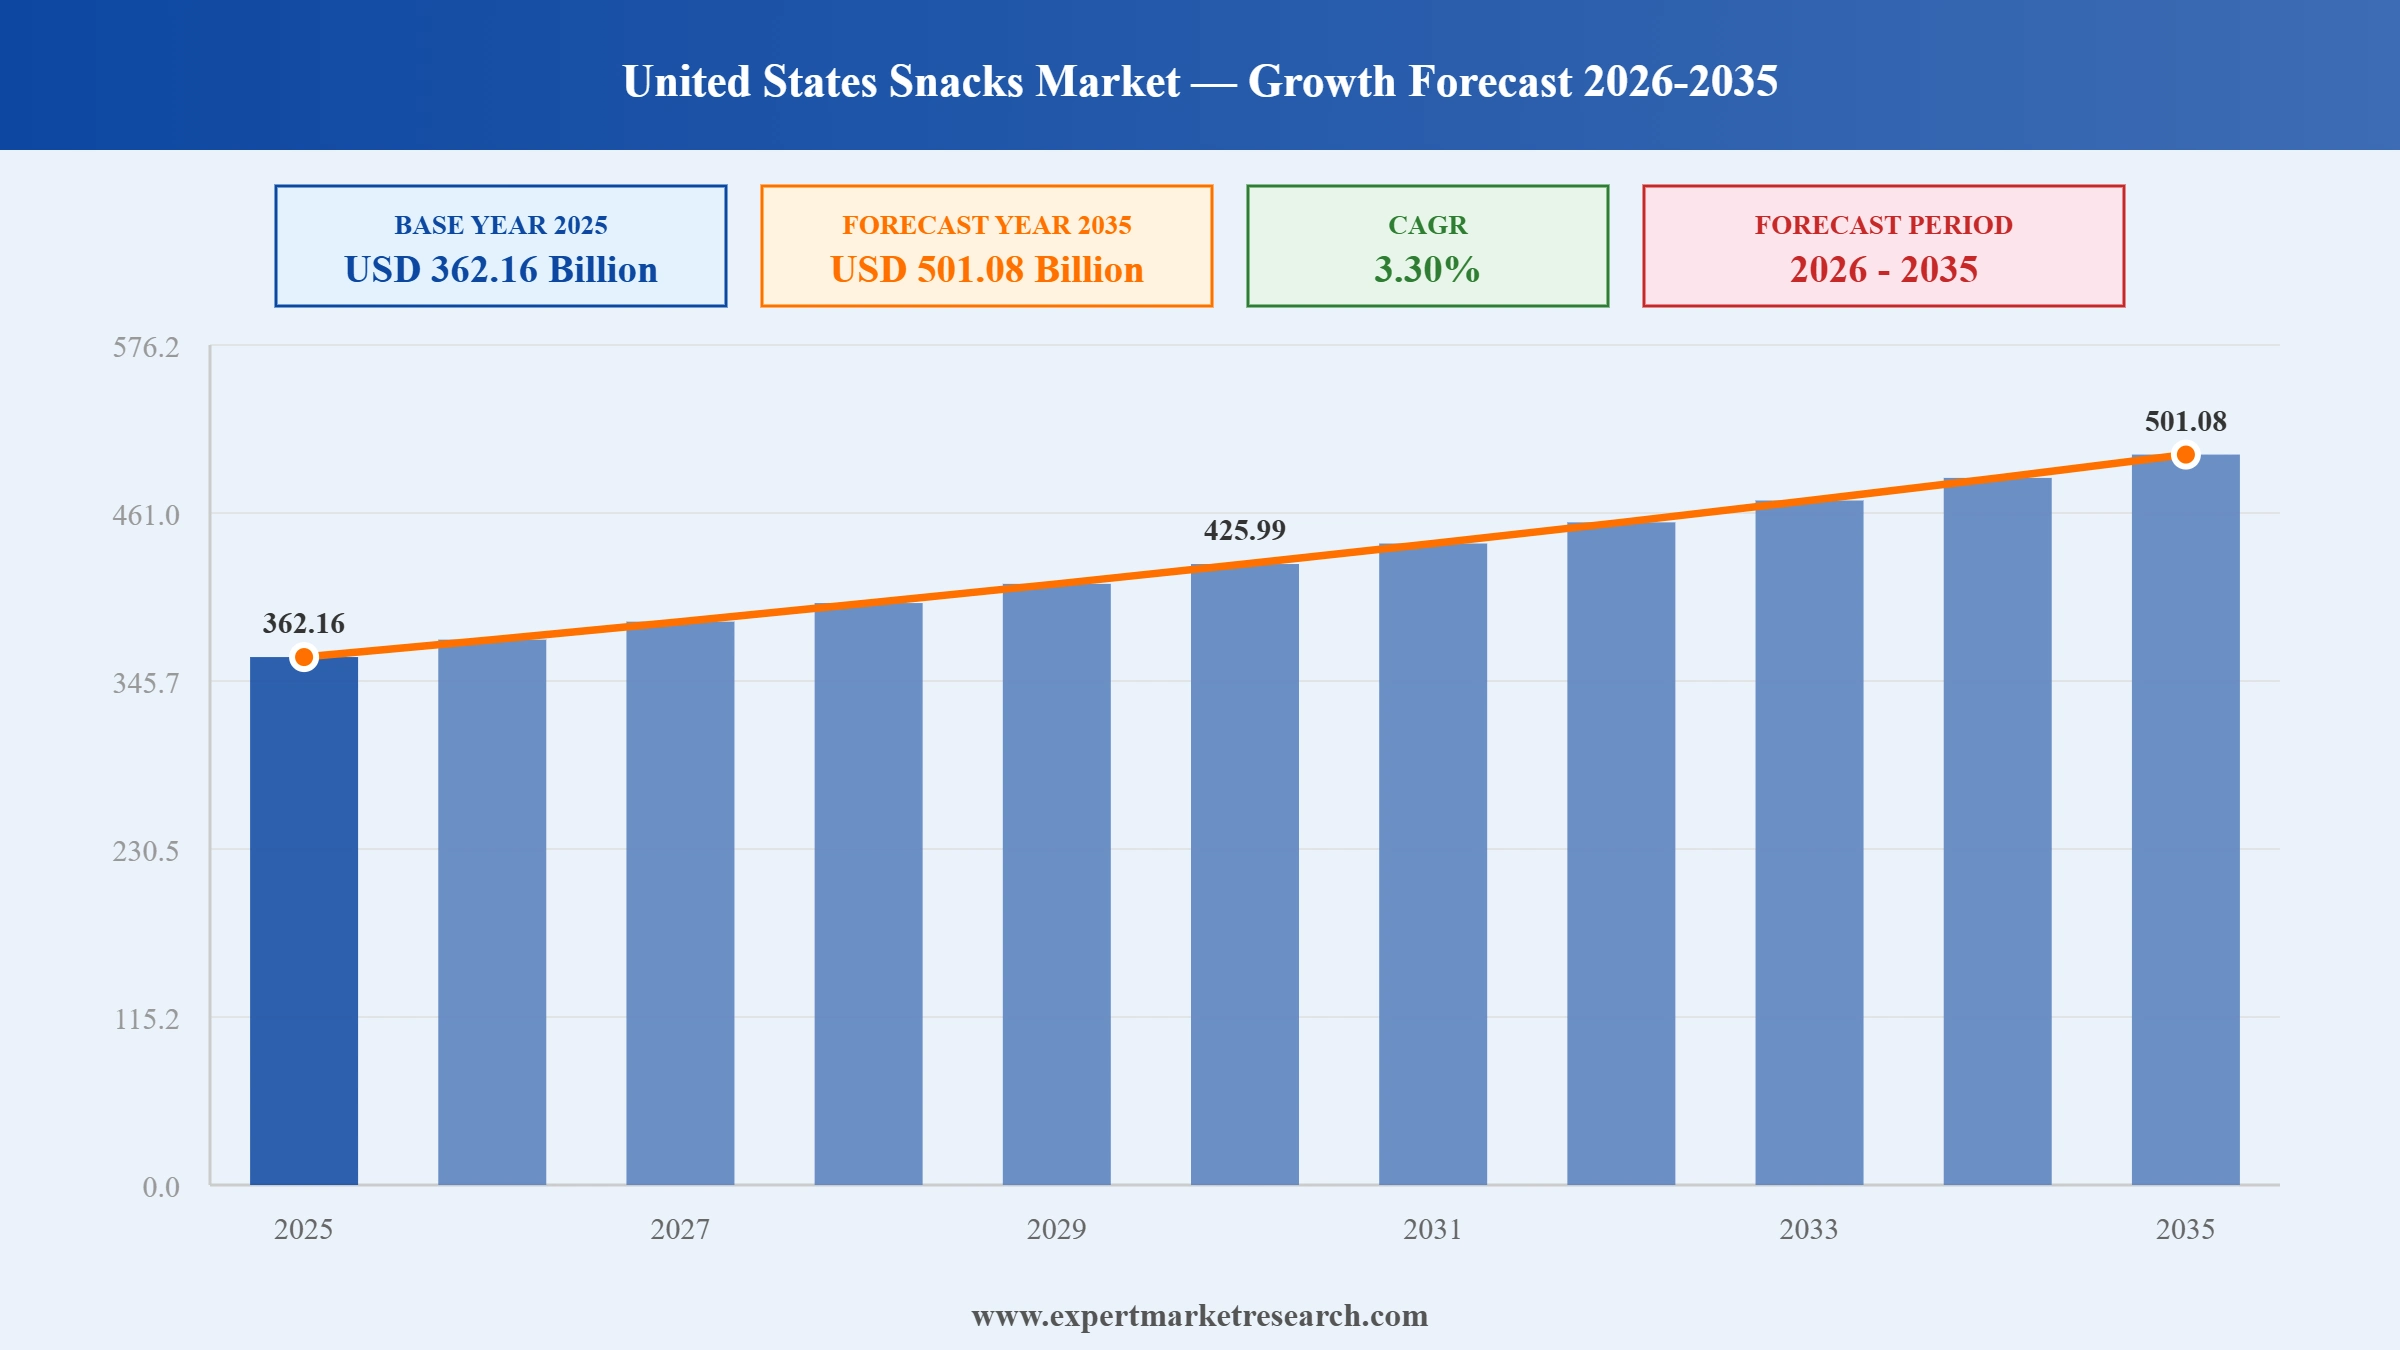
The United States Snacks Market reached a value of USD 362.16 Billion at 2025 and is projected to expand at a CAGR of around 3.30% during the forecast period of 2026-2035. With approximately 90% of the US population snacking multiple times per day, rising consumer preference for better-for-you and functional snack formats, accelerating growth of online and convenience retail distribution channels, and ongoing strategic consolidation among leading snacks manufacturers creating broader category portfolios, the market is expected to reach USD 501.08 Billion by 2035.
Read more about this report - REQUEST FREE SAMPLE COPY IN PDF
| United States Snacks Market Report Summary | Description | Value |
| Base Year | USD Billion | 2025 |
| Historical Period | USD Billion | 2019-2025 |
| Forecast Period | USD Billion | 2026-2035 |
| Market Size 2025 | USD Billion | 362.16 |
| Market Size 2035 | USD Billion | 501.08 |
| CAGR 2019-2025 | Percentage | XX% |
| CAGR 2026-2035 | Percentage | 3.30% |
| CAGR 2026-2035 - Market by Region | Southeast | 3.8% |
| CAGR 2026-2035 - Market by Region | Mideast | 3.5% |
| CAGR 2026-2035 - Market by Type | Fruit Snacks | 4.1% |
| CAGR 2026-2035 - Market by Distribution Channel | Online Channels | 5.9% |
| 2025 Market Share by Region | Great Lakes | 13.8% |
The United States Snacks Market is being driven by a powerful combination of structural forces: an entrenched snacking culture replacing traditional mealtimes, major M&A consolidation creating multi-category snacking giants, accelerating health and wellness innovation across product categories, and geographic expansion of premium and functional snacking into high-growth regional markets. These dynamics are expected to sustain consistent revenue growth through the 2035 forecast horizon.
In December 2025, Mars Incorporated completed its landmark USD 35.9 billion acquisition of Kellanova, gaining ownership of billion-dollar US snack brands including Pringles, Cheez-It, Pop-Tarts, Rice Krispies Treats, and RXBAR. The acquisition received all 28 required regulatory approvals including European Commission clearance on December 8, 2025, with the transaction closing on December 11, 2025. The combined Mars Snacking entity now operates in more than 145 markets, commands a portfolio of 9 billion-dollar brands, and is expected to generate around USD 36 billion in annual snacking revenues, fundamentally reshaping the US snacks competitive landscape.
In March 2025, The Hershey Company unveiled a new line of KISSES Cinnamon Toast Crunch flavored candies, expanding its confectionery snacking portfolio with an innovative licensed flavor collaboration targeting the growing US consumer appetite for novel and indulgent snack experiences. The product launch is part of Hershey's broader strategy to attract younger consumer demographics through cross-category flavor partnerships that blend familiar confectionery formats with culturally resonant food culture touchpoints. The new line is distributed across major US retail channels including hypermarkets, convenience stores, and online platforms.
In August 2024, Mars Incorporated and Kellanova announced a definitive agreement under which Mars agreed to acquire Kellanova for USD 83.50 per share in cash, representing a total consideration of USD 35.9 billion including assumed net leverage. The deal, the largest in the food and beverage sector since the Kraft Heinz combination in 2015, positions Mars to compete more directly with Frito-Lay parent PepsiCo and Mondelez International across the US salty, savory, and sweet snacking segments. Kellanova's brands including Pringles and Cheez-It add significant revenue diversity to Mars's historically confectionery-focused US portfolio.
In 2024, The Hershey Company and Mondelez International collaborated on a cross-brand innovation initiative resulting in the launch of Oreo Reese's cookies and Reese's Oreo cups in the United States, blending two of the country's most iconic confectionery snack brands into co-branded product formats. The collaboration demonstrated the growing industry trend toward licensed brand partnerships as a route to rapid new product development and incremental shelf space acquisition across key US snacks retail channels, including hypermarkets, convenience stores, and digital grocery platforms where innovation products command premium placement.
In November 2023, The J.M. Smucker Company completed its acquisition of Hostess Brands, the maker of iconic US snack cakes including Twinkies, Ding Dongs, HoHos, and Donettes, for approximately USD 5.6 billion. The acquisition significantly expanded Smucker's presence in the US sweet snacking segment, complementing its existing Jif, Folgers, and Uncrustables portfolios. Hostess had reported consistent volume growth and strong brand recognition ahead of the deal, and the acquisition gave Smucker direct access to the high-velocity impulse snacking channel, including convenience store networks that are central to Hostess brand sales across the United States.
The US snacks market is undergoing structural consolidation as major food conglomerates pursue large-scale acquisitions to build multi-category snacking portfolios capable of competing across sweet, salty, savory, and better-for-you segments simultaneously. This M&A wave is creating entities with significant scale advantages in retail shelf allocation, trade spend, and supply chain efficiency. In December 2025, Mars Incorporated completed its USD 35.9 billion acquisition of Kellanova, creating a US snacking powerhouse with 9 billion-dollar brands spanning confectionery, crisps, cereal bars, and on-the-go nutrition, directly intensifying competition with PepsiCo's Frito-Lay and Mondelez International across the United States Snacks Market.
US consumers are increasingly making health-informed snacking choices, creating strong demand for better-for-you formats including reduced-sugar, high-protein, whole-grain, and plant-based snack products. Manufacturers are responding by diversifying their portfolios to balance indulgent core brands with functional and clean-label innovation, addressing the dual consumer demand for taste and nutritional benefit. The United States Snacks Market growth trajectory is being supported by this shift, as consumers demonstrate willingness to pay premium prices for snacks that align with their wellness values. In August 2024, Mars announced the acquisition of Kellanova, specifically citing the opportunity to combine its confectionery expertise with Kellanova's portfolio of nutrition bars and wellness brands including RXBAR and Nutri-Grain.
Brand collaboration and licensed flavor partnerships have emerged as a primary innovation strategy for US snack manufacturers seeking to capture consumer attention in a crowded category. By combining the equity of two beloved brands into a co-branded product, manufacturers can generate incremental purchase occasions, attract media coverage, and test new flavor territories without the full investment required to launch an entirely new brand. In 2024, The Hershey Company and Mondelez International launched Oreo Reese's cookies and Reese's Oreo cups, a cross-brand collaboration that blended two of the most recognized snack brands in the US into novel confectionery formats, generating strong consumer interest and reinforcing both brands' appeal across impulse and planned purchase channels.
The US convenience store channel remains a critical battleground for snack manufacturers, with impulse purchase formats including single-serve and travel-pack snacks generating disproportionately high margins. Strategic acquisitions of impulse-oriented snack brands are enabling major manufacturers to secure competitive positioning in this channel. In November 2023, J.M. Smucker completed its USD 5.6 billion acquisition of Hostess Brands, gaining direct access to a portfolio of convenience store staples including Twinkies, Ding Dongs, and Donettes that are deeply embedded in the impulse purchase behavior of American consumers, reinforcing the strategic importance of the convenience channel as a revenue driver in the broader US snacks ecosystem.
The Expert Market Research's report titled “United States Snacks Market Report and Forecast 2026-2035” offers a detailed analysis of the market based on the following segments:
Market Breakup by Type
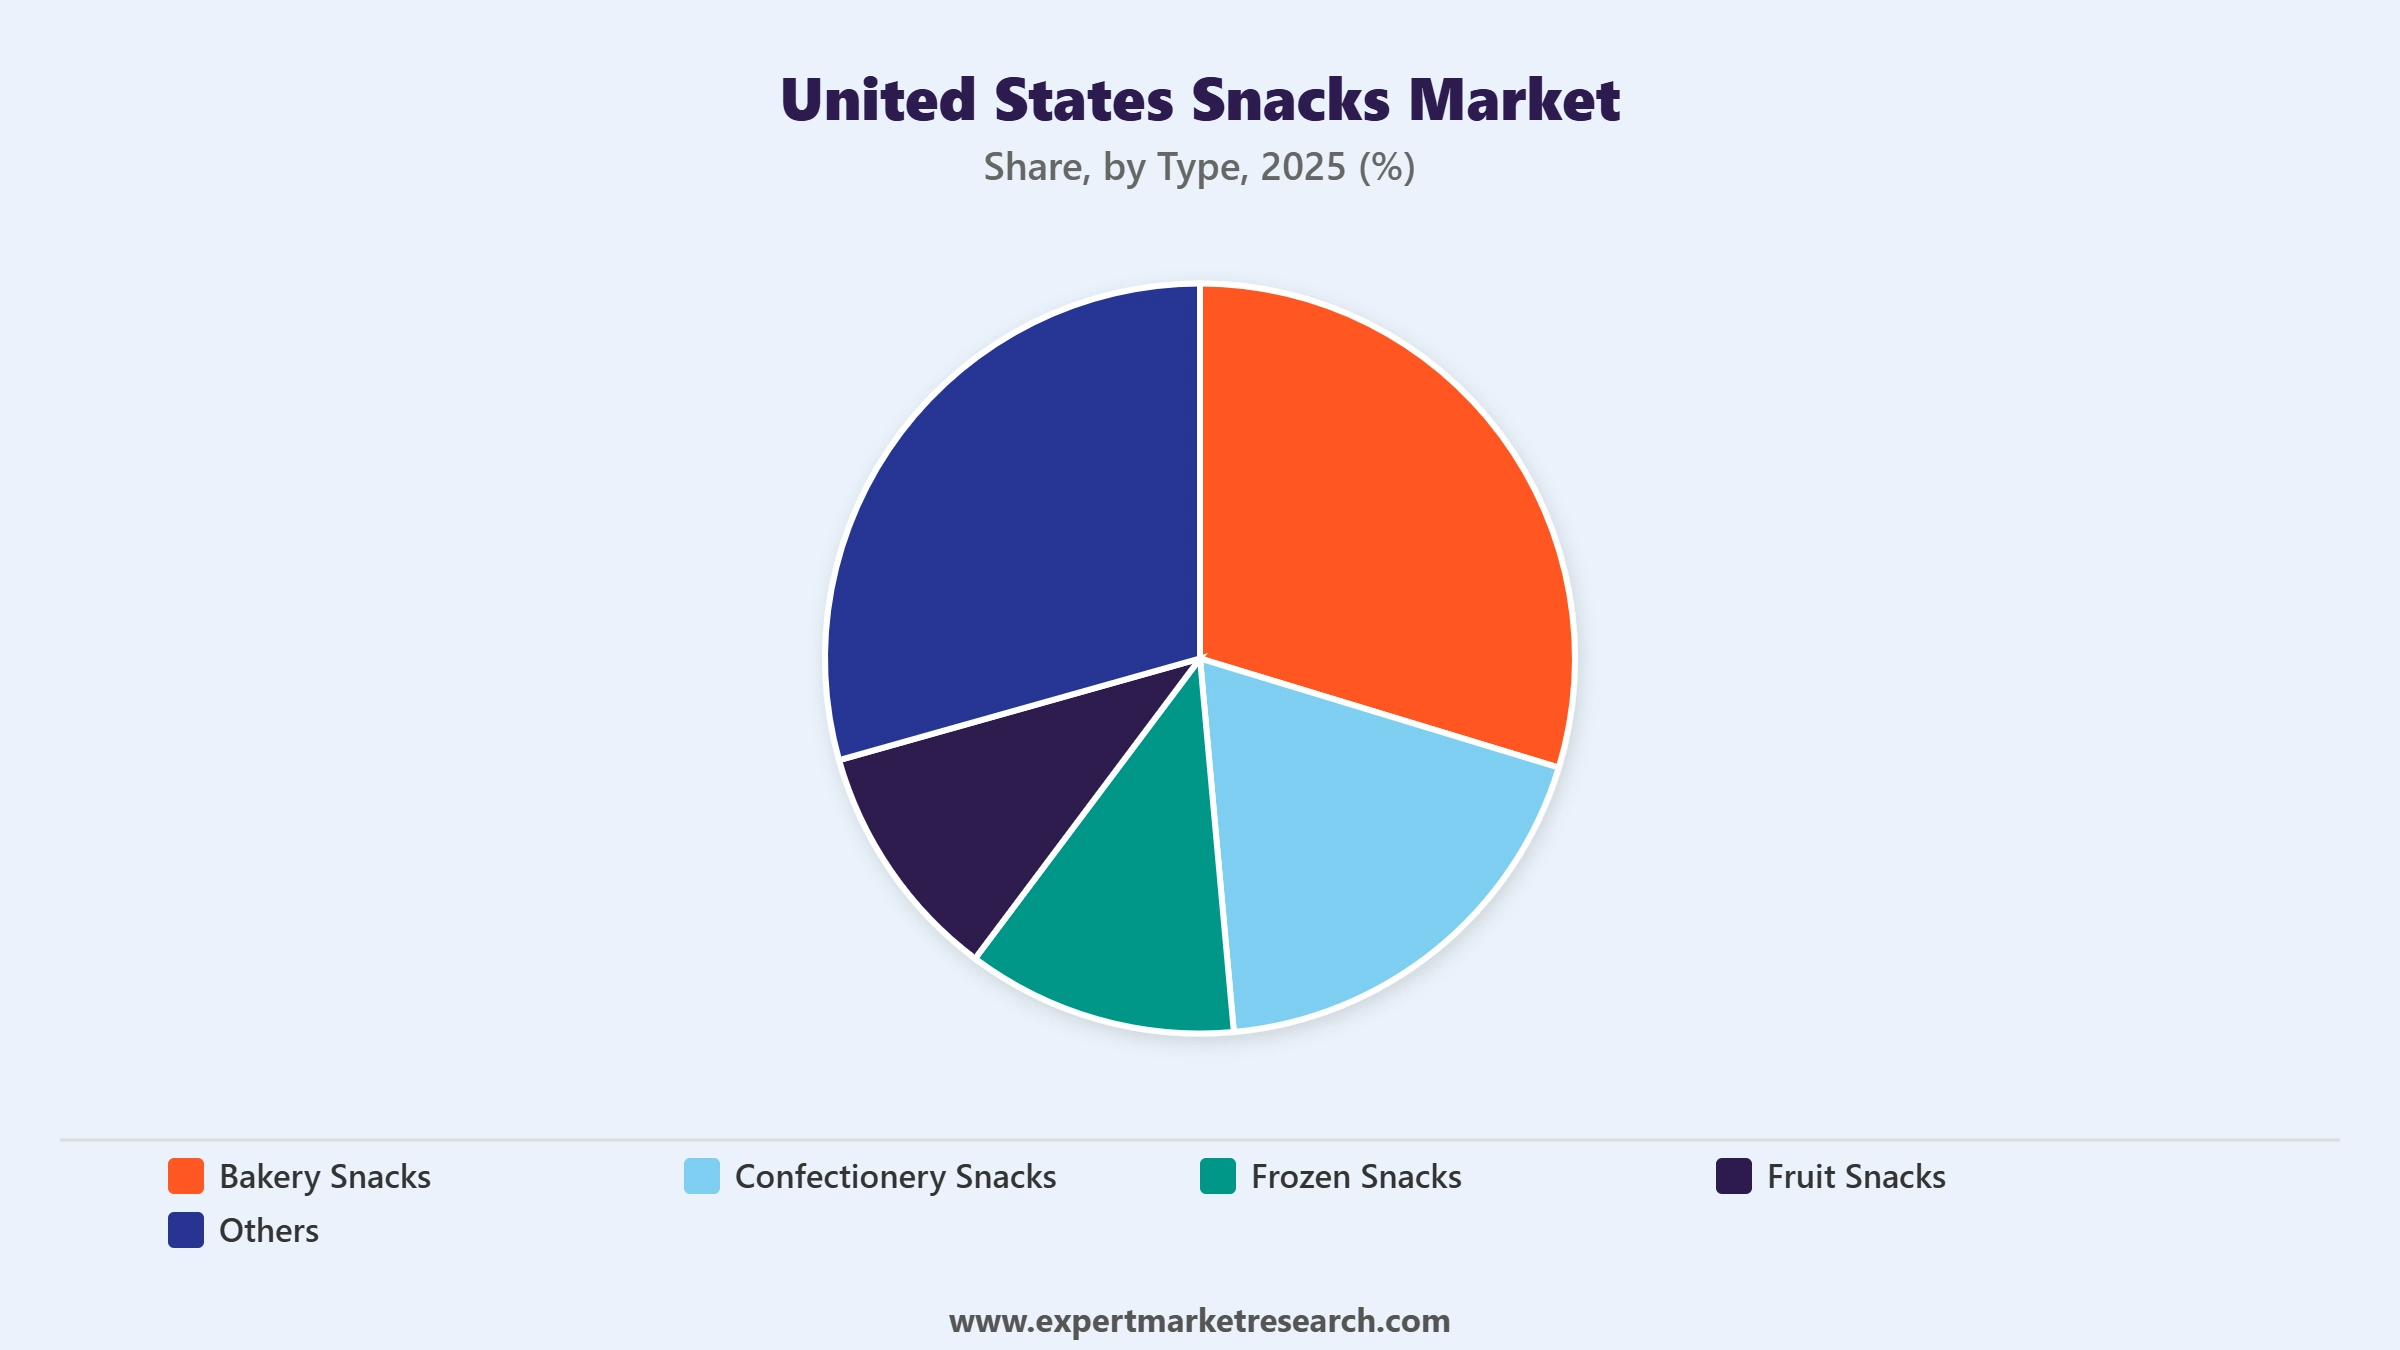
Key Insight: Bakery Snacks represent one of the largest and most innovation-active segments in the US snacks market, encompassing cookies, crackers, granola bars, pretzels, and baked chips. The segment benefits from strong demand across both indulgent and better-for-you sub-categories, with brands including Nabisco, Pepperidge Farm, and Nature Valley holding leading positions. Confectionery Snacks, which include chocolate, candy, and gum products, are among the highest-revenue contributors, with Hershey, Mars, and Mondelez commanding substantial market share. Frozen Snacks are experiencing the fastest growth within the type segmentation, driven by demand for convenient meal-adjacent options and innovation in hand-held breakfast snacks such as burritos, pockets, and French toast sticks. Fruit Snacks serve a growing consumer base seeking portable, naturally derived sweet snacks, with both traditional gummy formats and newer dried and dehydrated variants gaining traction. The Others category captures specialty and emerging snack formats including jerky, nutrition bars, and popcorn.
Market Breakup by Distribution Channel
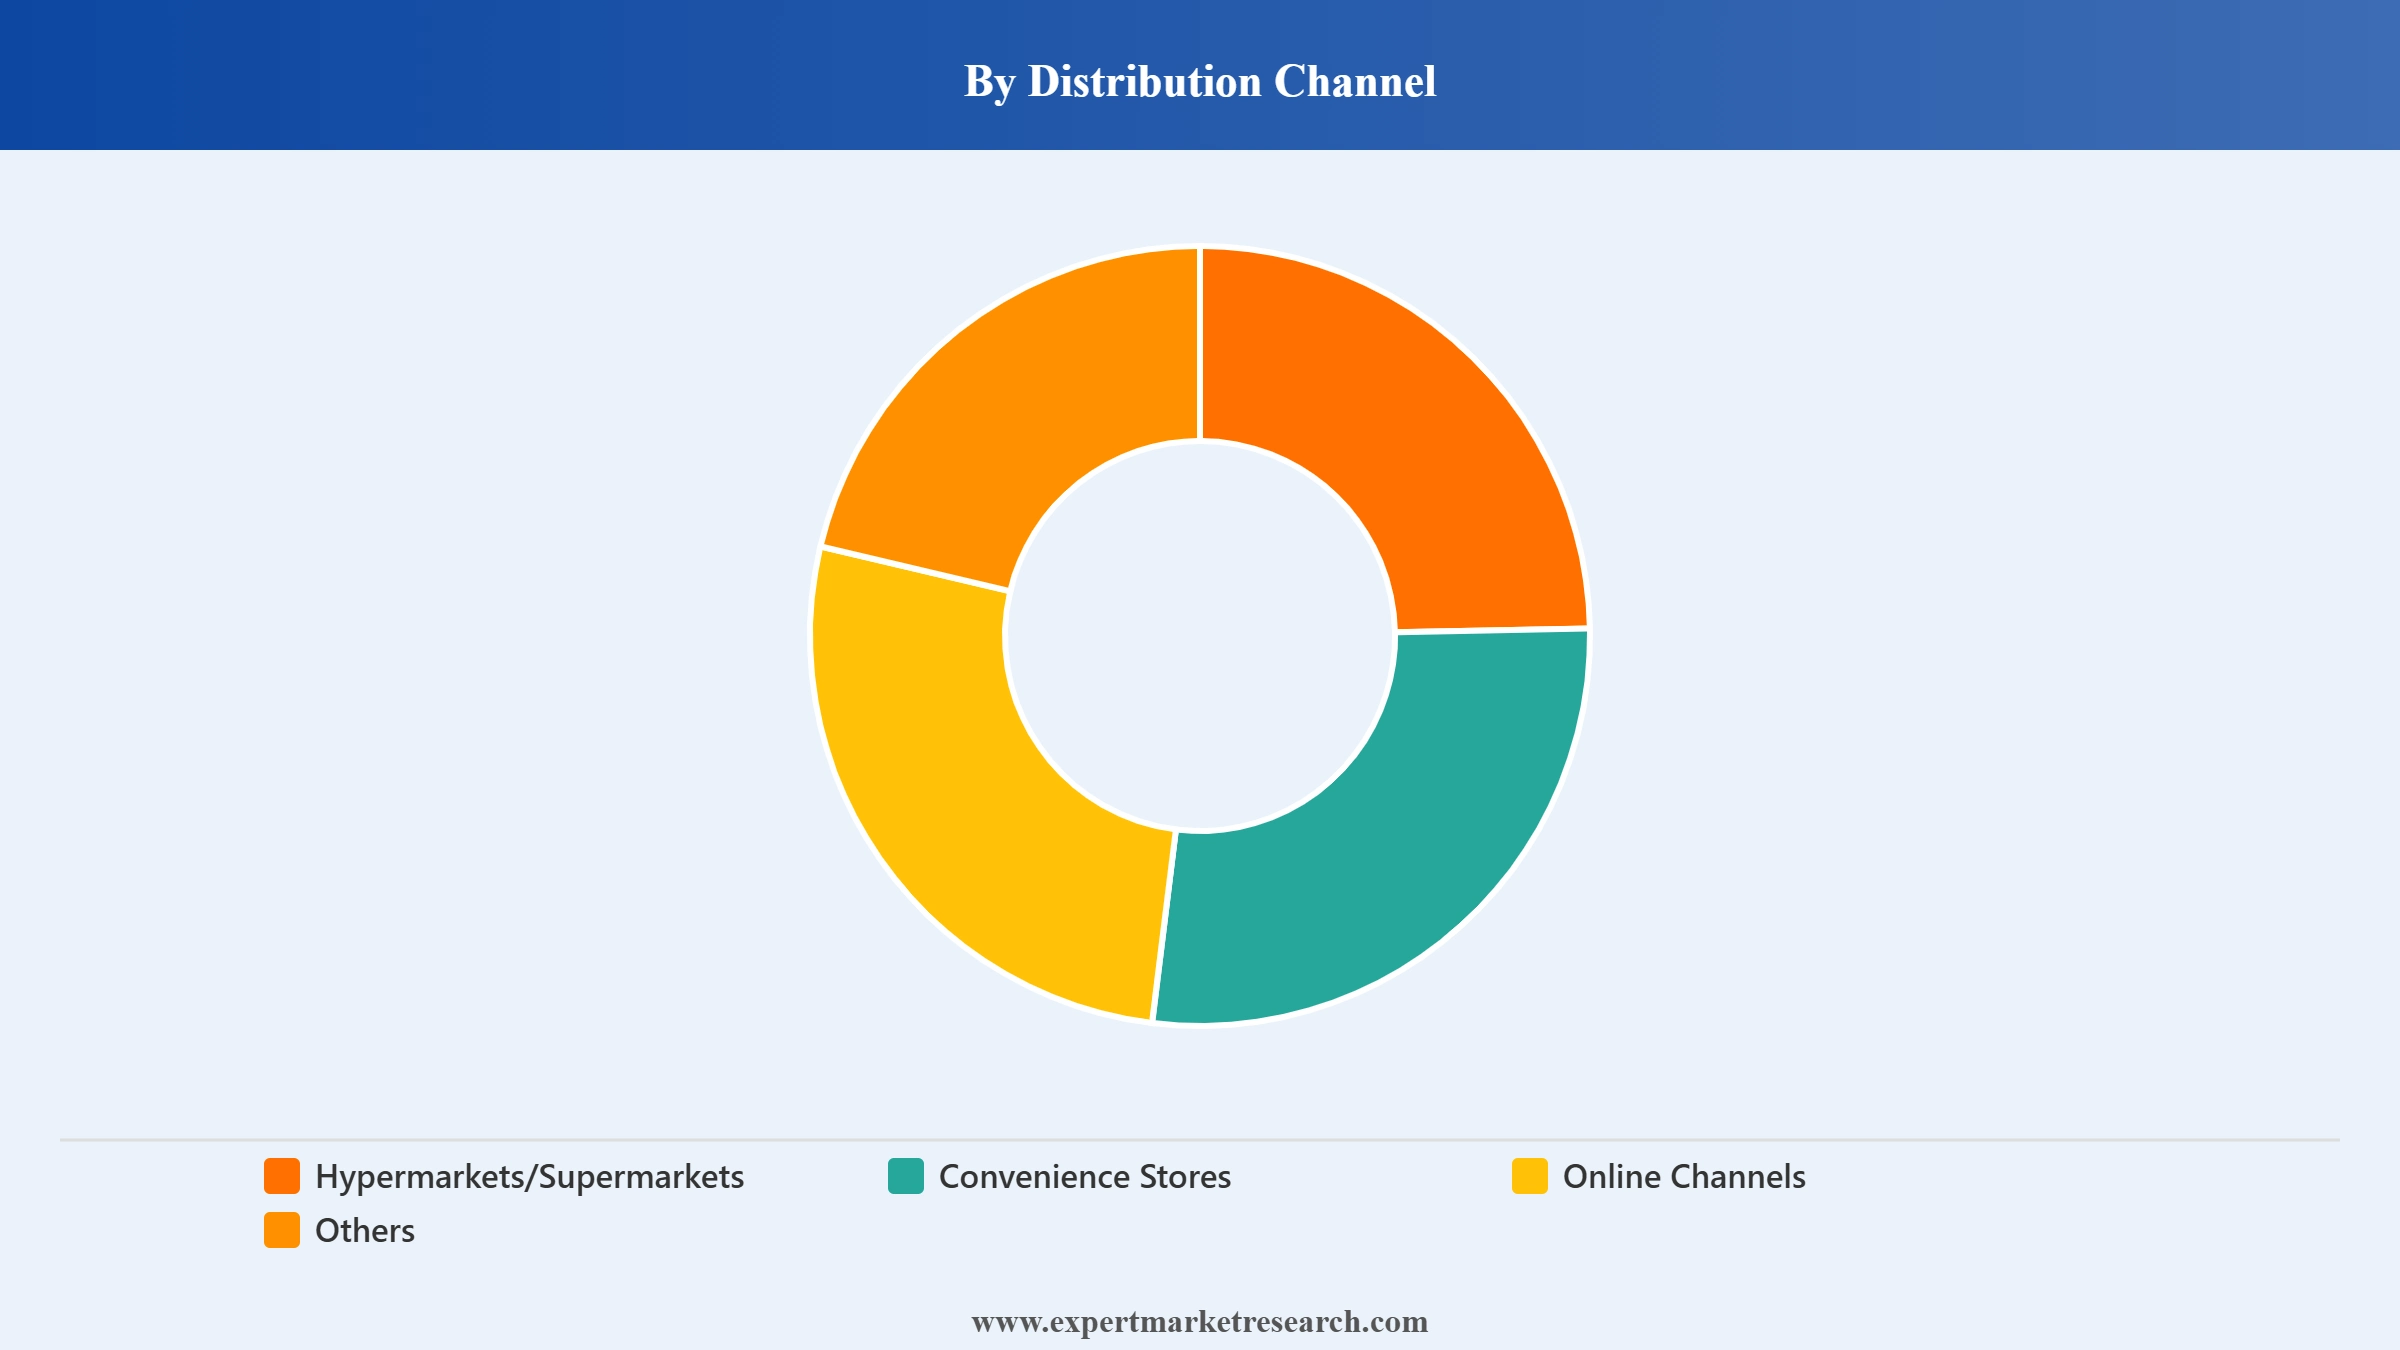
Key Insight: Hypermarkets and Supermarkets dominate the US snacks distribution landscape, accounting for over 90% of retail snacks revenue through their extensive shelf space, broad assortment, and frequent promotional activity. Leading grocery chains including Walmart, Kroger, and Costco serve as the primary purchase venues for planned snack purchases across all US geographic regions. Convenience Stores are the dominant channel for impulse-driven, single-serve, and travel-pack snack formats, capturing a disproportionate share of high-margin products from manufacturers including PepsiCo's Frito-Lay and Hostess. Online Channels are the fastest-growing distribution segment, driven by the growth of grocery delivery platforms, subscription snack boxes, and direct-to-consumer brand sites, particularly for premium, specialty, and health-oriented snack formats. The Others category includes foodservice outlets, vending machines, and specialty natural food retailers.
Market Breakup by Region
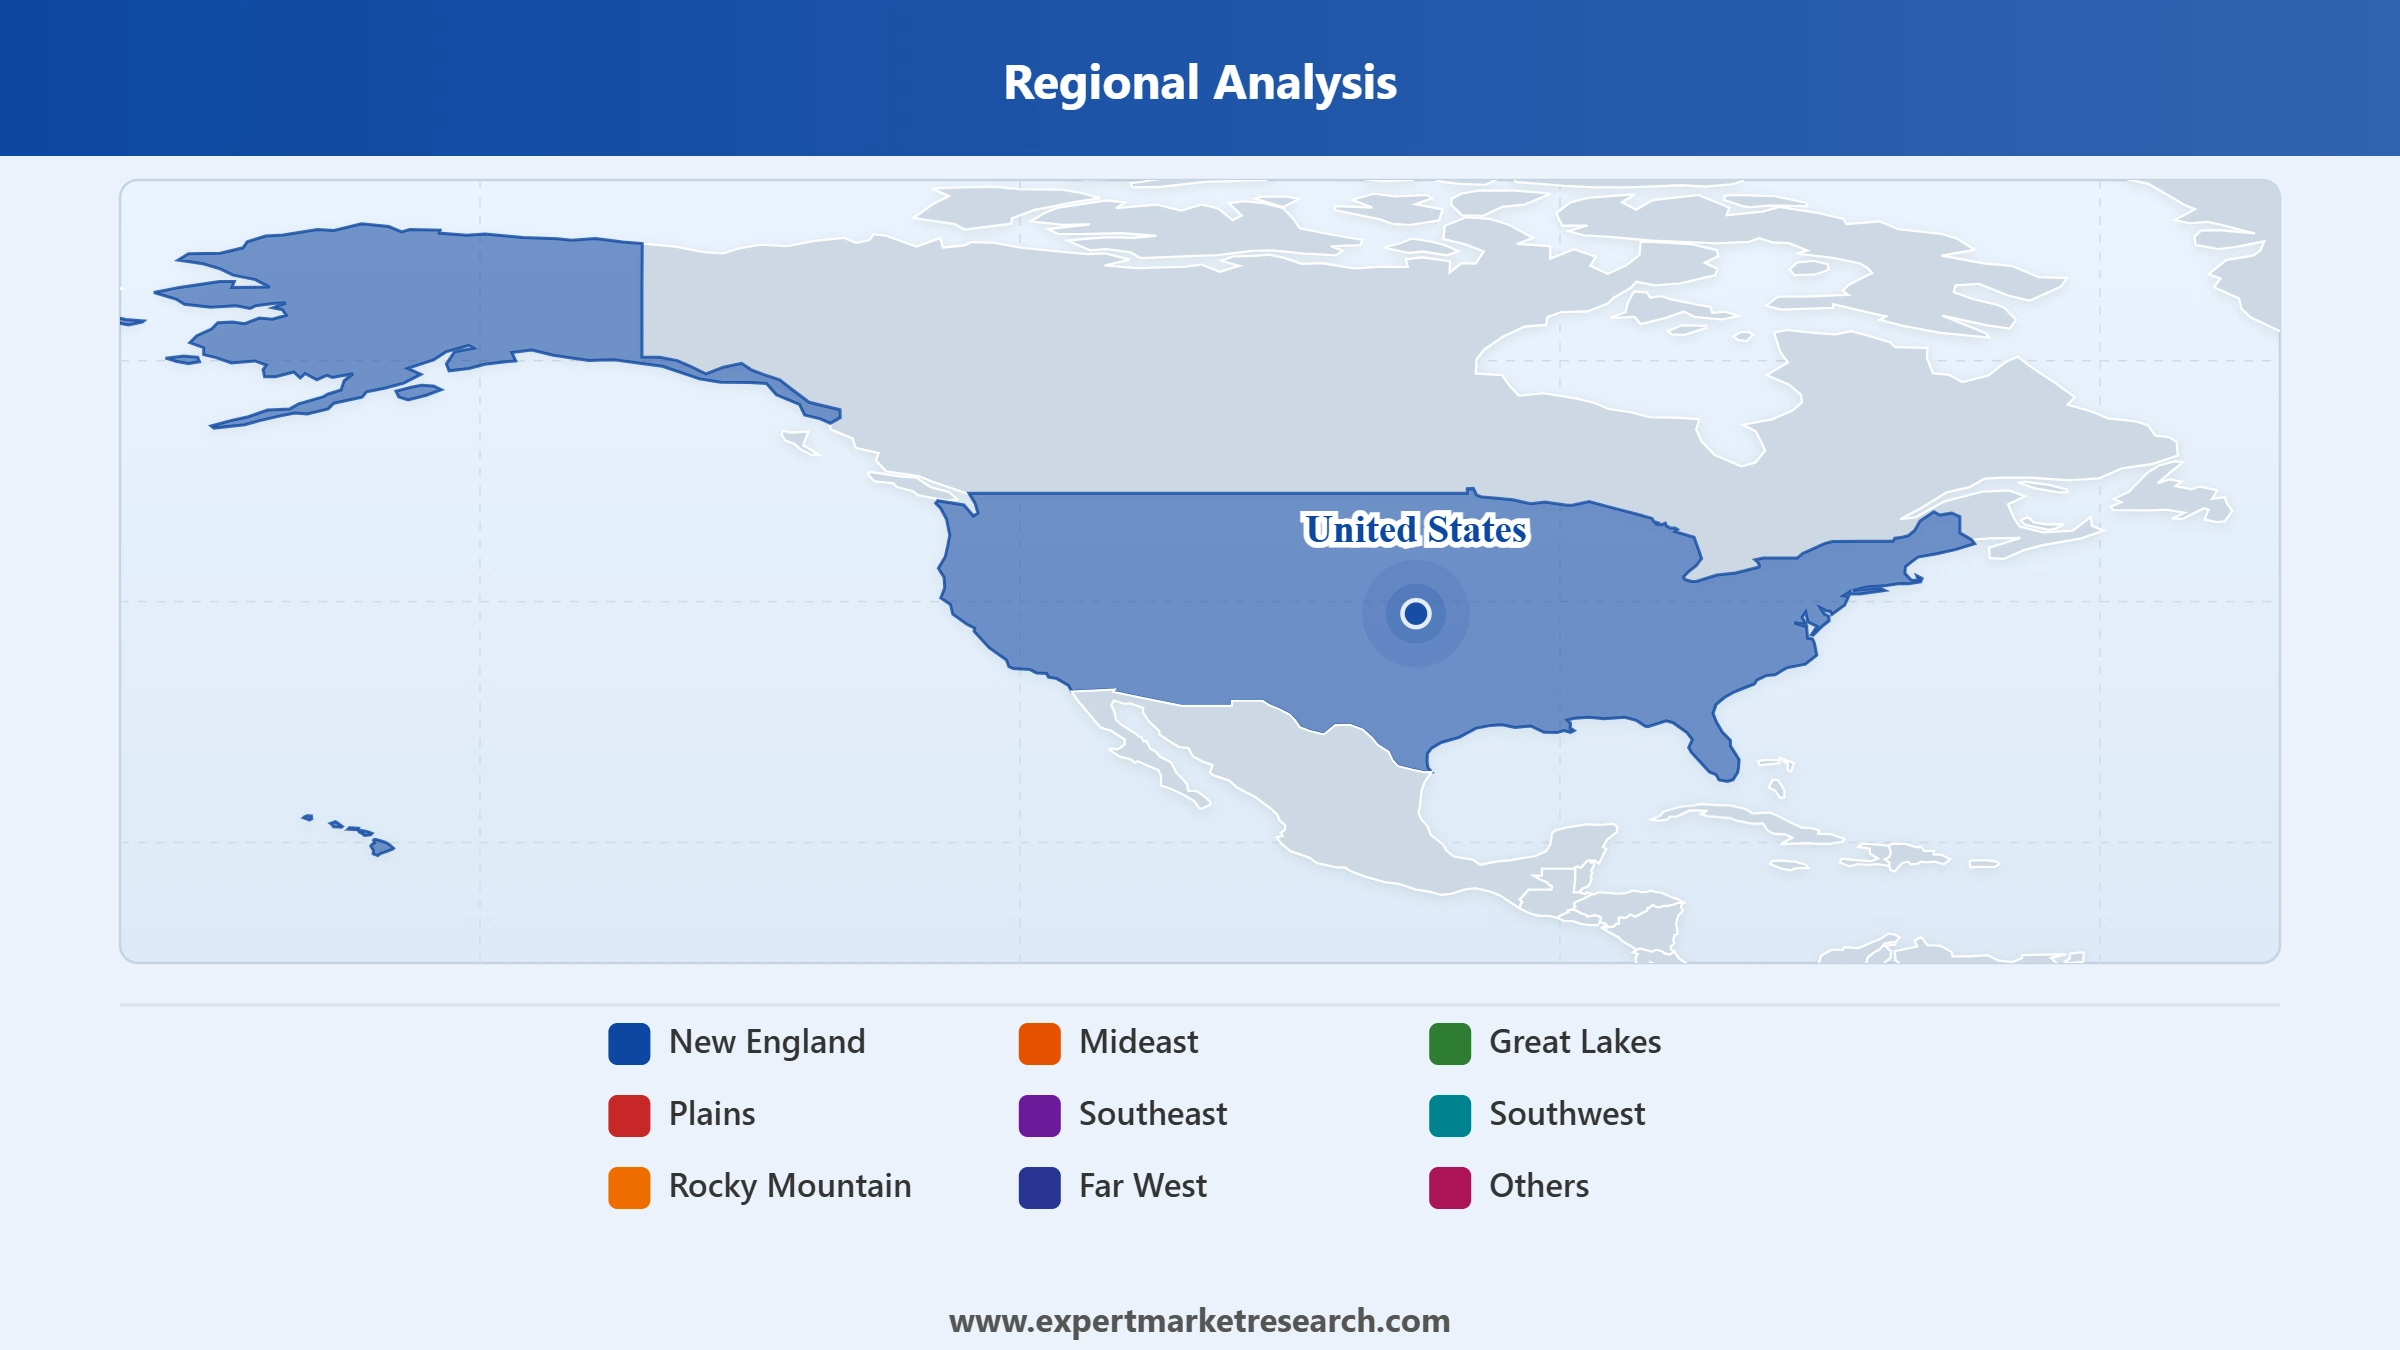
Key Insight: The Great Lakes region is the dominant US snacks market, representing approximately 14% of total market share and anchored by major population centers including Chicago, Detroit, and Cleveland that generate high retail snack volumes across all categories. The Southeast is the fastest-growing regional market, with a projected CAGR of 3.8% over the forecast period, driven by increasing consumer disposable incomes, population growth, and rising demand for frozen and baked snack goods across states including Florida, Georgia, and North Carolina. The Far West, anchored by California's large and health-conscious consumer base, is a key innovation hub for better-for-you and plant-based snack formats. The Southwest and Plains regions maintain stable demand anchored by large-scale retail distribution infrastructure and consistent consumer snacking habits among a broad demographic base.


Read more about this report - REQUEST FREE SAMPLE COPY IN PDF
By Type
Within the type segmentation, Confectionery Snacks command the largest individual revenue share in the US snacks market, reflecting the deep consumer affinity for chocolate, candy, and sweet snack formats across demographic segments. Hershey, Mars (now including Kellanova), and Mondelez collectively dominate this segment, leveraging their extensive retail distribution networks, promotional investment, and iconic brand positioning to sustain high purchase frequency. Bakery Snacks represent the second-largest type segment by revenue, with particularly strong performance in crackers, cookies, and granola bars, where consumer demand spans both indulgent and health-oriented sub-categories. Frozen Snacks are gaining share rapidly as consumers increasingly rely on convenient, ready-to-heat snack formats as partial meal replacements, particularly for breakfast and lunch occasions.
Read more about this report - REQUEST FREE SAMPLE COPY IN PDF
By Distribution Channel
Within the distribution channel segmentation, Hypermarkets and Supermarkets command the dominant share of US snacks revenue, consistent with consumer behavior where over 90% of snacks purchases occur through offline retail channels. The supermarket environment offers manufacturers optimal conditions for planned purchase stimulation through shelf placement, end-cap displays, and loyalty card promotions. Convenience Stores hold the second most significant distribution share, particularly for impulse-format, single-serve, and grab-and-go snack products including crisps, candy bars, and packaged nuts. Online Channels, while currently a smaller share of total revenue, are growing at the fastest rate among distribution types, capturing growing consumer adoption of grocery delivery and snack subscription services.
Read more about this report - REQUEST FREE SAMPLE COPY IN PDF
The Great Lakes region is the largest snacks market in the United States by regional share, representing approximately 14% of national snacks market revenue. The region's large urban population, high per-capita retail spending, and extensive distribution infrastructure across Illinois, Ohio, Michigan, Indiana, and Wisconsin collectively generate strong and consistent demand across all snack categories. Chicago serves as both a major consumption center and a hub for several leading snacks manufacturers including Mondelez International and Kellanova (now Mars Snacking), giving the region additional strategic significance in the US snacks supply chain. Retailers including Jewel-Osco, Meijer, and Kroger maintain dense store networks across the Great Lakes states, ensuring broad consumer access to the full range of snack formats and price tiers.
Read more about this report - REQUEST FREE SAMPLE COPY IN PDF
The Southeast is the fastest-growing regional snacks market, projected to expand at a CAGR of 3.8% over the forecast period, driven by population migration into states including Florida, Georgia, Texas, and North Carolina and rising consumer disposable incomes across the region. Demand for frozen snacks and baked goods is particularly strong in the Southeast, reflecting the region's large family household demographic and cultural affinity for convenient meal-adjacent food formats. The Southeast also hosts a rapidly expanding convenience store network, including Circle K, Wawa, and Buc-ee's locations, which serve as key distribution points for impulse snack categories. Major manufacturers are increasingly prioritizing Southeast distribution investments to capture the region's demographic-driven volume growth during the forecast period.
The United States Snacks Market is highly consolidated at the top, with PepsiCo (Frito-Lay), Mars (now including Kellanova), and Mondelez International commanding the largest combined market share through iconic product portfolios spanning salty, sweet, and savory snack categories. The completion of the Mars-Kellanova merger in December 2025 has created the most significant competitive realignment in the US snacks sector in decades, placing new competitive pressure on both PepsiCo and Mondelez to defend their category leadership positions through product innovation and M&A of their own.
Competitive intensity is highest in the salty snacks and confectionery segments, where consumer brand loyalty is strong but susceptible to disruption by new flavor innovation, licensed brand collaborations, and better-for-you repositioning. Mid-market players including General Mills and J.M. Smucker are leveraging strategic acquisitions to build scale in premium and convenience snacking channels, while smaller challenger brands are capturing share in the online and specialty retail channels through agile innovation and direct-to-consumer engagement.
Founded in 1965 and headquartered in Purchase, New York, PepsiCo is the largest US snacks company by revenue through its Frito-Lay North America division, which markets Lay's, Doritos, Cheetos, Ruffles, SunChips, and Smartfood brands across the country. Frito-Lay is the dominant force in US salty snacks, controlling the largest shelf space allocation in supermarket snack aisles and the highest convenience store distribution footprint of any snack manufacturer. PepsiCo's integrated beverages-and-snacks model allows for combined promotional and distribution efficiencies that smaller competitors cannot replicate.
Founded in 2012 as a spin-off from Kraft Foods and headquartered in Chicago, Illinois, Mondelez International markets iconic US snack brands including Oreo, Ritz, Triscuit, belVita, Wheat Thins, Chips Ahoy, and Sour Patch Kids. Mondelez holds strong positions in both the biscuits/crackers and confectionery segments of the US snacks market, with Oreo ranking as one of the highest-selling biscuit brands globally. The company's US strategy emphasizes flavor innovation, limited-edition collaborations, and expanding its presence in the premium and better-for-you segments.
Founded in 1906 as Kellogg Company and rebranded as Kellanova in 2023 following the separation of its cereal business, Kellanova was headquartered in Chicago, Illinois, and operated iconic US snack brands including Pringles, Cheez-It, Pop-Tarts, Rice Krispies Treats, RXBAR, and Nutri-Grain before its acquisition by Mars Incorporated was completed in December 2025. Under Mars Snacking, these brands will continue to be developed as part of a broader multi-category snacking portfolio, maintaining their leadership positions in the US salty snacks, portable breakfast, and nutrition bar segments.
Founded in 1856 and headquartered in Golden Valley, Minnesota, General Mills is a leading US food company with significant snacking presence through brands including Nature Valley granola bars, Annie's organic snacks, Chex Mix, Bugles, and Gardetto's. The company's snack portfolio addresses both mainstream and premium health-oriented consumer segments, with Nature Valley being the leading granola bar brand in the United States. General Mills' strategic focus on natural and organic snacking through its Annie's brand and continued Nature Valley product innovation positions it strongly in the fastest-growing snack health subcategories.
Other key players in the market are Nestle S.A., Conagra Brands Inc., Grupo Bimbo S.A.B. de C.V., The J.M. Smucker Company, Tyson Foods Inc., Mars Incorporated Inc., and Others.
*Please note that this is only a partial list; the complete list of key players is available in the full report. Additionally, the list of key players can be customized to better suit your needs.*
Ready to sharpen your strategy in America's dynamic snacks sector? Our 2026-2035 report on the United States Snacks Market delivers comprehensive market sizing, segment-level forecasts, regional growth breakdowns, and competitive intelligence on every major player from PepsiCo's Frito-Lay to the newly combined Mars Snacking entity. Whether you are a snack brand, a retailer, a private label manufacturer, or an investor, this report gives you the intelligence foundation for confident decisions. Download your free sample today and discover the key opportunities in the US snacking landscape.
Upto 15% Off
USD
$2499 $2249
$3999 $3599
$4999 $4249
$5999 $5099


*While we strive to always give you current and accurate information, the numbers depicted on the website are indicative and may differ from the actual numbers in the main report. At Expert Market Research, we aim to bring you the latest insights and trends in the market. Using our analyses and forecasts, stakeholders can understand the market dynamics, navigate challenges, and capitalize on opportunities to make data-driven strategic decisions.*
In 2025, the market reached an approximate value of USD 362.16 Billion.
The market is projected to grow at a CAGR of 3.30% between 2026 and 2035.
The market is estimated to witness healthy growth in the forecast period of 2026-2035 to reach a value of around USD 501.08 Billion by 2035.
The different types of snacks in the market are bakery snacks, confectionery snacks, frozen snacks, and fruit snacks, among others.
The major regions covered in the market report are New England, Mideast, Great Lakes, Plains, Southeast, Southwest, Rocky Mountain, and Far West, among others.
The different distribution channels in the market are hypermarkets/supermarkets, convenience stores, and online channels, among others.
The key market players are Pepsico, Inc., Mondelez International Inc., Kellanova, General Mills, Inc., Nestle S.A., Conagra Brands, Inc., Grupo Bimbo S.A.B. de C.V., The J.M. Smucker Sompany, Tyson Foods, Inc., and Mars Incorporated, Inc., among others.
Explore our key highlights of the report and gain a concise overview of key findings, trends, and actionable insights that will empower your strategic decisions.
| REPORT FEATURES | DETAILS |
| Base Year | 2025 |
| Historical Period | 2019-2025 |
| Forecast Period | 2026-2035 |
| Scope of the Report |
Historical and Forecast Trends, Industry Drivers and Constraints, Historical and Forecast Market Analysis by Segment:
|
| Breakup by Type |
|
| Breakup by Distribution Channel |
|
| Breakup by Region |
|
| Market Dynamics |
|
| Competitive Landscape |
|
| Companies Covered |
|
Datasheet
One User
USD 2,499
USD 2,249
tax inclusive*
Single User License
One User
USD 3,999
USD 3,599
tax inclusive*
Five User License
Five User
USD 4,999
USD 4,249
tax inclusive*
Corporate License
Unlimited Users
USD 5,999
USD 5,099
tax inclusive*
*Please note that the prices mentioned below are starting prices for each bundle type. Kindly contact our team for further details.*
Flash Bundle
Small Business Bundle
Growth Bundle
Enterprise Bundle
*Please note that the prices mentioned below are starting prices for each bundle type. Kindly contact our team for further details.*
Flash Bundle
Number of Reports: 3
20%
tax inclusive*
Small Business Bundle
Number of Reports: 5
25%
tax inclusive*
Growth Bundle
Number of Reports: 8
30%
tax inclusive*
Enterprise Bundle
Number of Reports: 10
35%
tax inclusive*
How To Order

Select License Type
Choose the right license for your needs and access rights.

Click on ‘Buy Now’
Add the report to your cart with one click and proceed to register.

Select Mode of Payment
Choose a payment option for a secure checkout. You will be redirected accordingly.
Strategic Solutions for Informed Decision-Making
Gain insights to stay ahead and seize opportunities.

Get insights & trends for a competitive edge.

Track prices with detailed trend reports.

Analyse trade data for supply chain insights.

Leverage cost reports for smart savings

Enhance supply chain with partnerships.

Connect For More Information
Our expert team of analysts will offer full support and resolve any queries regarding the report, before and after the purchase.
Our expert team of analysts will offer full support and resolve any queries regarding the report, before and after the purchase.
We employ meticulous research methods, blending advanced analytics and expert insights to deliver accurate, actionable industry intelligence, staying ahead of competitors.
Our skilled analysts offer unparalleled competitive advantage with detailed insights on current and emerging markets, ensuring your strategic edge.
We offer an in-depth yet simplified presentation of industry insights and analysis to meet your specific requirements effectively.


