

Consumer Insights
Uncover trends and behaviors shaping consumer choices today
Procurement Insights
Optimize your sourcing strategy with key market data
Industry Stats
Stay ahead with the latest trends and market analysis.
The volatile organic compound gas sensor market attained a value of USD 170.14 Million as of 2025 and is anticipated to grow at a CAGR of 5.00% during the forecast period of 2026 to 2035. The market for is increasing because of increased air quality concerns, smart sensor uptake, and demand from industrial, automotive, and environmental monitoring applications. The market is thus expected to reach a value of nearly USD 277.14 Million by 2035.
The global VOC gas sensor market is growing remarkably, driven by stringent environmental policy and increased awareness of air quality. Governments around the world are implementing policies to regulate and monitor VOC emissions, which is pressurizing industries to take up cutting-edge sensing technologies. Such a regulatory environment is driving innovation and widening the reach of the market across sectors.
Technological advancements in sensor technology, specifically the use of nanomaterials and IoT functionality, are improving the sensitivity, selectivity, and real-time response of VOC gas sensors. Such advancements are making possible more precise detection of low-concentration VOCs, allowing them to be used in smart homes, industrial safety, and environmental monitoring. The miniaturization and wireless connectivity trend is also increasing the use of these sensors, and hence increasing the growth of the Volatile Organic Compound Gas Sensor market.
Asia Pacific is seeing strong growth in the VOC gas sensor market based on rising industrial activity, air quality regulations tightening, and the development of urban infrastructure. Greater public awareness and government spending on smart city programs are further speeding up demand for sophisticated air monitoring technology across top economies such as China, India, and Japan.
Compound Annual Growth Rate
5%
Value in USD Million
2026-2035
Read more about this report - REQUEST FREE SAMPLE COPY IN PDF
The market for volatile organic compound (VOC) gas sensor is growing significantly due to increased environmental awareness and stringent global regulations for the control of air pollution. Governments and regulatory authorities are imposing VOC emission monitoring in industries like manufacturing, oil and gas, and chemicals. This has hugely raised the demand for sophisticated VOC gas sensors. For instance, most factories are now fitting real-time VOC monitoring systems for workplace safety and compliance with environmental regulations, resulting in a boom in sensor deployment. Factors such as these are resulting in the growth of volatile organic compound gas sensor market.
Market growth is also being driven by various advancements in technology. Nanomaterial integration and Internet of Things (IoT) functionalities in VOC sensors have improved their sensitivity, precision, and remote monitoring capabilities. These technologies are being applied to smart buildings, where the sensors regulate ventilation in accordance with indoor air quality. Furthermore, demand for portable air quality sensors is increasing, especially in cities where pollution levels are high. Startups and existing companies alike are creating miniaturized VOC sensors for personal consumption, like wearable air pollution detectors and home air quality monitors, showing how the market is expanding beyond industrial applications into consumer-oriented solutions.
VOC sensors are increasingly integrated into HVAC systems, automotive applications, food industry quality control, and low-power, portable devices for improved air quality, safety, and efficiency, thus shaping the volatile organic compound gas sensor market dynamics and trends.
Siemens unveiled major advancements in industrial AI and digital twin technology at CES. Key highlights included the launch of the Siemens Industrial Copilot for real-time AI-driven operations, a collaboration with JetZero to develop a blended wing aircraft using Siemens Xcelerator, and partnerships with NVIDIA and Sony to enhance product lifecycle management and immersive engineering solutions.
Honeywell announced plans to spin off its Advanced Materials business into a separate, publicly traded company by late 2025 or early 2026. The new entity will focus on sustainability-driven specialty chemicals and materials, including brands like Solstice and Spectra. This move aims to streamline Honeywell's portfolio and enhance strategic focus.
A study revealed that plant fiber-based food packaging and municipal solid waste release significant amounts of volatile per- and polyfluoroalkyl substances (PFAS) during landfill decomposition, emphasizing the need for improved waste management to mitigate these emissions.
ams Osram announced plans to invest €588 million by 2030 to expand its semiconductor production in Premstätten, Austria. The investment includes constructing a new factory and cleanroom for CMOS production, aiming to enhance capabilities in medical, automotive, industrial, and consumer applications. The project is expected to create 250 new jobs and support Europe's technological sovereignty.
VOC sensors are being more and more incorporated into heating, ventilation, and air conditioning (HVAC) systems to maximize indoor air quality. These combined systems automatically control airflow and filtration according to VOC levels, enhancing energy efficiency and health conditions in commercial buildings, schools, hospitals, and intelligent residential infrastructure, thus pushing the growth of the volatile organic compound gas sensor market.
Automakers are integrating VOC sensors into vehicle cabins to track and control air quality. The sensors detect toxic emissions from interior components and outside pollutants, triggering air circulation or filtration. The trend supports passenger health and is consistent with increasing consumer demand for cleaner, healthier in-vehicle environments.
The food and beverage sector is embracing VOC sensors for quality assurance and spoilage monitoring. The sensors assist in tracking packaging environments and production lines, detecting volatile compounds emitted by deteriorating products, thus improving food safety, shelf life, and minimizing waste along supply chains, thereby helping to create new trends in the volatile organic compound gas sensor market.
Ultra-low-power VOC sensors are being developed by manufacturers to enable long-term, remote, and portable use. These technologies enable longer battery lifetime, allowing deployment in hard-to-reach areas such as pipelines, storage tanks, and wearable technology for personal exposure monitoring, particularly in developing and off-grid areas.
A key trend within the volatile organic compound gas sensor industry is IoT and smart monitoring system integration. IoT-enabled sensors make it possible to monitor VOC in real time and transmit data to enable preventive maintenance and compliance with regulations. Smart building systems, for instance, now employ VOC sensors to optimize ventilation automatically to improve indoor air quality, thereby shaping new trends in the volatile organic compound market.
Another trend is the use of nanotechnology in sensor development. Nanomaterials such as graphene and metal oxides enhance sensitivity, selectivity, and energy efficiency. Such advanced sensors are being used in wearables and miniaturized air quality monitors. For example, researchers and startups are working on nano-enabled VOC detectors for personal and urban pollution monitoring to meet increasing consumer demand for portable, precise environmental sensing solutions for residential, industrial, and healthcare applications.
Read more about this report - REQUEST FREE SAMPLE COPY IN PDF
The EMR’s report titled “Volatile Organic Compound Gas Sensor Market Report and Forecast 2026-2035” offers a detailed analysis of the market based on the following segments:
Market Breakup by Technology
Market Breakup by Types
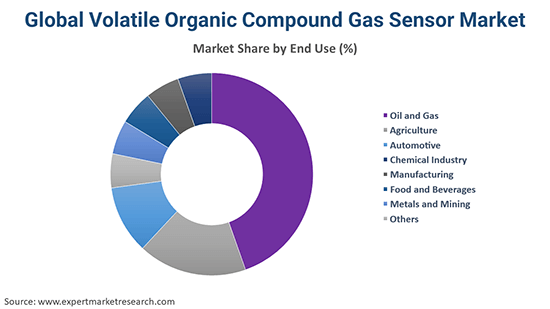
Market Breakup by End Use
Market Breakup by Region


The global volatile organic compound (VOC) gas sensor market is seeing increased momentum with many detection technologies due to the increased air quality concerns and increasing environmental regulations. As per the volatile organic compound gas sensor market analysis, photo-ionization detectors (PIDs) are in increased demand due to their real-time response and high sensitivity. They are highly employed in environmental monitoring, hazardous material handling, and industrial hygiene, particularly for the detection of low-concentration VOCs across a wide spectrum of compounds.
Infrared-based detection feature in these sensors is growing rapidly as well. The technology is characterized by its dependable performance, low false alarm rates, and low maintenance requirements, and hence it suits fixed gas detection systems in the oil and gas, petrochemical, and chemical sectors. Its capability of operation in adverse conditions without degradation by humidity or toxic gases adds to its favor.
According to the volatile organic compound gas sensor industry analysis, metal-oxide semiconductor (MOS) technology is gaining widespread use because of its affordability, miniaturized size, and the capacity to monitor several VOCs. It is widely used in consumer electronics, heating, ventilation, and air conditioning systems, and automotive applications for the constant monitoring of indoor air quality.
The "others" group, which encompasses electrochemical and catalytic sensors, is also evolving through miniaturization and wireless technology. These sensors are essential in niche and new applications, especially where portable and battery-efficient VOC monitoring is needed. Together, these technologies are transforming the VOC sensor market through performance, versatility, and innovation.
Leading volatile organic compound gas sensor market players are gearing up to increase detection technologies via innovations such as nanomaterials for enhancing sensitivity and machine learning for processing real-time data. Developments in infrared-based sensors and wireless sensor networks are picking up speed, allowing low-cost, energy-efficient monitoring. Moreover, combinations of IoT and low-power wide-area networks (LPWAN) are making remote monitoring increasingly better, enabling longer battery lifetimes for sensors. These innovations seek to improve air quality monitoring, regulatory compliance, and safety in industries like manufacturing and automotive.
Founded in 1976 and based in Japan, Figaro Engineering provides a variety of VOC gas sensors, such as semiconductor and electrochemical sensors. The sensors can sense gases such as ethanol, ammonia, and benzene, which are commonly used in air quality monitoring, industrial safety, and domestic appliances.
Established in 1906 with its headquarters in the United States, Honeywell offers a range of VOC gas sensors applicable for use in industrial safety and environmental monitoring. Their products include electrochemical, catalytic, and metal oxide sensors, which are utilized in air quality management, leak detection, and HVAC.
Founded in 1847 in Germany, Siemens provides VOC gas detection solutions through its industrial automation and process control offerings. Its VOC sensors are used in smart building systems, air quality management, and industrial emission monitoring, targeting energy efficiency and compliance.
*Please note that this is only a partial list; the complete list of key players is available in the full report. Additionally, the list of key players can be customized to better suit your needs.*
Other key players profiled in the volatile organic compound gas sensor market include Sciosense B.V., Teledyne FLIR LLC, Aeroqual Limited, Alphasense Ltd, Drägerwerk AG & Co. KGaA, and Global Detection Systems Corp., among others.
Upto 15% Off
USD
$3999 $3599
$2499 $2249
$4999 $4249
$5999 $5099


*While we strive to always give you current and accurate information, the numbers depicted on the website are indicative and may differ from the actual numbers in the main report. At Expert Market Research, we aim to bring you the latest insights and trends in the market. Using our analyses and forecasts, stakeholders can understand the market dynamics, navigate challenges, and capitalize on opportunities to make data-driven strategic decisions.*
In 2025, the volatile organic compound gas sensor market reached an approximate value of USD 170.14 Million.
The market is assessed to grow at a CAGR of 5.00% between 2026 and 2035.
The market is estimated to witness healthy growth in the forecast period of 2026-2035 to reach a value of around USD 277.14 Million by 2035.
The major drivers of the market include rising disposable incomes, increasing population, and the rising demand for sensors with high accuracy and low power consumption.
The increased awareness regarding indoor and outdoor air quality and features like explosive or hazardous gas detection at safe distances are expected to be key trends guiding the growth of the market.
North America, Europe, the Asia Pacific, Latin America, and the Middle East and Africa are the major regions in the market.
The leading technologies in the market are photo-ionization detector (PID), infrared-based detection, and metal-oxide semiconductor, among others.
The major types of volatile organic compound gas sensors in the market are single gas detection sensor and multiple gas detection sensor.
The significant end uses in the market are oil and gas, agriculture, automotive, chemical industry, manufacturing, food and beverages, and metals and mining, among others.
The key players in the global volatile organic compound gas sensor market are Figaro Engineering Inc., Sciosense B.V., Honeywell International Inc., Siemens AG, Teledyne FLIR LLC, Aeroqual Limited, Alphasense Ltd, Drägerwerk AG & Co. KGaA, and Global Detection Systems Corp., among others.
Explore our key highlights of the report and gain a concise overview of key findings, trends, and actionable insights that will empower your strategic decisions.
| REPORT FEATURES | DETAILS |
| Base Year | 2025 |
| Historical Period | 2019-2025 |
| Forecast Period | 2026-2035 |
| Scope of the Report |
Historical and Forecast Trends, Industry Drivers and Constraints, Historical and Forecast Market Analysis by Segment:
|
| Breakup by Technology |
|
| Breakup by Type |
|
| Breakup by End Use |
|
| Breakup by Region |
|
| Market Dynamics |
|
| Competitive Landscape |
|
| Companies Covered |
|
| Report Price and Purchase Option | Explore our purchase options that are best suited to your resources and industry needs. |
| Delivery Format | Delivered as an attached PDF and Excel through email, with an option of receiving an editable PPT, according to the purchase option. |
Single User License
One User
USD 3,999
USD 3,599
tax inclusive*
Datasheet
One User
USD 2,499
USD 2,249
tax inclusive*
Five User License
Five User
USD 4,999
USD 4,249
tax inclusive*
Corporate License
Unlimited Users
USD 5,999
USD 5,099
tax inclusive*
*Please note that the prices mentioned below are starting prices for each bundle type. Kindly contact our team for further details.*
Flash Bundle
Small Business Bundle
Growth Bundle
Enterprise Bundle
*Please note that the prices mentioned below are starting prices for each bundle type. Kindly contact our team for further details.*
Flash Bundle
Number of Reports: 3
20%
tax inclusive*
Small Business Bundle
Number of Reports: 5
25%
tax inclusive*
Growth Bundle
Number of Reports: 8
30%
tax inclusive*
Enterprise Bundle
Number of Reports: 10
35%
tax inclusive*
How To Order

Select License Type
Choose the right license for your needs and access rights.

Click on ‘Buy Now’
Add the report to your cart with one click and proceed to register.

Select Mode of Payment
Choose a payment option for a secure checkout. You will be redirected accordingly.
Strategic Solutions for Informed Decision-Making
Gain insights to stay ahead and seize opportunities.

Get insights & trends for a competitive edge.

Track prices with detailed trend reports.

Analyse trade data for supply chain insights.

Leverage cost reports for smart savings

Enhance supply chain with partnerships.

Connect For More Information
Our expert team of analysts will offer full support and resolve any queries regarding the report, before and after the purchase.
Our expert team of analysts will offer full support and resolve any queries regarding the report, before and after the purchase.
We employ meticulous research methods, blending advanced analytics and expert insights to deliver accurate, actionable industry intelligence, staying ahead of competitors.
Our skilled analysts offer unparalleled competitive advantage with detailed insights on current and emerging markets, ensuring your strategic edge.
We offer an in-depth yet simplified presentation of industry insights and analysis to meet your specific requirements effectively.


