Chat with us, powered by LiveChat
Explore Our Diverse Range Of Offerings
From detailed reports to experts services offered in 15+ Industry Domains
Report
Press Release
Blogs
Industry Statistics
Add 2 More Reports For 20% off

Hyperhidrosis Epidemiology Forecast

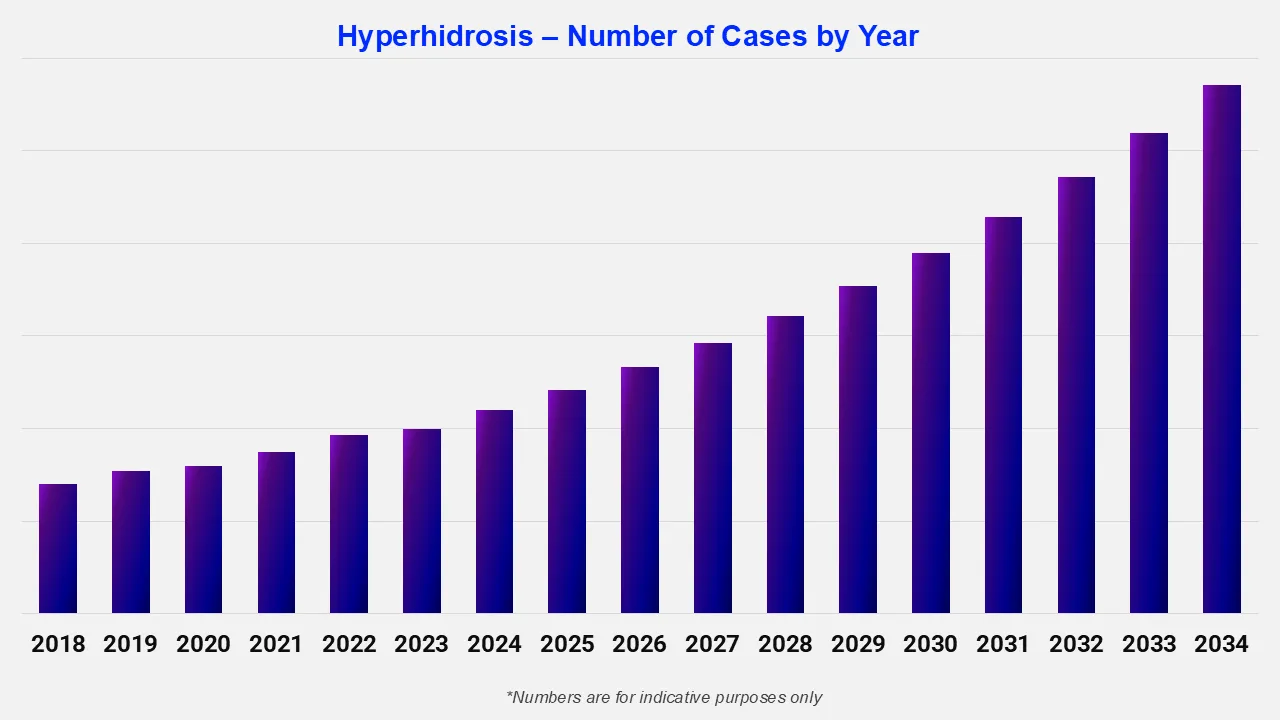
The International Hyperhidrosis Society reports that around 385 million people worldwide have hyperhidrosis, a condition characterized by excessive sweating. It is more common in younger people, affecting 8.8% of individuals aged 18 to 39. Hyperhidrosis epidemiology forecast indicates that hyperhidrosis often begins in early adulthood or adolescence.

2024

Base Year

2018-2024

Historical Period

2025-2034

Forecast Period

Hyperhidrosis Epidemiology Forecast Report Coverage

Expert Market Research's “Hyperhidrosis Epidemiology Forecast Report 2025-2034” offers comprehensive information on the prevalence and demographics of hyperhidrosis. It projects the future incidence and prevalence rates of hyperhidrosis across various populations. The study covers age, gender, and type as major determinants of the hyperhidrosis-affected population. The report highlights patterns in the prevalence of hyperhidrosis over time and projects future trends based on multiple variables.

The report provides a comprehensive overview of the disease, as well as historical and projected data on the epidemiology of hyperhidrosis in the 8 major markets.

Regions Covered

  • The United States
  • Germany
  • France
  • Italy
  • Spain
  • The United Kingdom
  • Japan
  • India

Hyperhidrosis Understanding: Disease Overview

In hyperhidrosis, a person sweats excessively, even when it is not needed to regulate body temperature. This can happen in specific areas, such as the hands, feet, armpits, or face, or it can affect the whole body. There are two main types of hyperhidrosis: primary, which is typically inherited, and secondary, which is caused by other health conditions or medications. Hyperhidrosis can interfere with daily activities and social situations, with people often experiencing embarrassment and discomfort due to the constant sweating. Studies show that hyperhidrosis can be triggered by stress, heat, or certain medications.

Hyperhidrosis Epidemiology Perspective

The hyperhidrosis epidemiology section offers information on the patient pool from history to the present as well as the projected trend for each of the 8 major markets. Expert Market Research provides both current and predicted trends for hyperhidrosis by examining a wide range of studies. Additionally, the report covers the diagnosed patient pool for hyperhidrosis and their trends. The data is broken down into specific categories, such as total prevalent cases in males and females, and total diagnosed cases across different age groups and patient pools.

  • As per the International Hyperhidrosis Society, nearly 385 million people are affected by hyperhidrosis across the globe.
  • Primary focal hyperhidrosis is the most common type of hyperhidrosis and is reported to usually start before age 25.
  • In the United States, approximately 3% of adults aged between 20 and 60 are living with hyperhidrosis.

Age-Based Hyperhidrosis Insights

Studies show that hyperhidrosis is significantly more common in younger individuals compared to the general population. It is estimated that about 8.8% of people between the ages of 18 and 39 experience this condition. This higher prevalence in younger adults suggests that hyperhidrosis often begins during adolescence or early adulthood.

Gender-Based Hyperhidrosis Insights

A study published in the Journal of Marine Medical Society (2024) found that hyperhidrosis was more common in males, with a male-to-female ratio of 1.4:1 and a prevalence of 2.6% in Indian patients. The average age of presentation was 24.5 years, with 90% of patients experiencing the onset of symptoms before the age of 30.

Country-wise Hyperhidrosis Epidemiology Segment

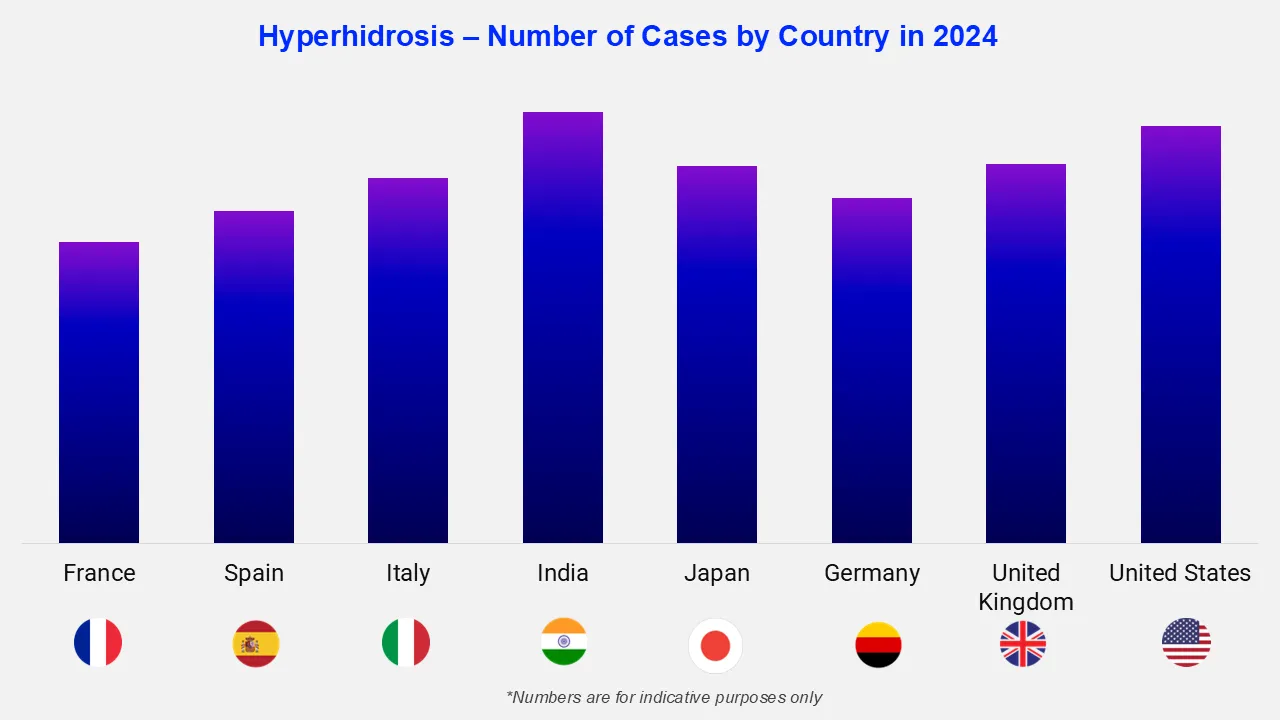
The hyperhidrosis epidemiology data and findings from the United States, Germany, Spain, Italy, France, the United Kingdom, Japan, and India are also provided in the epidemiology section.

The epidemiology of hyperhidrosis varies between countries, owing to differences in factors such as climate, genetics, lifestyle, healthcare access, and cultural attitudes toward sweating and medical treatments. According to a 2023 review published in the Journal of Dermatology, the incidence of hyperhidrosis varied from 0.13% in the United Kingdom to 0.28% in the USA, with females showing higher rates.

Key Questions Answered

  • What are the key findings of hyperhidrosis epidemiology in the 8 major markets?
  • What will be the total number of patients with hyperhidrosis across the 8 major markets during the forecast period?
  • What was the country-wise prevalence of hyperhidrosis in the 8 major markets in the historical period?
  • Which country will have the highest number of hyperhidrosis patients during the forecast period of 2025-2034?
  • Which key factors would influence the shift in the patient population of hyperhidrosis during the forecast period of 2025-2034?
  • What are the currently available treatments for hyperhidrosis?
  • What are the disease risks, signs, symptoms, and unmet needs of hyperhidrosis?

Related Reports

Neurological Disease Treatment Market Report and Forecast

*While we strive to always give you current and accurate information, the numbers depicted on the website are indicative and may differ from the actual numbers in the main report. At Expert Market Research, we aim to bring you the latest insights and trends in the market. Using our analyses and forecasts, stakeholders can understand the market dynamics, navigate challenges, and capitalize on opportunities to make data-driven strategic decisions.*

Looking for specific insights?

Get in touch with us for a customized solution tailored to your unique requirements and save upto 35%!

Report Summary

Explore our key highlights of the report and gain a concise overview of key findings, trends, and actionable insights that will empower your strategic decisions.

Key Highlights of the Report

Please note that the figures mentioned in the description serve as estimates and may vary from the actual figures presented in the final report.

Report Features

Details

Base Year

2024

Historical Period

2018-2024

Forecast Period

2025-2034

Epidemiology Statistics Provided

  • Diagnosed Prevalent Cases
  • Type-Specific Cases
  • Gender-Specific Cases
  • Age-Specific Cases

Segmentation Provided

  • Epidemiology by Age Group
  • Epidemiology by Gender
  • Epidemiology by Type of Disease
  • Epidemiology by Region

Geographies Covered

  • United States
  • Germany
  • Italy
  • France
  • Spain
  • United Kingdom
  • Japan
  • India

Single User License

10 % Off

USD

2,999

2,699

Datasheet

10 % Off

USD

1,999

1,799

Five User License

15 % Off

USD

4,399

3,739

Corporate License

15 % Off

USD

5,799

4,929

Single User License

One User

USD 2,999

USD 2,699

tax inclusive*

  • All Segments
  • Printing Restrictions
  • PDF Delivered via Email
  • Custom Report Layout
  • Post Sales Analysts Support
  • Periodic Updates
  • Unlimited Prints

Datasheet

One User

USD 1,999

USD 1,799

tax inclusive*

  • Selected Segments
  • Printing Restrictions
  • Excel Spreadsheet Delivered via Email
  • Full Report
  • Periodic Updates
  • Post Sales Analysts Support
  • Unlimited Prints

Five User License

Five User

USD 4,399

USD 3,739

tax inclusive*

  • All Segments
  • Five Prints Available
  • PDF Delivered via Email
  • Limited Free Customization
  • Post Sales Analyst Support
  • Custom Report Layout
  • Periodic Updates
  • Unlimited Prints

Corporate License

Unlimited Users

USD 5,799

USD 4,929

tax inclusive*

  • All Segments
  • Unlimited Prints Available
  • PDF & Excel Delivery via Email
  • Limited Free Customization
  • Post Sales Analysts Support
  • Discount On Next Update
  • Custom Report Layout

*Please note that the prices mentioned below are starting prices for each bundle type. Kindly contact our team for further details.*

Bundle Type

Flash Bundle

20% OFF Number of Reports: 3

Small Business Bundle

25% OFF Number of Reports: 5

Growth Bundle

30% OFF Number of Reports: 8

Enterprise Bundle

35% OFF Number of Reports: 10
Overview
  • Life Time Access
  • Analyst Support Related to Report
  • PDF Version of the Report
  • Complimentary Excel Data Set
  • Free Analyst Hours
  • Complimentary Free 1 Month Subscription to Trade Data Base
  • Complimentary One Month Subscription to Price Database (Chemicals only)
  • Complementary PPT Version of the Report
  • Complimentary License Upgrade
  • Complimentary Power BI Dashboards
  • Life Time Access
  • Analyst Support Related to Report
  • PDF Version of the Report
  • Complimentary Excel Data Set
  • Free Analyst Hours - 50 Hours
  • Complimentary Free 1 Month Subscription to Trade Data Base
  • Complimentary One Month Subscription to Price Database (Chemicals only)
  • Complementary PPT Version of the Report
  • Complimentary License Upgrade
  • Complimentary Power BI Dashboards
  • Life Time Access
  • Analyst Support Related to Report
  • PDF Version of the Report
  • Complimentary Excel Data Set
  • Free Analyst Hours - 80 Hours
  • Complimentary Free 1 Month Subscription to Trade Data Base
  • Complimentary One Month Subscription to Price Database (Chemicals only)
  • Complementary PPT Version of the Report
  • Complimentary License Upgrade
  • Complimentary Power BI Dashboards
  • Life Time Access
  • Analyst Support Related to Report
  • PDF Version of the Report
  • Complimentary Excel Data Set
  • Free Analyst Hours - 100 Hours
  • Complimentary Free 1 Month Subscription to Trade Data Base
  • Complimentary One Month Subscription to Price Database (Chemicals only)
  • Complementary PPT Version of the Report
  • Complimentary License Upgrade
  • Complimentary Power BI Dashboards

*Please note that the prices mentioned below are starting prices for each bundle type. Kindly contact our team for further details.*

Flash Bundle

Number of Reports: 3

20%

tax inclusive*

  • 3 Reports Included
  • Life Time Acess
  • Analyst Support Related to Report
  • PDF Version of the Report
  • Free 1 Month Subscription to Trade Data Base
  • 1 Month Subscription to Price Database (Chemicals only)
  • Complimentary Excel Data Set
  • PPT Version of the Report
  • Power BI Dashboards
  • License Upgrade
  • Free Analyst Hours

Small Business Bundle

Number of Reports: 5

25%

tax inclusive*

  • 5 Reports Included
  • Life Time Acess
  • Analyst Support Related to Report
  • PDF Version of the Report
  • Complimentary Excel Data Set
  • Free Analyst Hours - 50 Hours
  • Free 1 Month Subscription to Trade Data Base
  • 1 Month Subscription to Price Database (Chemicals only)
  • Complimentary Excel Data Set
  • PPT Version of the Report
  • Power BI Dashboards
  • License Upgrade

Growth Bundle

Number of Reports: 8

30%

tax inclusive*

  • 8 Reports Included
  • Life Time Acess
  • Analyst Support Related to Report
  • PDF Version of the Report
  • Complimentary Excel Data Set
  • Free Analyst Hours - 50 Hours
  • Free 1 Month Subscription to Trade Data Base
  • 1 Month Subscription to Price Database (Chemicals only)
  • License Upgrade
  • Free Analyst Hours - 80 Hours
  • Power BI Dashboards

Enterprise Bundle

Number of Reports: 10

35%

tax inclusive*

  • 10 Reports Included
  • Life Time Acess
  • Analyst Support Related to Report
  • PDF Version of the Report
  • Complimentary Excel Data Set
  • Free Analyst Hours - 50 Hours
  • Free 1 Month Subscription to Trade Data Base
  • 1 Month Subscription to Price Database (Chemicals only)
  • License Upgrade
  • Power BI Dashboards
  • Free Analyst Hours - 100 Hours

How To Order

Our step-by-step guide will help you select, purchase, and access your reports swiftly, ensuring you get the information that drives your decisions, right when you need it.

Select License Type

Choose the right license for your needs and access rights.

Click on ‘Buy Now’

Add the report to your cart with one click and proceed to register.

Select Mode of Payment

Choose a payment option for a secure checkout. You will be redirected accordingly.

Strategic Solutions for Informed Decision-Making

Connect For More Information

Our expert team of analysts will offer full support and resolve any queries regarding the report, before and after the purchase.

Our expert team of analysts will offer full support and resolve any queries regarding the report, before and after the purchase.

We employ meticulous research methods, blending advanced analytics and expert insights to deliver accurate, actionable industry intelligence, staying ahead of competitors.

Our skilled analysts offer unparalleled competitive advantage with detailed insights on current and emerging markets, ensuring your strategic edge.

We offer an in-depth yet simplified presentation of industry insights and analysis to meet your specific requirements effectively.

We’re here to help answer any questions about our products and services.

Contact us

Our Offices


Australia

63 Fiona Drive, Tamworth, NSW

+61-448-061-727

India

C130 Sector 2 Noida, Uttar Pradesh 201301

+91-723-689-1189

Philippines

40th Floor, PBCom Tower, 6795 Ayala Avenue Cor V.A Rufino St. Makati City,1226.

+63-287-899-028, +63-967-048-3306

United Kingdom

6 Gardner Place, Becketts Close, Feltham TW14 0BX, Greater London

+44-753-713-2163

United States

30 North Gould Street, Sheridan, WY 82801

+1-415-325-5166

Vietnam

193/26/4 St.no.6, Ward Binh Hung Hoa, Binh Tan District, Ho Chi Minh City

+84-865-399-124

30 North Gould Street, Sheridan, WY 82801

+1-415-325-5166

63 Fiona Drive, Tamworth, NSW

+61-448-061-727

C130 Sector 2 Noida, Uttar Pradesh 201301

+91-723-689-1189

40th Floor, PBCom Tower, 6795 Ayala Avenue Cor V.A Rufino St. Makati City, 1226.

+63-287-899-028, +63-967-048-3306

6 Gardner Place, Becketts Close, Feltham TW14 0BX, Greater London

+44-753-713-2163

193/26/4 St.no.6, Ward Binh Hung Hoa, Binh Tan District, Ho Chi Minh City

+84-865-399-124