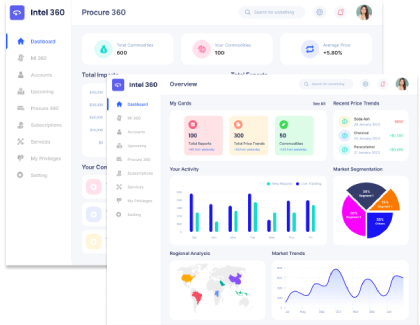
Consumer Insights
Uncover trends and behaviors shaping consumer choices today
Procurement Insights
Optimize your sourcing strategy with key market data
Industry Stats
Stay ahead with the latest trends and market analysis.
Italy carried the highest base-load price of the four markets in Q3 2026: EUR 150/MWh, up 44.2% from EUR 104/MWh in Q2. Gas-fired plants set the marginal price in Italy more often than anywhere else in the group, so the gas spike had the largest effect there. Worldwide, the average rose 44.1% to EUR 134/MWh from EUR 93/MWh, as a sharp rise in gas prices and low European storage lifted electricity costs across the region. What about Q4 2026? We expect a global average somewhere in the EUR 143-153/MWh range, with gas prices, storage levels and the onset of winter demand doing most of the work.
Austrian Power Financial refers to cash-settled base-load electricity futures tied to the Austrian day-ahead market, which hedge power delivered around the clock in a given month, quarter or year. Utilities, industrial buyers and traders use them to lock in costs or manage exposure, and the price reflects expectations for gas, coal, carbon, hydro and weather. Austria has a large hydropower fleet, which gives it a distinct seasonal profile with low-cost spring snowmelt power and expensive winter supply.
The Austrian market is closely coupled with Germany, and the two historically traded at a small spread, though the gap has widened during stress. Italy sits at the high end of the group because gas sets the marginal price for much of the year, and Hungary typically trades at a premium to Austria because of tighter regional supply. In 2026, disruption around the Strait of Hormuz, damaged Gulf energy infrastructure and impaired Qatari LNG deliveries have pushed gas prices sharply higher, and European gas storage is filled to well below its normal level for the season.
Prices should stay high and trend higher through the rest of 2026. European gas storage entered autumn well below normal, replacement LNG is expensive, and colder weather is forecast for the coming months. Forward contracts for 2027 trade well below spot, suggesting the market expects some relief, but the path depends heavily on whether tensions around the Strait ease. For reference, the Q3 2026 global average of EUR 134/MWh compares with EUR 104/MWh a year earlier, an increase of 28.8%.
The balance of risks for Q4 tilts upward. What could push prices higher? A further escalation in the Gulf, longer outages at Norwegian gas facilities or a cold early winter would lift prices quickly. What could pull them lower? A diplomatic breakthrough that reopens normal tanker routes, mild weather or a strong inflow of LNG cargoes would bring prices down sharply.
| Region | 2026 Price Range (EUR/MWh) | Outlook |
| Global Average | 143 - 153 | Low gas storage and the start of winter sustain higher prices |
| Austria | 140 - 150 | Gas prices and hydro availability set Austrian base-load prices |
| Germany | 115 - 124 | Closely coupled with Austria but with a lower gas share |
| Italy | 160 - 172 | Gas-fired marginal pricing keeps Italy at a premium |
| Hungary | 154 - 166 | Regional tightness and import dependence sustain a premium |
Prices in Austria firmed 52.3% in Q3 2026 to EUR 131/MWh, compared with EUR 86/MWh in Q2. Austrian base-load prices rose sharply as gas prices surged and low summer hydro output coincided with rising demand from industry. Year on year, the average is 33.7% higher, against EUR 98/MWh in Q3 2025. This places Austria 2.2% below the four-market average of EUR 134/MWh for Q3 2026.
Why did the price of Austrian Power Financial change in Q3 2026 in Austria?
Austria saw the biggest increase among the four markets. The gas price spike carried into electricity, hydro output dropped after the spring melt, and industrial demand held firm, leaving little to offset the cost pressure. Since the end of 2025, the price in Austria has risen 4.8%, from EUR 125/MWh to EUR 131/MWh, while the global average has risen 3.9%.
Germany recorded a 31.7% gain in Q3 2026, with the average reaching EUR 108/MWh against EUR 82/MWh in Q2. German prices rose less than Austrian ones as stronger renewable output and a lower share of gas-fired generation cushioned the increase. The current level is 16.1% above the Q3 2025 average of EUR 93/MWh. Against the four-market average of EUR 134/MWh, Germany stood 19.4% below in the quarter.
Why did the price of Austrian Power Financial change in Q3 2026 in Germany?
Germany rose, though by less than Austria. A larger share of wind and solar output cushioned the gas effect, and the gap between the two markets widened to its largest in months. The cumulative 2026 change for Germany is a 9.2% decrease, from EUR 119/MWh to EUR 108/MWh, while the global average shows a 3.9% gain over the same period.
The Q3 2026 average for Italy stood at EUR 150/MWh, an increase of 44.2% on the EUR 104/MWh recorded in Q2. Italian prices climbed as gas-fired plants set the marginal price for most hours and gas costs rose sharply. A year earlier, in Q3 2025, the average stood at EUR 115/MWh, which makes the current price 30.4% higher. Italy finished Q3 2026 11.9% above the four-market average of EUR 134/MWh.
Why did the price of Austrian Power Financial change in Q3 2026 in Italy?
Italy rose sharply from an already high base. Gas sets the marginal price for most hours, so the surge in gas feeds directly into power, and there is little hydro to mute it. At EUR 150/MWh, Italy is 8.7% higher than in Q4 2025, when the average was EUR 138/MWh, and the global average is 3.9% higher over the same period.
Hungary registered a 43.6% increase in Q3 2026, taking the average to EUR 145/MWh from EUR 101/MWh in Q2. Hungarian prices rose in line with regional gas costs and tight cross-border capacity. Taking Q3 2025 as the base, at EUR 112/MWh, the latest quarter is 29.5% higher. The four markets averaged EUR 134/MWh in the quarter, so the price in Hungary was 8.2% higher.
Why did the price of Austrian Power Financial change in Q3 2026 in Hungary?
Hungary climbed in line with the broader region. Gas costs rose, import dependence meant domestic prices followed regional levels, and congested interconnectors limited relief from neighboring markets. This leaves Hungary 8.2% higher than at the end of 2025, when the average was EUR 134/MWh, while the global average is 3.9% higher over the same period.
Austria registered a 34.4% decrease in Q2 2026, taking the average to EUR 86/MWh from EUR 131/MWh in Q1. Austrian base-load prices fell sharply as spring snowmelt boosted hydro output and mild weather cut demand. Measured against Q2 2025, when the average stood at EUR 88/MWh, the market is 2.3% lower. The price in Austria was 7.5% below the group average of EUR 93/MWh in Q2 2026.
Why did the price of Austrian Power Financial change in Q2 2026 in Austria?
Austria posted one of the sharpest falls. Snowmelt filled reservoirs and run-of-river output peaked, so low-cost hydro power displaced gas-fired generation and base-load prices dropped well below the winter level. Coming after a 4.8% gain in Q1, the Q2 figure sits 2.3% below the EUR 88/MWh of Q2 2025. Part of the move was reversed in Q3, leaving the price at EUR 131/MWh.
Germany fell 33.9% to EUR 82/MWh in Q2 2026, from EUR 124/MWh in Q1. German prices dropped as solar output reached its peak and gas costs eased from the winter highs. In Q2 2025 the average was EUR 85/MWh, so the market is 3.5% lower on a yearly basis. The gap to the four-market average of EUR 93/MWh was 11.8% below for Germany.
Why did the price of Austrian Power Financial change in Q2 2026 in Germany?
Germany dropped in a similar pattern. Solar output peaked during the quarter, gas costs eased and demand was mild, which pushed base-load contracts to their lowest levels in over a year. The 4.2% gain in Q1 set the base, and Q2 finished 3.5% below the EUR 85/MWh recorded a year earlier. Q3 reversed some of the change, with the price at EUR 108/MWh.
In Q2 2026, the average price in Italy fell 28.3% to EUR 104/MWh, compared with EUR 145/MWh in Q1. Italian prices fell as lower gas costs and mild weather reduced demand, although Italy remained the most expensive market. This represents a 3.7% decrease on the EUR 108/MWh recorded in Q2 2025. Relative to the four-market average of EUR 93/MWh, Italy traded 11.8% above in Q2 2026.
Why did the price of Austrian Power Financial change in Q2 2026 in Italy?
Italy fell less than Austria and Germany because gas still sets prices for most hours. Mild weather and lower gas costs still reduced the average, but the country kept its premium. This followed a 5.1% gain in Q1 and left Italy 3.7% below its Q2 2025 average of EUR 108/MWh. The price then partly reversed in Q3, to EUR 150/MWh.
Hungary's average moved down 27.9% in Q2 2026, to EUR 101/MWh from EUR 140/MWh in Q1. Hungarian prices declined with the regional pattern, helped by stronger imports and low demand. The year-on-year change is a 1.0% increase, from EUR 100/MWh in Q2 2025. This places Hungary 8.6% above the four-market average of EUR 93/MWh for Q2 2026.
Why did the price of Austrian Power Financial change in Q2 2026 in Hungary?
Hungary declined with the broader region. Stronger imports from neighboring markets and mild spring demand pushed prices lower, though import dependence kept the premium over Austria. After a 4.5% gain in Q1, the quarter closed 1.0% above the EUR 100/MWh recorded in Q2 2025. Part of the move was reversed in Q3, leaving the price at EUR 145/MWh.
Austrian power financial prices have swung with the seasons and with gas markets, ending the window at a similar level to where it began. The global average moved from EUR 136/MWh in Q1 2025 to 95 in Q2, 104 in Q3 and 129 in Q4, then 135 in Q1 2026, 93 in Q2 and 134 in Q3, a net decline of roughly 1.5% across the window. Winter gas costs lifted the first and fourth quarters, spring hydro and solar pulled the second quarter down, and the gas spike in the third quarter reversed the decline.
| Quarter | Price (EUR/MWh) | QoQ Change | Direction |
| Q3 2026 | 134 | +44.1% | ↑ Rising |
| Q2 2026 | 93 | -31.1% | ↓ Falling |
| Q1 2026 | 135 | +4.7% | ↑ Rising |
| Q4 2025 | 129 | +24.0% | ↑ Rising |
| Q3 2025 | 104 | - | - Stable |
| Q4 2026 | In Progress | - | - In Progress |
2025 was a year of seasonal swings for Austrian power financial prices, with a strong winter, a soft summer and a recovery into the final quarter. Starting near EUR 136/MWh in Q1, the global average finished the year at 129 in Q4, a decline of about 5.1%. Gas prices and hydro availability drove most of the movement, while carbon costs and weather added smaller effects.
In Austria, prices moved from about EUR 134/MWh in Q1 2025 to EUR 125/MWh by Q4, down roughly 6.7%. Austrian prices fell from a high winter start to a summer low, then recovered in the final quarter as gas costs and heating demand rose. The latest quarter places Austria at EUR 131/MWh, which is 4.8% above the level at which 2025 ended.
In Germany, prices moved from about EUR 128/MWh in Q1 2025 to EUR 119/MWh by Q4, down roughly 7.0%. German prices followed a similar path, easing from the winter peak as renewable output increased and recovering toward year-end. Since the 2025 close of EUR 119/MWh, the price in Germany has moved down 9.2%, reaching EUR 108/MWh in Q3 2026.
In Italy, prices moved from about EUR 143/MWh in Q1 2025 to EUR 138/MWh by Q4, down roughly 3.5%. Italian prices declined the least among the four markets, since gas remained the marginal fuel throughout the year and kept the premium intact. At EUR 150/MWh in Q3 2026, Italy stands 8.7% above its Q4 2025 close.
In Hungary, prices moved from about EUR 141/MWh in Q1 2025 to EUR 134/MWh by Q4, down roughly 5.0%. Hungarian prices softened through the year as regional supply improved, though import dependence kept them above Austrian levels. The Q4 2025 close of EUR 134/MWh compares with EUR 145/MWh in Q3 2026, an 8.2% increase.
Expert Market Research: Your Source for Real-Time Austrian Power Financial Price Intelligence
We keep a continuous eye on Austrian power financial prices across the markets that trade against them, tracing causation through gas and carbon prices, hydro and renewable output, storage levels, weather and industrial demand. Our forecasts draw on forward curves, fuel economics, storage and interconnector data and geopolitical risk across all reporting regions, so subscribers see why a price moved and not just that it did. Need pricing data, bespoke market analysis, or procurement advisory? Reach out to our team.


Upto 15% Off
USD
$799 $699


*While we strive to always give you current and accurate information, the numbers depicted on the website are indicative and may differ from the actual numbers in the main report. At Expert Market Research, we aim to bring you the latest insights and trends in the market. Using our analyses and forecasts, stakeholders can understand the market dynamics, navigate challenges, and capitalize on opportunities to make data-driven strategic decisions.*
Hedging electricity costs for utilities, industrial buyers and traders, locking in base-load power for a month, quarter or year.
In Q3 2026, it averaged EUR 131/MWh in Austria, EUR 108/MWh in Germany, EUR 150/MWh in Italy, and EUR 145/MWh in Hungary. Italy was the priciest market.
The global average went from EUR 129/MWh in Q4 2025 to 135 in Q1, 93 in Q2 and 134 in Q3, up 3.9% overall. A Q2 slump on spring hydro and solar was reversed by a gas-driven increase in Q3.
Gas prices surged on Gulf disruption and low European storage, and base-load power followed in all four markets.
We expect a global average somewhere in the EUR 143-153/MWh range. Low gas storage and the start of winter demand support higher prices through year-end.
Italy sits at the top and Germany at the bottom. Italy's gas-fired marginal pricing lifts it, while Germany's larger renewable share keeps it below Austria.
Monthly. Need something more current? The Expert Market Research team is available directly.
Gas and carbon prices, hydro output, storage levels, weather and geopolitical events drive the volatility.
Austria's hydro fleet and coupling with Germany anchor the market, with Italy and Hungary as import-dependent premium zones.
Layer hedges across several months, use quarterly strips ahead of winter and review exposure when gas storage data changes.
One Year Subscription
One Year Subscription
USD 799
USD 699
tax inclusive*
*Please note that the prices mentioned below are starting prices for each bundle type. Kindly contact our team for further details.*
Flash Bundle
Small Business Bundle
Growth Bundle
Enterprise Bundle
*Please note that the prices mentioned below are starting prices for each bundle type. Kindly contact our team for further details.*
Flash Bundle
Number of Reports: 3
20%
tax inclusive*
Small Business Bundle
Number of Reports: 5
25%
tax inclusive*
Growth Bundle
Number of Reports: 8
30%
tax inclusive*
Enterprise Bundle
Number of Reports: 10
35%
tax inclusive*
How To Order

Select License Type
Choose the right license for your needs and access rights.

Click on ‘Buy Now’
Add the report to your cart with one click and proceed to register.

Select Mode of Payment
Choose a payment option for a secure checkout. You will be redirected accordingly.
Strategic Solutions for Informed Decision-Making
Gain insights to stay ahead and seize opportunities.
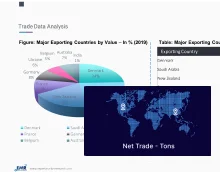
Get insights & trends for a competitive edge.
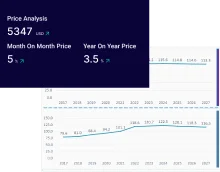
Track prices with detailed trend reports.

Analyse trade data for supply chain insights.
Leverage cost reports for smart savings
Enhance supply chain with partnerships.
Connect For More Information
Our expert team of analysts will offer full support and resolve any queries regarding the report, before and after the purchase.
Our expert team of analysts will offer full support and resolve any queries regarding the report, before and after the purchase.
We employ meticulous research methods, blending advanced analytics and expert insights to deliver accurate, actionable industry intelligence, staying ahead of competitors.
Our skilled analysts offer unparalleled competitive advantage with detailed insights on current and emerging markets, ensuring your strategic edge.
We offer an in-depth yet simplified presentation of industry insights and analysis to meet your specific requirements effectively.