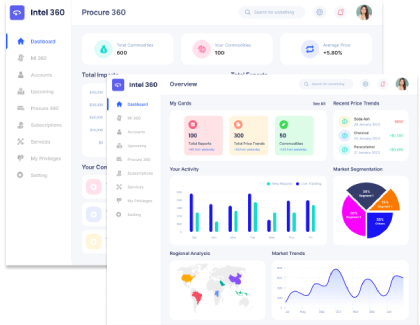
Consumer Insights
Uncover trends and behaviors shaping consumer choices today
Procurement Insights
Optimize your sourcing strategy with key market data
Industry Stats
Stay ahead with the latest trends and market analysis.
Bulgarian day-ahead baseload averaged USD 163.56/MWh in Q3 2026, up 43.9% from USD 113.68/MWh in Q2. Hungary was the dearest of the four markets at USD 183.28/MWh, because it depends on evening imports. Worldwide, the four-market average rose 45.1% to USD 168.78/MWh from USD 116.29/MWh, mostly because hot weather, low hydro output and gas-fired plants setting the evening price lifted prices, and in the last full week of September the Bulgarian average reached about USD 211 per MWh. What about Q4 2026? We expect a global average somewhere in the USD 167.63-196.79/MWh range, with gas prices, winter demand and hydro conditions doing most of the work.
Bulgarian power is baseload electricity delivered in the Bulgarian bidding zone and traded on the day-ahead market. Prices are set hour by hour and reflect the cost of gas, coal and carbon, the output of the nuclear plant and the hydro and solar fleets, and the flow of power to and from neighbouring markets. Prices here are converted from euros at about 1.16 dollars to the euro.
Bulgaria is a net exporter of power in most hours, with nuclear and coal providing the base and solar growing fast, and it is coupled to Romania, Greece, Serbia and North Macedonia. Prices move with the wider south-eastern European market. Demand peaks in winter for heating and in summer for cooling, and gas prices stayed high after the Middle East supply shock earlier in 2026.
Prices should rise through the rest of 2026. Winter heating demand lifts consumption, solar output falls, and gas still sets the price in the evening hours. Low hydro reserves leave the region with less cheap power to draw on. Year on year, the four-market average has moved from USD 120.93/MWh to USD 168.78/MWh, an increase of 39.6%.
For Q4, the risks are weighted toward higher prices. What could push prices higher? A cold start to winter, a nuclear outage or another gas supply shock would lift prices. What could pull them lower? Mild weather, strong wind and solar output or falling gas prices would lower prices.
| Region | 2026 Price Range (USD/MWh) | Outlook |
| Global Average | 167.63 - 196.79 | Winter demand and gas costs lift baseload |
| Bulgaria | 162.51 - 190.77 | Winter demand and gas costs lift baseload |
| Romania | 170.58 - 200.24 | Low hydro and gas-fired supply support prices |
| Hungary | 180.42 - 211.80 | Import dependence keeps prices highest |
| Greece | 157.03 - 184.35 | Solar keeps prices lowest but gas sets the evening peak |
In Q3 2026, the average price in Bulgaria firmed 43.9% to USD 163.56/MWh, compared with USD 113.68/MWh in Q2. Prices rose as hot weather lifted cooling demand, gas-fired plants set the price after sunset and exports to neighbouring markets stayed strong. Compared with Q3 2025, when Bulgaria averaged USD 120.64/MWh, the current price is 35.6% higher. The gap to the four-market average of USD 168.78/MWh was 3.1% below for Bulgaria.
Why did the price of Bulgarian Power change in Q3 2026 in Bulgaria?
Bulgaria rose. Hot weather lifted cooling demand, gas-fired plants set the price after sunset, and exports to neighbouring markets stayed strong. At USD 163.56/MWh, Bulgaria is 21.6% higher than in Q4 2025, when the average was USD 134.56/MWh, and the global average is 24.4% higher over the same period.
Romania's average gained 48.0% in Q3 2026, to USD 171.68/MWh from USD 116.00/MWh in Q2. Prices rose as a dry summer cut hydro output and Romania relied on gas-fired plants and imports in the evening hours. The current level is 43.7% above the Q3 2025 average of USD 119.48/MWh. Against the four-market average of USD 168.78/MWh, Romania stood 1.7% above in the quarter.
Why did the price of Bulgarian Power change in Q3 2026 in Romania?
Romania rose. A dry summer cut hydro output, gas-fired plants and imports covered the evening peak, and neighbouring prices climbed. Since Q4 2025 the price in Romania has gone up 28.7%, from USD 133.40/MWh to USD 171.68/MWh, while the global average has gone up 24.4%.
Prices in Hungary rose 46.3% in Q3 2026 to USD 183.28/MWh, against USD 125.28/MWh in Q2. Prices rose as Hungary, which relies on imports in the evening, paid more for gas-fired supply and neighbouring prices climbed. Compared with Q3 2025, when Hungary averaged USD 129.92/MWh, the current price is 41.1% higher. The gap to the four-market average of USD 168.78/MWh was 8.6% above for Hungary.
Why did the price of Bulgarian Power change in Q3 2026 in Hungary?
Hungary rose. The country relies on imports in the evening hours, gas-fired supply cost more, and prices in neighbouring markets climbed. Compared with the Q4 2025 average of USD 145.00/MWh, the price in Hungary has changed by +26.4%, against +24.4% for the global average.
Greece recorded a 42.1% gain in Q3 2026, with the average rising to USD 156.60/MWh from USD 110.20/MWh in Q2. Prices rose as gas-fired plants set the evening price and heat lifted air-conditioning demand, though solar kept midday prices low. The current level is 37.8% above the Q3 2025 average of USD 113.68/MWh. Against the four-market average of USD 168.78/MWh, Greece stood 7.2% below in the quarter.
Why did the price of Bulgarian Power change in Q3 2026 in Greece?
Greece rose. Gas-fired plants set the price in the evening, and heat lifted air-conditioning demand, though solar output kept midday prices low. At USD 156.60/MWh, Greece is 20.5% higher than in Q4 2025, when the average was USD 129.92/MWh, and the global average is 24.4% higher over the same period.
Prices in Bulgaria eased 21.0% in Q2 2026 to USD 113.68/MWh, against USD 143.84/MWh in Q1. Prices fell as spring hydro output and midday solar pushed baseload down and demand stayed mild. Compared with Q2 2025, when Bulgaria averaged USD 95.12/MWh, the current price is 19.5% higher. The gap to the four-market average of USD 116.29/MWh was 2.2% below for Bulgaria.
Why did the price of Bulgarian Power change in Q2 2026 in Bulgaria?
Bulgaria declined. Spring hydro and midday solar output pushed baseload down, and mild weather kept demand low. Q1 had brought a 6.9% gain, and by the end of Q2 the price was 19.5% above the Q2 2025 average of USD 95.12/MWh. Q3 then reversed the move, taking the price to USD 163.56/MWh.
Romania recorded a 20.6% decrease in Q2 2026, with the average falling to USD 116.00/MWh from USD 146.16/MWh in Q1. Prices fell as snowmelt lifted hydro output and solar covered the midday hours. The current level is 25.0% above the Q2 2025 average of USD 92.80/MWh. That puts Romania in line with the four-market average of USD 116.29/MWh.
Why did the price of Bulgarian Power change in Q2 2026 in Romania?
Romania declined. Snowmelt lifted hydro output, and solar covered the midday hours, which pulled baseload lower. After +9.6% in Q1, the quarter closed 25.0% above its year-earlier level of USD 92.80/MWh, and in Q3 the move was reversed, to USD 171.68/MWh.
In Q2 2026, the average price in Hungary slipped 20.0% to USD 125.28/MWh, compared with USD 156.60/MWh in Q1. Prices fell as midday solar output cut baseload and imports from neighbours were cheap. Compared with Q2 2025, when Hungary averaged USD 104.40/MWh, the current price is 20.0% higher. The gap to the four-market average of USD 116.29/MWh was 7.7% above for Hungary.
Why did the price of Bulgarian Power change in Q2 2026 in Hungary?
Hungary declined. Midday solar output cut baseload, and imports from neighbouring markets were cheap. Year on year the price is 20.0% higher than the USD 104.40/MWh of Q2 2025, following +8.0% in Q1. Q3 reversed the move, with the price at USD 183.28/MWh.
Greece's average fell 19.5% in Q2 2026, to USD 110.20/MWh from USD 136.88/MWh in Q1. Prices fell as solar output grew and midday curtailment pulled the daily average down. The current level is 21.8% above the Q2 2025 average of USD 90.48/MWh. Against the four-market average of USD 116.29/MWh, Greece stood 5.2% below in the quarter.
Why did the price of Bulgarian Power change in Q2 2026 in Greece?
Greece declined. Solar output grew, and curtailment at midday pulled the daily average down. Q1 had brought a 5.4% gain, and by the end of Q2 the price was 21.8% above the Q2 2025 average of USD 90.48/MWh. Q3 then reversed the move, taking the price to USD 156.60/MWh.
Bulgarian power prices followed a seasonal pattern across 2025 and 2026, with winter highs and low spring prices. The four-market average moved from USD 152.25/MWh in Q1 2025 to 95.70 in Q2, 120.93 in Q3, 135.72 in Q4, then 145.87 in Q1 2026, 116.29 in Q2 and 168.78 in Q3, a net gain of roughly 10.9% across the window. Gas prices and hydro output drove most of the swings, with solar pulling down the spring and summer midday hours.
| Quarter | Price (USD/MWh) | QoQ Change | Direction |
| Q3 2026 | 168.78 | +45.1% | ↑ Rising |
| Q2 2026 | 116.29 | -20.3% | ↓ Falling |
| Q1 2026 | 145.87 | +7.5% | ↑ Rising |
| Q4 2025 | 135.72 | +12.2% | ↑ Rising |
| Q3 2025 | 120.93 | +26.4% | ↑ Rising |
| Q4 2026 | In Progress | - | - In Progress |
2025 was a year of falling prices for Bulgarian power between a cold first quarter and a low second quarter, with a recovery in the second half. Starting near USD 152.25/MWh in Q1, the four-market average finished the year at 135.72 in Q4, a decline of about 10.9%. Gas costs, hydro output and growing solar capacity shaped the year.
In Bulgaria, prices moved from about USD 153.12/MWh in Q1 2025 to USD 134.56/MWh by Q4, down roughly 12.1%. Prices fell from a cold, gas-driven Q1 to a low in Q2, then rose again in the second half as solar output faded. Relative to the end of 2025, the price in Bulgaria is 21.6% higher at USD 163.56/MWh.
In Romania, prices moved from about USD 150.80/MWh in Q1 2025 to USD 133.40/MWh by Q4, down roughly 11.5%. Prices fell from a cold Q1 to a Q2 low, then recovered as hydro output dropped in the dry second half. Since the 2025 close of USD 133.40/MWh, the price in Romania has moved up 28.7%, reaching USD 171.68/MWh in Q3 2026.
In Hungary, prices moved from about USD 160.08/MWh in Q1 2025 to USD 145.00/MWh by Q4, down roughly 9.4%. Prices followed the regional pattern, falling to a Q2 low and then climbing, with a premium over its neighbours because it imports a large part of its power. Relative to the end of 2025, the price in Hungary is 26.4% higher at USD 183.28/MWh.
In Greece, prices moved from about USD 145.00/MWh in Q1 2025 to USD 129.92/MWh by Q4, down roughly 10.4%. Prices fell from Q1 to a Q2 low and then rose as demand recovered, though solar kept Greece the cheapest of the four. Since the 2025 close of USD 129.92/MWh, the price in Greece has moved up 20.5%, reaching USD 156.60/MWh in Q3 2026.
Expert Market Research: Your Source for Real-Time Bulgarian Power Price Intelligence
We follow Bulgarian power prices in the south-eastern European power market, and trace each move back to gas and carbon costs, hydro and nuclear output, solar and wind generation, cross-border flows and weather. Our forecasts draw on fuel costs, generation mix, interconnector flows and weather risk across all reporting regions, so subscribers see why a price moved and not just that it did. Need pricing data, bespoke market analysis, or procurement advisory? Reach out to our team.


Upto 15% Off
USD
$799 $699


*While we strive to always give you current and accurate information, the numbers depicted on the website are indicative and may differ from the actual numbers in the main report. At Expert Market Research, we aim to bring you the latest insights and trends in the market. Using our analyses and forecasts, stakeholders can understand the market dynamics, navigate challenges, and capitalize on opportunities to make data-driven strategic decisions.*
Baseload supply for industry, businesses and households, and a benchmark for hedging and forward contracts.
In Q3 2026, it averaged USD 163.56/MWh in Bulgaria, USD 171.68/MWh in Romania, USD 183.28/MWh in Hungary and USD 156.60/MWh in Greece. Hungary was the priciest market.
The global average went from USD 135.72/MWh in Q4 2025 to 145.87 in Q1, 116.29 in Q2 and 168.78 in Q3, up 24.4% overall. Prices rose in Q1, fell in Q2 on hydro and solar, and rose again in Q3.
Hot weather, low hydro output and gas-fired plants setting the evening price lifted prices.
We expect a global average somewhere in the USD 167.63-196.79/MWh range. Winter demand and gas costs point to a higher range.
Hungary sits at the top and Greece at the bottom. Hungary is dearest because it relies on imports, while Greece is cheapest because of solar output.
Monthly. Need something more current? The Expert Market Research team is available directly.
Gas and carbon prices, hydro output, solar and wind generation, cross-border flows and weather drive the volatility.
Bulgaria and Romania are exporters in most hours, while Hungary imports a large part of its power.
Hedge winter baseload early, mix fixed and index-linked contracts and watch gas prices and hydro levels.
One Year Subscription
One Year Subscription
USD 799
USD 699
tax inclusive*
*Please note that the prices mentioned below are starting prices for each bundle type. Kindly contact our team for further details.*
Flash Bundle
Small Business Bundle
Growth Bundle
Enterprise Bundle
*Please note that the prices mentioned below are starting prices for each bundle type. Kindly contact our team for further details.*
Flash Bundle
Number of Reports: 3
20%
tax inclusive*
Small Business Bundle
Number of Reports: 5
25%
tax inclusive*
Growth Bundle
Number of Reports: 8
30%
tax inclusive*
Enterprise Bundle
Number of Reports: 10
35%
tax inclusive*
How To Order

Select License Type
Choose the right license for your needs and access rights.

Click on ‘Buy Now’
Add the report to your cart with one click and proceed to register.

Select Mode of Payment
Choose a payment option for a secure checkout. You will be redirected accordingly.
Strategic Solutions for Informed Decision-Making
Gain insights to stay ahead and seize opportunities.
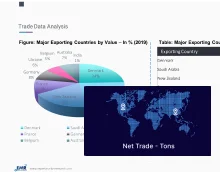
Get insights & trends for a competitive edge.
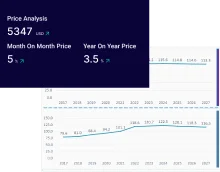
Track prices with detailed trend reports.

Analyse trade data for supply chain insights.

Leverage cost reports for smart savings
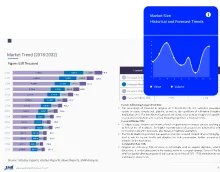
Enhance supply chain with partnerships.
Connect For More Information
Our expert team of analysts will offer full support and resolve any queries regarding the report, before and after the purchase.
Our expert team of analysts will offer full support and resolve any queries regarding the report, before and after the purchase.
We employ meticulous research methods, blending advanced analytics and expert insights to deliver accurate, actionable industry intelligence, staying ahead of competitors.
Our skilled analysts offer unparalleled competitive advantage with detailed insights on current and emerging markets, ensuring your strategic edge.
We offer an in-depth yet simplified presentation of industry insights and analysis to meet your specific requirements effectively.