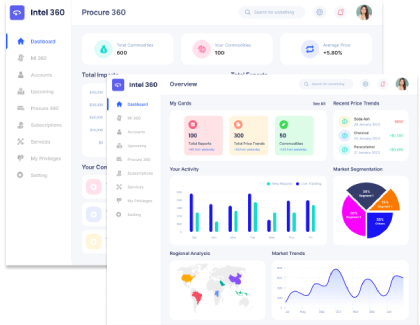
Consumer Insights
Uncover trends and behaviors shaping consumer choices today
Procurement Insights
Optimize your sourcing strategy with key market data
Industry Stats
Stay ahead with the latest trends and market analysis.
Finland paid the most for cobalt hydroxide in Q3 2026: USD 46,000/MT, down 19.3% from USD 57,000/MT in Q2. Delivered European prices carry freight, insurance and a premium for traceable feed, which keeps Finland above the other three markets. Worldwide, the average fell 21.3% to USD 41,000/MT from USD 52,125/MT, mostly because shipments from the DRC rebounded, downstream buyers held adequate stocks and payables compressed. What about Q4 2026? We expect a global average somewhere in the USD 35,940-42,190/MT range, with DRC export policy, Indonesian output and battery demand doing most of the work.
Cobalt hydroxide is the intermediate product of copper-cobalt mining, shipped to refiners that convert it into cobalt sulphate, cobalt metal and battery precursors. It is traded as a percentage payable of the cobalt metal price, and prices here are shown per tonne of contained cobalt. End uses include lithium-ion batteries, superalloys, catalysts and pigments.
The Democratic Republic of Congo supplies most of the world's hydroxide, Indonesia is a growing second source through mixed hydroxide precipitate, and China refines most of the material. Export quotas introduced by the DRC after its 2025 export halt tightened supply late in 2025 and early in 2026. By the end of Q3, the CIF Asia price was close to USD 17 per lb of cobalt, roughly USD 38,000 per tonne, and payables on mixed hydroxide had fallen to about two-thirds of the metal price.
Prices should drift lower again in Q4 before they steady. Shipments from the DRC are rising, buyers hold adequate stocks against a soft battery order book, and sellers have stopped trading below their asking levels, which leaves the market thin. Year on year, the global average has moved from USD 30,125/MT to USD 41,000/MT, an increase of 36.1%.
For Q4, the risks are weighted toward lower prices. What could push prices higher? A tighter DRC quota, stockpiling by Chinese buyers before the holidays or stronger battery demand would lift prices. What could pull them lower? Faster growth in DRC and Indonesian supply, further falls in payables or weak battery orders would lower prices.
| Region | 2026 Price Range (USD/MT) | Outlook |
| Global Average | 35,940 - 42,190 | Rising supply and soft battery orders |
| China | 37,145 - 43,605 | Weak buying and stalled trade pull prices down |
| DR Congo | 32,338 - 37,962 | Rising output and wider discounts push prices lower |
| Indonesia | 33,649 - 39,501 | Payables compression weighs on MHP-linked prices |
| Finland | 40,627 - 47,693 | Traceable feed commands a delivered premium |
In Q3 2026, the average price in China softened 21.3% to USD 42,500/MT, compared with USD 54,000/MT in Q2. Prices fell sharply as DRC shipments rebounded and refiners held adequate stocks against a soft battery order book. Compared with Q3 2025, when China averaged USD 31,000/MT, the current price is 37.1% higher. The gap to the four-market average of USD 41,000/MT was 3.7% above for China.
Why did the price of Cobalt Hydroxide change in Q3 2026 in China?
China fell sharply. DRC hydroxide arrivals jumped from May, refiners held adequate stocks, and trade stalled for stretches as sellers refused low bids. At USD 42,500/MT, China is 3.4% lower than in Q4 2025, when the average was USD 44,000/MT, and the global average is 3.5% lower over the same period.
DR Congo's average slipped 22.9% in Q3 2026, to USD 37,000/MT from USD 48,000/MT in Q2. Prices fell sharply as producers shipped more material and discounts to the Asian benchmark widened. The current level is 34.5% above the Q3 2025 average of USD 27,500/MT. Against the four-market average of USD 41,000/MT, DR Congo stood 9.8% below in the quarter.
Why did the price of Cobalt Hydroxide change in Q3 2026 in DR Congo?
DR Congo fell sharply. Producers shipped more material under the quota system, and discounts to the CIF Asia price widened. Since Q4 2025 the price in DR Congo has gone down 5.1%, from USD 39,000/MT to USD 37,000/MT, while the global average has gone down 3.5%.
Prices in Indonesia fell 22.2% in Q3 2026 to USD 38,500/MT, against USD 49,500/MT in Q2. Prices fell sharply as payables on mixed hydroxide precipitate compressed sharply. Compared with Q3 2025, when Indonesia averaged USD 28,500/MT, the current price is 35.1% higher. The gap to the four-market average of USD 41,000/MT was 6.1% below for Indonesia.
Why did the price of Cobalt Hydroxide change in Q3 2026 in Indonesia?
Indonesia fell sharply. Payables on mixed hydroxide precipitate compressed sharply as buyers argued that the earlier levels looked too high. Compared with the Q4 2025 average of USD 40,500/MT, the price in Indonesia has changed by -4.9%, against -3.5% for the global average.
Finland recorded a 19.3% decrease in Q3 2026, with the average falling to USD 46,000/MT from USD 57,000/MT in Q2. Prices fell sharply as European refiners paid less as the Asian benchmark fell. The current level is 37.3% above the Q3 2025 average of USD 33,500/MT. Against the four-market average of USD 41,000/MT, Finland stood 12.2% above in the quarter.
Why did the price of Cobalt Hydroxide change in Q3 2026 in Finland?
Finland fell sharply. European refiners paid less as the Asian benchmark fell, although a premium for traceable, responsibly sourced feed held. At USD 46,000/MT, Finland is 1.1% lower than in Q4 2025, when the average was USD 46,500/MT, and the global average is 3.5% lower over the same period.
Prices in China climbed 3.8% in Q2 2026 to USD 54,000/MT, against USD 52,000/MT in Q1. Prices rose as quota-limited supply kept hydroxide tight and refiners paid up. Compared with Q2 2025, when China averaged USD 23,000/MT, the current price is 134.8% higher. The gap to the four-market average of USD 52,125/MT was 3.6% above for China.
Why did the price of Cobalt Hydroxide change in Q2 2026 in China?
China rose. Quota-limited supply kept hydroxide tight, and refiners paid more to secure feed. Q1 had brought an 18.2% gain, and by the end of Q2 the price was 134.8% above the Q2 2025 average of USD 23,000/MT. Q3 then reversed the move, taking the price to USD 42,500/MT.
DR Congo recorded a 3.2% gain in Q2 2026, with the average rising to USD 48,000/MT from USD 46,500/MT in Q1. Prices rose as quota limits kept supply scarce and buyers accepted higher payables. The current level is 134.1% above the Q2 2025 average of USD 20,500/MT. Against the four-market average of USD 52,125/MT, DR Congo stood 7.9% below in the quarter.
Why did the price of Cobalt Hydroxide change in Q2 2026 in DR Congo?
DR Congo rose. Quota limits kept supply scarce, and buyers accepted higher payables to secure cargoes. After +19.2% in Q1, the quarter closed 134.1% above its year-earlier level of USD 20,500/MT, and in Q3 the move was reversed, to USD 37,000/MT.
In Q2 2026, the average price in Indonesia gained 3.1% to USD 49,500/MT, compared with USD 48,000/MT in Q1. Prices rose as demand for battery-grade feed stayed firm. Compared with Q2 2025, when Indonesia averaged USD 21,000/MT, the current price is 135.7% higher. The gap to the four-market average of USD 52,125/MT was 5.0% below for Indonesia.
Why did the price of Cobalt Hydroxide change in Q2 2026 in Indonesia?
Indonesia rose. Demand for battery-grade feed stayed firm, and new nickel-cobalt output was absorbed quickly. Year on year the price is 135.7% higher than the USD 21,000/MT of Q2 2025, following +18.5% in Q1. Q3 reversed the move, with the price at USD 38,500/MT.
Finland's average rose 4.6% in Q2 2026, to USD 57,000/MT from USD 54,500/MT in Q1. Prices rose as refiners competed for scarce feed and cobalt metal stayed expensive. The current level is 123.5% above the Q2 2025 average of USD 25,500/MT. Against the four-market average of USD 52,125/MT, Finland stood 9.4% above in the quarter.
Why did the price of Cobalt Hydroxide change in Q2 2026 in Finland?
Finland rose. Refiners competed for scarce feed, and cobalt metal prices stayed high. Q1 had brought a 17.2% gain, and by the end of Q2 the price was 123.5% above the Q2 2025 average of USD 25,500/MT. Q3 then reversed the move, taking the price to USD 46,000/MT.
Cobalt hydroxide prices rose sharply from mid-2025, peaked in the first half of 2026 and fell back in Q3. The global average moved from USD 23,500/MT in Q1 2025 to 22,500 in Q2, 30,125 in Q3, 42,500 in Q4, then 50,250 in Q1 2026, 52,125 in Q2 and 41,000 in Q3, a net gain of roughly 74.5% across the window. The DRC export halt and the quotas that followed tightened supply, while rising shipments cut prices in Q3.
| Quarter | Price (USD/MT) | QoQ Change | Direction |
| Q3 2026 | 41,000 | -21.3% | ↓ Falling |
| Q2 2026 | 52,125 | +3.7% | ↑ Rising |
| Q1 2026 | 50,250 | +18.2% | ↑ Rising |
| Q4 2025 | 42,500 | +41.1% | ↑ Rising |
| Q3 2025 | 30,125 | +33.9% | ↑ Rising |
| Q4 2026 | In Progress | - | - In Progress |
2025 was a year of reversal for cobalt hydroxide. Prices dipped in Q2, then rose sharply in Q3 and Q4 after the DRC halted and then restricted exports. Starting near USD 23,500/MT in Q1, the global average finished the year at 42,500 in Q4, a gain of about 80.9%. Export policy and refinery demand set the direction.
In China, prices moved from about USD 24,000/MT in Q1 2025 to USD 44,000/MT by Q4, up roughly 83.3%. Prices dipped in Q2, then rose sharply in Q3 and Q4 as the DRC export halt and quotas tightened supply. Relative to the end of 2025, the price in China is 3.4% lower at USD 42,500/MT.
In DR Congo, prices moved from about USD 21,500/MT in Q1 2025 to USD 39,000/MT by Q4, up roughly 81.4%. Prices dipped in Q2, then rose sharply in Q3 and Q4 as the DRC export halt and quotas tightened supply. Since the 2025 close of USD 39,000/MT, the price in DR Congo has moved down 5.1%, reaching USD 37,000/MT in Q3 2026.
In Indonesia, prices moved from about USD 22,000/MT in Q1 2025 to USD 40,500/MT by Q4, up roughly 84.1%. Prices dipped in Q2, then rose sharply in Q3 and Q4 as the DRC export halt and quotas tightened supply. Relative to the end of 2025, the price in Indonesia is 4.9% lower at USD 38,500/MT.
In Finland, prices moved from about USD 26,500/MT in Q1 2025 to USD 46,500/MT by Q4, up roughly 75.5%. Prices dipped in Q2, then rose sharply in Q3 and Q4 as the DRC export halt and quotas tightened supply. Since the 2025 close of USD 46,500/MT, the price in Finland has moved down 1.1%, reaching USD 46,000/MT in Q3 2026.
Expert Market Research: Your Source for Real-Time Cobalt Hydroxide Price Intelligence
We follow cobalt hydroxide prices in the main producing and refining countries, and trace each move back to DRC export policy, Indonesian output, payables, refinery demand and battery demand. Our forecasts draw on export policy, mine output, refinery demand and inventory levels across all reporting regions, so subscribers see why a price moved and not just that it did. Need pricing data, bespoke market analysis, or procurement advisory? Reach out to our team.


Upto 15% Off
USD
$799 $699


*While we strive to always give you current and accurate information, the numbers depicted on the website are indicative and may differ from the actual numbers in the main report. At Expert Market Research, we aim to bring you the latest insights and trends in the market. Using our analyses and forecasts, stakeholders can understand the market dynamics, navigate challenges, and capitalize on opportunities to make data-driven strategic decisions.*
Refining into cobalt sulphate, cobalt metal and battery precursors, used in batteries, superalloys, catalysts and pigments.
In Q3 2026, it averaged USD 42,500/MT in China, USD 37,000/MT in DR Congo, USD 38,500/MT in Indonesia and USD 46,000/MT in Finland. Finland was the priciest market.
The global average went from USD 42,500/MT in Q4 2025 to 50,250 in Q1, 52,125 in Q2 and 41,000 in Q3, down 3.5% overall. Prices rose in Q1 and Q2, then fell in Q3.
Shipments from the DRC rebounded, buyers held adequate stocks, and payables compressed.
We expect a global average somewhere in the USD 35,940-42,190/MT range. Rising supply and soft battery orders point to a lower range.
Finland sits at the top and DR Congo at the bottom. Finland is dearest because of delivered, traceable feed, while DR Congo is cheapest at the mine-gate level.
Monthly. Need something more current? The Expert Market Research team is available directly.
DRC export policy, Indonesian supply, battery demand, payables and stockpiling drive the volatility.
The DR Congo leads supply, Indonesia is growing, and China refines most of the material.
Link contracts to the cobalt metal price with a payable, diversify across the DRC and Indonesia and avoid buying into stockpiling spikes.
One Year Subscription
One Year Subscription
USD 799
USD 699
tax inclusive*
*Please note that the prices mentioned below are starting prices for each bundle type. Kindly contact our team for further details.*
Flash Bundle
Small Business Bundle
Growth Bundle
Enterprise Bundle
*Please note that the prices mentioned below are starting prices for each bundle type. Kindly contact our team for further details.*
Flash Bundle
Number of Reports: 3
20%
tax inclusive*
Small Business Bundle
Number of Reports: 5
25%
tax inclusive*
Growth Bundle
Number of Reports: 8
30%
tax inclusive*
Enterprise Bundle
Number of Reports: 10
35%
tax inclusive*
How To Order

Select License Type
Choose the right license for your needs and access rights.

Click on ‘Buy Now’
Add the report to your cart with one click and proceed to register.

Select Mode of Payment
Choose a payment option for a secure checkout. You will be redirected accordingly.
Strategic Solutions for Informed Decision-Making
Gain insights to stay ahead and seize opportunities.
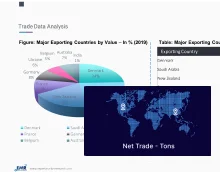
Get insights & trends for a competitive edge.
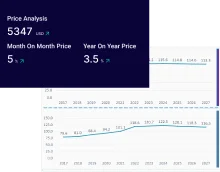
Track prices with detailed trend reports.
Analyse trade data for supply chain insights.
Leverage cost reports for smart savings
Enhance supply chain with partnerships.
Connect For More Information
Our expert team of analysts will offer full support and resolve any queries regarding the report, before and after the purchase.
Our expert team of analysts will offer full support and resolve any queries regarding the report, before and after the purchase.
We employ meticulous research methods, blending advanced analytics and expert insights to deliver accurate, actionable industry intelligence, staying ahead of competitors.
Our skilled analysts offer unparalleled competitive advantage with detailed insights on current and emerging markets, ensuring your strategic edge.
We offer an in-depth yet simplified presentation of industry insights and analysis to meet your specific requirements effectively.