

Consumer Insights
Uncover trends and behaviors shaping consumer choices today
Procurement Insights
Optimize your sourcing strategy with key market data
Industry Stats
Stay ahead with the latest trends and market analysis.
The Asia Pacific ammonia market was valued at USD 30.08 Billion in 2025. The market is expected to grow at a CAGR of 1.50% during the forecast period of 2026-2035 to reach a value of USD 34.91 Billion by 2035. Strong fertilizer demand from the agricultural sector is driving growth in the market.
Compound Annual Growth Rate
1.5%
Value in USD Billion
2026-2035
It is expected that rising population with increasing affluence would promote production of ammonia, boosting the Asia Pacific ammonia market; further, governments across the globe are making efforts to decrease emissions from energy systems to net zero.
In 2023, it was reported that Jurong Port, Mitsubishi Heavy Industries Asia Pacific and JERA Asia would collaborate to Come Together to look into setting up an ammonia direct combustion power plant; a Memorandum of Understanding (MoU) was concluded to investigate the setting up of a hundred percent ammonia direct combustion power plant on Jurong Island, Singapore. Earlier, the Singapore government elevated its climate ambition to attain net-zero CO2 emissions by or close to 2050. The project was in line with national decarbonization objectives, and it aimed to use ammonia as a fuel to produce carbon-free electricity, and the key bunkering fuel in future to decarbonize the maritime sector. Comprising nitrogen and hydrogen, ammonia is a very efficient hydrogen carrier and is capable of being directly combusted as a carbon neutral fuel, contributing to the setting up of a robust hydrogen value chain.
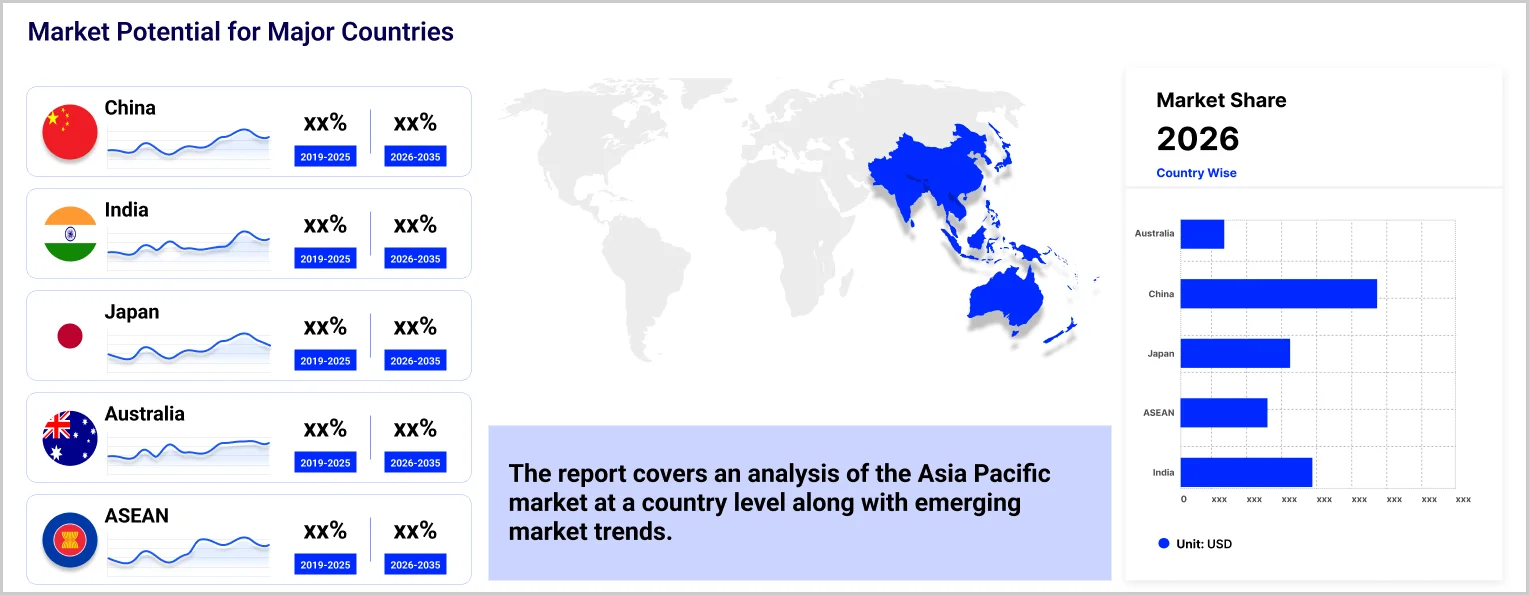
Population and economic growth have been driving factors of global nitrogen demand, and Asia Pacific is expected to lead global ammonia production. Asia Pacific is a significant producer of ammonia, China being a major producer. With increasing industrial activity, India is expected to be a key player.
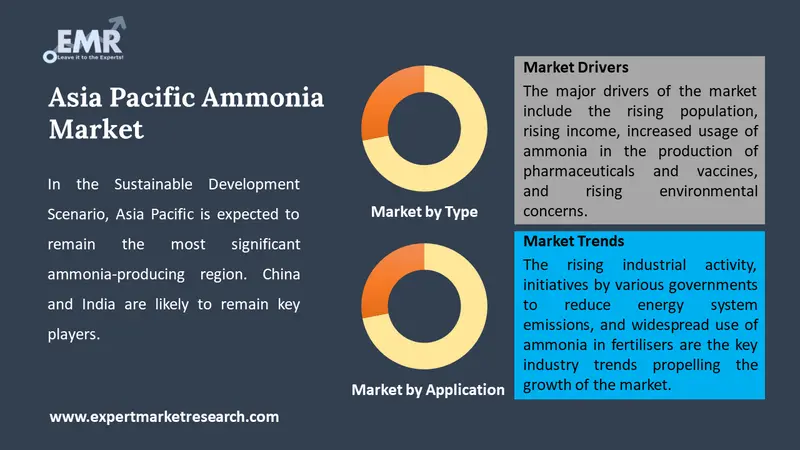
In the Sustainable Development Scenario, Asia Pacific is expected to remain the most significant ammonia-producing region. China and India are likely to remain key players.
Rising environmental concerns and stringent compliances to decrease greenhouse gas emissions are expected to promote adoption of green ammonia technology among ammonia manufacturers. The valorization of green ammonia from sustainable energy sources is leading the way towards safer agricultural products and cleaner industrial chemical production. These factors are likely to boost the Asia Pacific ammonia market.
In 2022, it was reported that Keppel Infrastructure and Greenko would explore ammonia production in India, driven by 1.3 GW of solar, wind and pumped hydro generating capacity. The project was expected to support the Indian government’s objective to produce five million tonnes of green hydrogen every year by 2030. The manufactured ammonia would be directed to demand for low carbon energy in Singapore and India, and could also be employed as bunker fuel.
It has been emphasized that green ammonia could help nations like India substantially decrease their fertiliser subsidy expenses and reduce reliance on liquefied natural gas (LNG) imports for fertiliser production.
The EMR’s report titled “Asia Pacific Ammonia Market Report and Forecast 2026-2035 offers a detailed analysis of the market based on the following segments:
By type, the market is divided into:
By application, the market is classified into:
By country, the market is segmented into:
Read more about this report - REQUEST FREE SAMPLE COPY IN PDF
The report offers an extensive assessment of major players in the Asia Pacific ammonia market; it evaluates their capability, observes latest occurrences such as mergers and acquisitions, capacity expansions, and plant turnarounds:
Upto 15% Off
USD
$2499 $2249
$3999 $3599
$4999 $4249
$5999 $5099


*While we strive to always give you current and accurate information, the numbers depicted on the website are indicative and may differ from the actual numbers in the main report. At Expert Market Research, we aim to bring you the latest insights and trends in the market. Using our analyses and forecasts, stakeholders can understand the market dynamics, navigate challenges, and capitalize on opportunities to make data-driven strategic decisions.*
The market is projected to grow at a CAGR of 1.50% between 2026 and 2035.
The major drivers of the market include the rising population, rising income, increased usage of ammonia in the production of pharmaceuticals and vaccines, and rising environmental concerns.
The rising industrial activity, initiatives by various governments to reduce energy system emissions, and widespread use of ammonia in fertilisers are the key industry trends propelling the growth of the market.
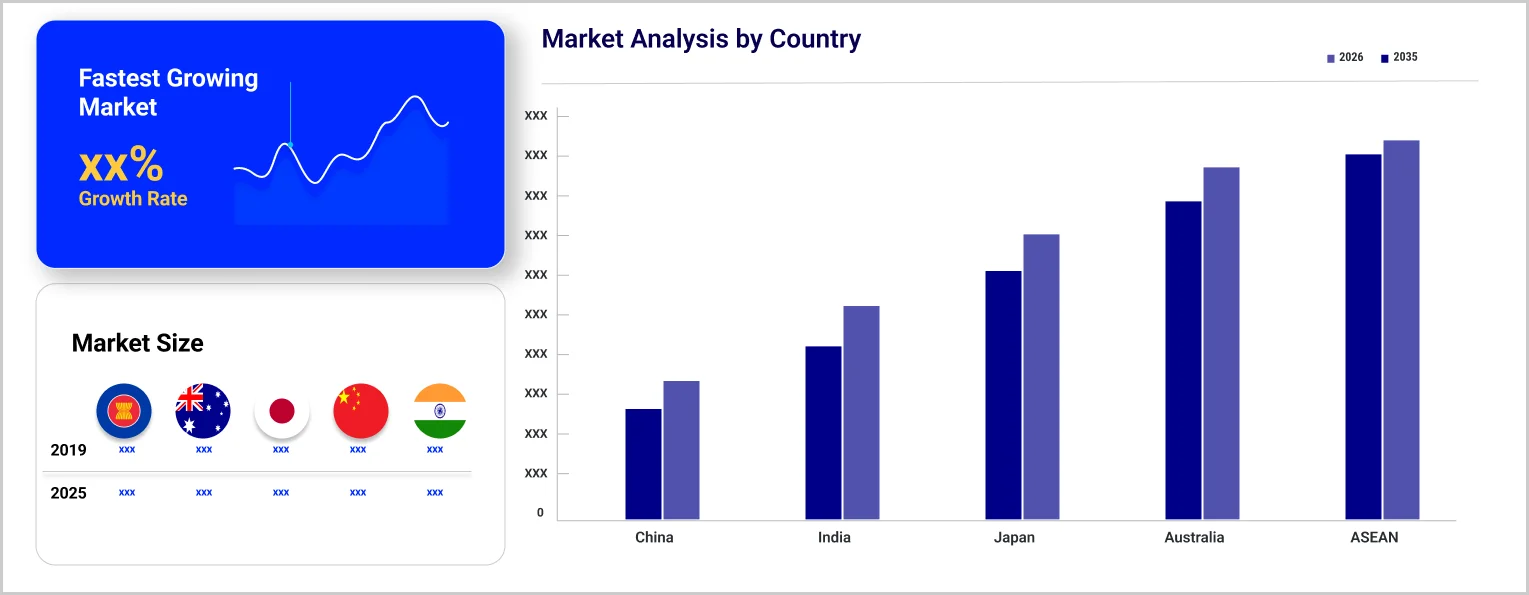
The major countries in the Asia Pacific ammonia market are China, Japan, India, ASEAN, and Australia, among others.
Based on type, the market can be bifurcated into gas and liquid.
On the basis of application, the market is segmented into fertilisers, textile, mining, pharmaceuticals, and refrigeration, among others.
The major players in the industry are Mitsubishi Gas Chemical Company, Inc., Yara International ASA, Mitsui & Co., BASF SE, Indian Farmers Fertiliser Cooperative Limited (IFFCO), Nutrien Ltd., Brunei Fertilizer Industries Sdn Bhd, and PT Pupuk Kalimantan Timur (PKT), among others.
Ammonia is an abundant source of nitrogen for plants and animals and can be found in water, soil, and air. The natural breakdown of manure and dead plants and animals is the primary source of most of the ammonia in the environment.
Nitrogen and hydrogen undergo a catalytic reaction at high pressure and temperature to create ammonia for commercial use.
Ammonia is corrosive and toxic. The nose, throat, and respiratory tract immediately burn when exposed to air with high ammonia concentrations. This may result in airway damage, bronchiolar and alveolar edema, and respiratory discomfort or failure.
In 2025, the Asia Pacific ammonia market reached an approximate value of USD 30.08 Billion.
The market is expected to witness moderate growth during the forecast period of 2026-2035 to reach a value of USD 34.91 Billion by 2035.
Explore our key highlights of the report and gain a concise overview of key findings, trends, and actionable insights that will empower your strategic decisions.
| REPORT FEATURES | DETAILS |
| Base Year | 2025 |
| Historical Period | 2019-2025 |
| Forecast Period | 2026-2035 |
| Scope of the Report |
Historical and Forecast Trends, Industry Drivers and Constraints, Historical and Forecast Market Analysis by Segment:
|
| Breakup by Type |
|
| Breakup by Application |
|
| Breakup by Region |
|
| Market Dynamics |
|
| Trade Data Analysis |
|
| Competitive Landscape |
|
| Companies Covered |
|
Datasheet
One User
USD 2,499
USD 2,249
tax inclusive*
Single User License
One User
USD 3,999
USD 3,599
tax inclusive*
Five User License
Five User
USD 4,999
USD 4,249
tax inclusive*
Corporate License
Unlimited Users
USD 5,999
USD 5,099
tax inclusive*
*Please note that the prices mentioned below are starting prices for each bundle type. Kindly contact our team for further details.*
Flash Bundle
Small Business Bundle
Growth Bundle
Enterprise Bundle
*Please note that the prices mentioned below are starting prices for each bundle type. Kindly contact our team for further details.*
Flash Bundle
Number of Reports: 3
20%
tax inclusive*
Small Business Bundle
Number of Reports: 5
25%
tax inclusive*
Growth Bundle
Number of Reports: 8
30%
tax inclusive*
Enterprise Bundle
Number of Reports: 10
35%
tax inclusive*
How To Order

Select License Type
Choose the right license for your needs and access rights.

Click on ‘Buy Now’
Add the report to your cart with one click and proceed to register.

Select Mode of Payment
Choose a payment option for a secure checkout. You will be redirected accordingly.
Strategic Solutions for Informed Decision-Making
Gain insights to stay ahead and seize opportunities.

Get insights & trends for a competitive edge.

Track prices with detailed trend reports.

Analyse trade data for supply chain insights.

Leverage cost reports for smart savings

Enhance supply chain with partnerships.

Connect For More Information
Our expert team of analysts will offer full support and resolve any queries regarding the report, before and after the purchase.
Our expert team of analysts will offer full support and resolve any queries regarding the report, before and after the purchase.
We employ meticulous research methods, blending advanced analytics and expert insights to deliver accurate, actionable industry intelligence, staying ahead of competitors.
Our skilled analysts offer unparalleled competitive advantage with detailed insights on current and emerging markets, ensuring your strategic edge.
We offer an in-depth yet simplified presentation of industry insights and analysis to meet your specific requirements effectively.


