

Consumer Insights
Uncover trends and behaviors shaping consumer choices today
Procurement Insights
Optimize your sourcing strategy with key market data
Industry Stats
Stay ahead with the latest trends and market analysis.
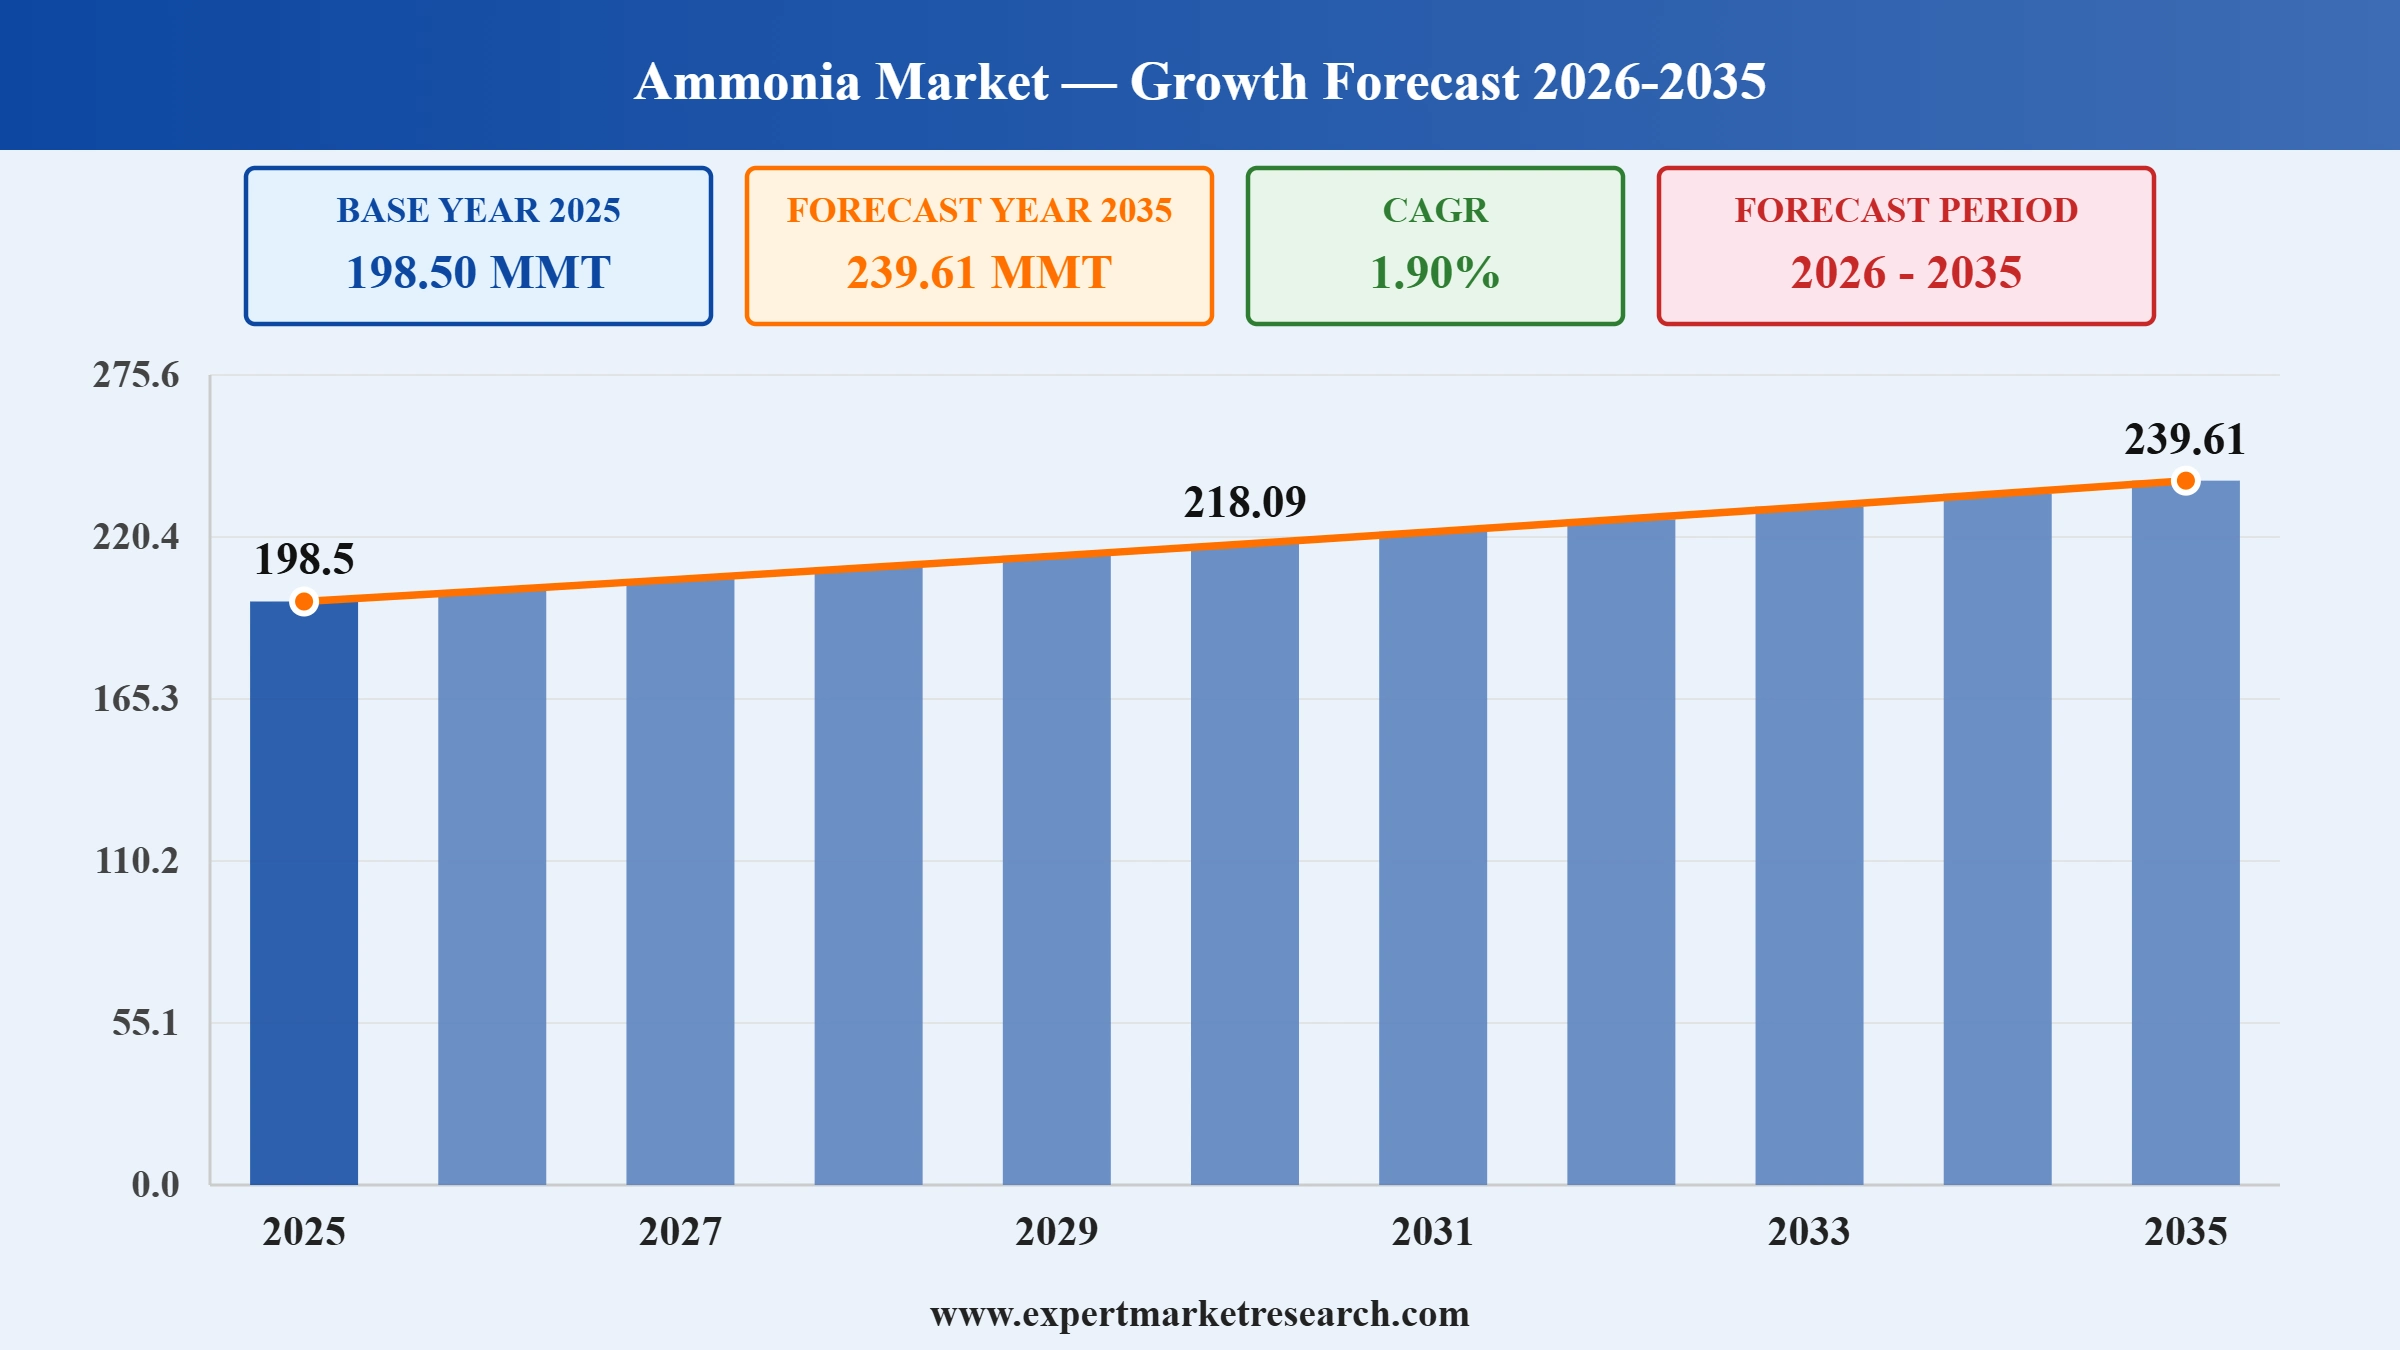
The ammonia market attained a volume of 198.50 MMT in 2025 and is projected to expand at a CAGR of 1.90% through 2035. The market is further expected to achieve a volume of 239.61 MMT by 2035. Growing ammonia bunkering facilities and international hydrogen trade corridors are driving the uptake by motivating manufacturers to increase production of low-carbon ammonia through establishing long-term agreements with industrial and shipping consumers.
The ammonia market observes growing investments in the development of new ammonia cracking solutions which can aid in hydrogen extraction at consumer sites, hence making ammonia an effective hydrogen carrier. The installation of modular green ammonia manufacturing plants in areas with renewable power sources is also leading to greater operational flexibility, hence reduced need for transport, offering new business prospects to technology suppliers and industry consumers.
One of the key changes that is occurring within the ammonia market is the fast-paced commercialization of low-carbon ammonia through collaborations with industry partners. In September 2025, Yara Clean Ammonia entered into long-term contracts to supply low emission ammonia in projects relating to maritime fuel and power generation in Europe and Asia, adding to its clean energy portfolio. This shift in the market is being driven by increased investments in low emission ammonia production, with an annual capacity for such production amounting to more than 50 million tons per year, according to the International Energy Agency.
The ammonia market is moving away from its traditional fertilizer usage into new energy transition markets, which involve the use of ammonia as a carrier of hydrogen, a maritime fuel source, and a medium for decarbonizing industrial operations. For example, in August 2026, Amon Maritime secured USD 121.8 million financing for two ammonia-fuelled vessels, advancing zero-emission shipping and maritime decarbonization. Companies that produce ammonia are investing in facilities that will allow them to manufacture both blue and green ammonia alongside technologies for carbon capture, renewable-powered electrolysis, and storage.
Read more about this report - REQUEST FREE SAMPLE COPY IN PDF
Jakson Green Odisha green ammonia project received pre-certification of the EU RFNBO standards, which will facilitate renewable compliance and boost export capability prior to full-scale commercialization. Companies can therefore engage in investment in certified green ammonia projects for the European market demanding renewable fuel compliance, following such trends in the ammonia market.
Amogy and 2G managed to demonstrate an ammonia-powered generation system allowing for carbon-free onsite generation of power via ammonia cracking technology and fuel cells. Technology companies can therefore create decentralized ammonia-to-power systems for industrial and off-the-grid power production facilities.
Yara and Air Products completed their global marketing deals regarding NEOM Green Ammonia, which will fast-track the global distribution and commercialization of clean fuels. Business enterprises can forge strategic partnerships that provide opportunities for distribution, storage, and logistics of green ammonia to aid growing clean energy markets around the globe.
Air Liquide launched its industrial-scale ammonia cracking technology that enables ammonia conversion to hydrogen, thus helping speed up low-carbon industries and mobility operations. Organizations can capitalize on ammonia to hydrogen conversion technologies, capitalizing on such advancements in the ammonia market.
The rise of low-carbon ammonia is acting as a catalyst for the growth of the ammonia market since government agencies and end-use customers seek to achieve their decarbonization goals. Manufacturers are investing in blue ammonia through carbon capture and renewable ammonia that uses renewable hydrogen. For example, in July 2026, Envision delivered low-carbon ammonia environmental attribute certificates to PepsiCo APAC, advancing fertilizer decarbonization, and sustainable agricultural supply chains. In addition, the Japanese government is advocating for the co-firing of ammonia through its Green Transformation strategy while Germany is importing hydrogen under the National Hydrogen Strategy. Such initiatives are helping the EPC contractors, electrolyzers, and technology licensors to increase production capabilities and create different business opportunities for growth.
The shipping industry is making a case for the adoption of ammonia fuel as a zero-carbon marine fuel to encourage producers to make specialized bunkering facilities and secure long-term supply arrangements. In November 2024, MAN Energy Solutions advanced four-stroke ammonia engine development, accelerating carbon-free marine propulsion, fuel efficiency, and maritime decarbonization initiatives. Following such trends in the ammonia market, in April 2026, LOTTE Fine Chemical commercialized the world's first ammonia marine fuel supply, advancing green shipping, clean energy, and maritime decarbonization.
The ammonia market witnesses an increasing tendency towards using ammonia as the best option for transporting hydrogen over long distances due to the existing infrastructure related to its storage and transportation. Countries that have a sufficient amount of renewable energy resources are now building their capacity to export ammonia in order to satisfy global demand for hydrogen. In July 2026, Trinasolar supplied advanced solar modules powering New South Wales' first green hydrogen and low-carbon ammonia production facility efficiently. Australia's Hydrogen Headstart Program is developing large-scale renewable hydrogen projects, and Saudi Arabia is continuing work on the development of the NEOM Green Hydrogen Project that implies the production of green ammonia for export purposes. Such investments promote development of the ammonia-based logistics chain that will help cater to international hydrogen demand and provide energy security for the future.
With increasing demand for technological development that will help in improving efficiency and decreasing emissions of ammonia production processes, the ammonia industry witnesses a trend towards the use of digitalization. Producers are increasingly using AI systems, predictive maintenance tools, and digital twins in order to decrease their energy consumption and downtime. In October 2025, ABB partnered with SwitcH2, supplying automation and electrification technologies for floating green ammonia production, advancing low-carbon marine fuels. Honeywell also continues integrating advanced automation and cybersecurity technologies across chemical production assets.
The government-sponsored financing schemes are rapidly advancing the adoption of green ammonia through lowering the risks involved in early-stage commercialization projects, thus stimulating growth in the ammonia market. The European Hydrogen Bank is continuing with its investment support for renewable hydrogen projects that make the economics of green ammonia production more viable in Europe. In the United States, the financial benefits provided by the Inflation Reduction Act in clean hydrogen are encouraging the development of renewable hydrogen alongside the ammonia production plant. For example, in July 2026, United States supported Morocco’s USD 4.5 billion green ammonia project, accelerating renewable hydrogen production, fertilizer decarbonization, and clean energy exports. Furthermore, the Indian National Green Hydrogen Mission is fostering domestic green ammonia production for use in fertilizers and exports.
The EMR’s report titled “Ammonia Market Report and Forecast 2026-2035” offers a detailed analysis of the market based on the following segments:
Market Breakup by Type
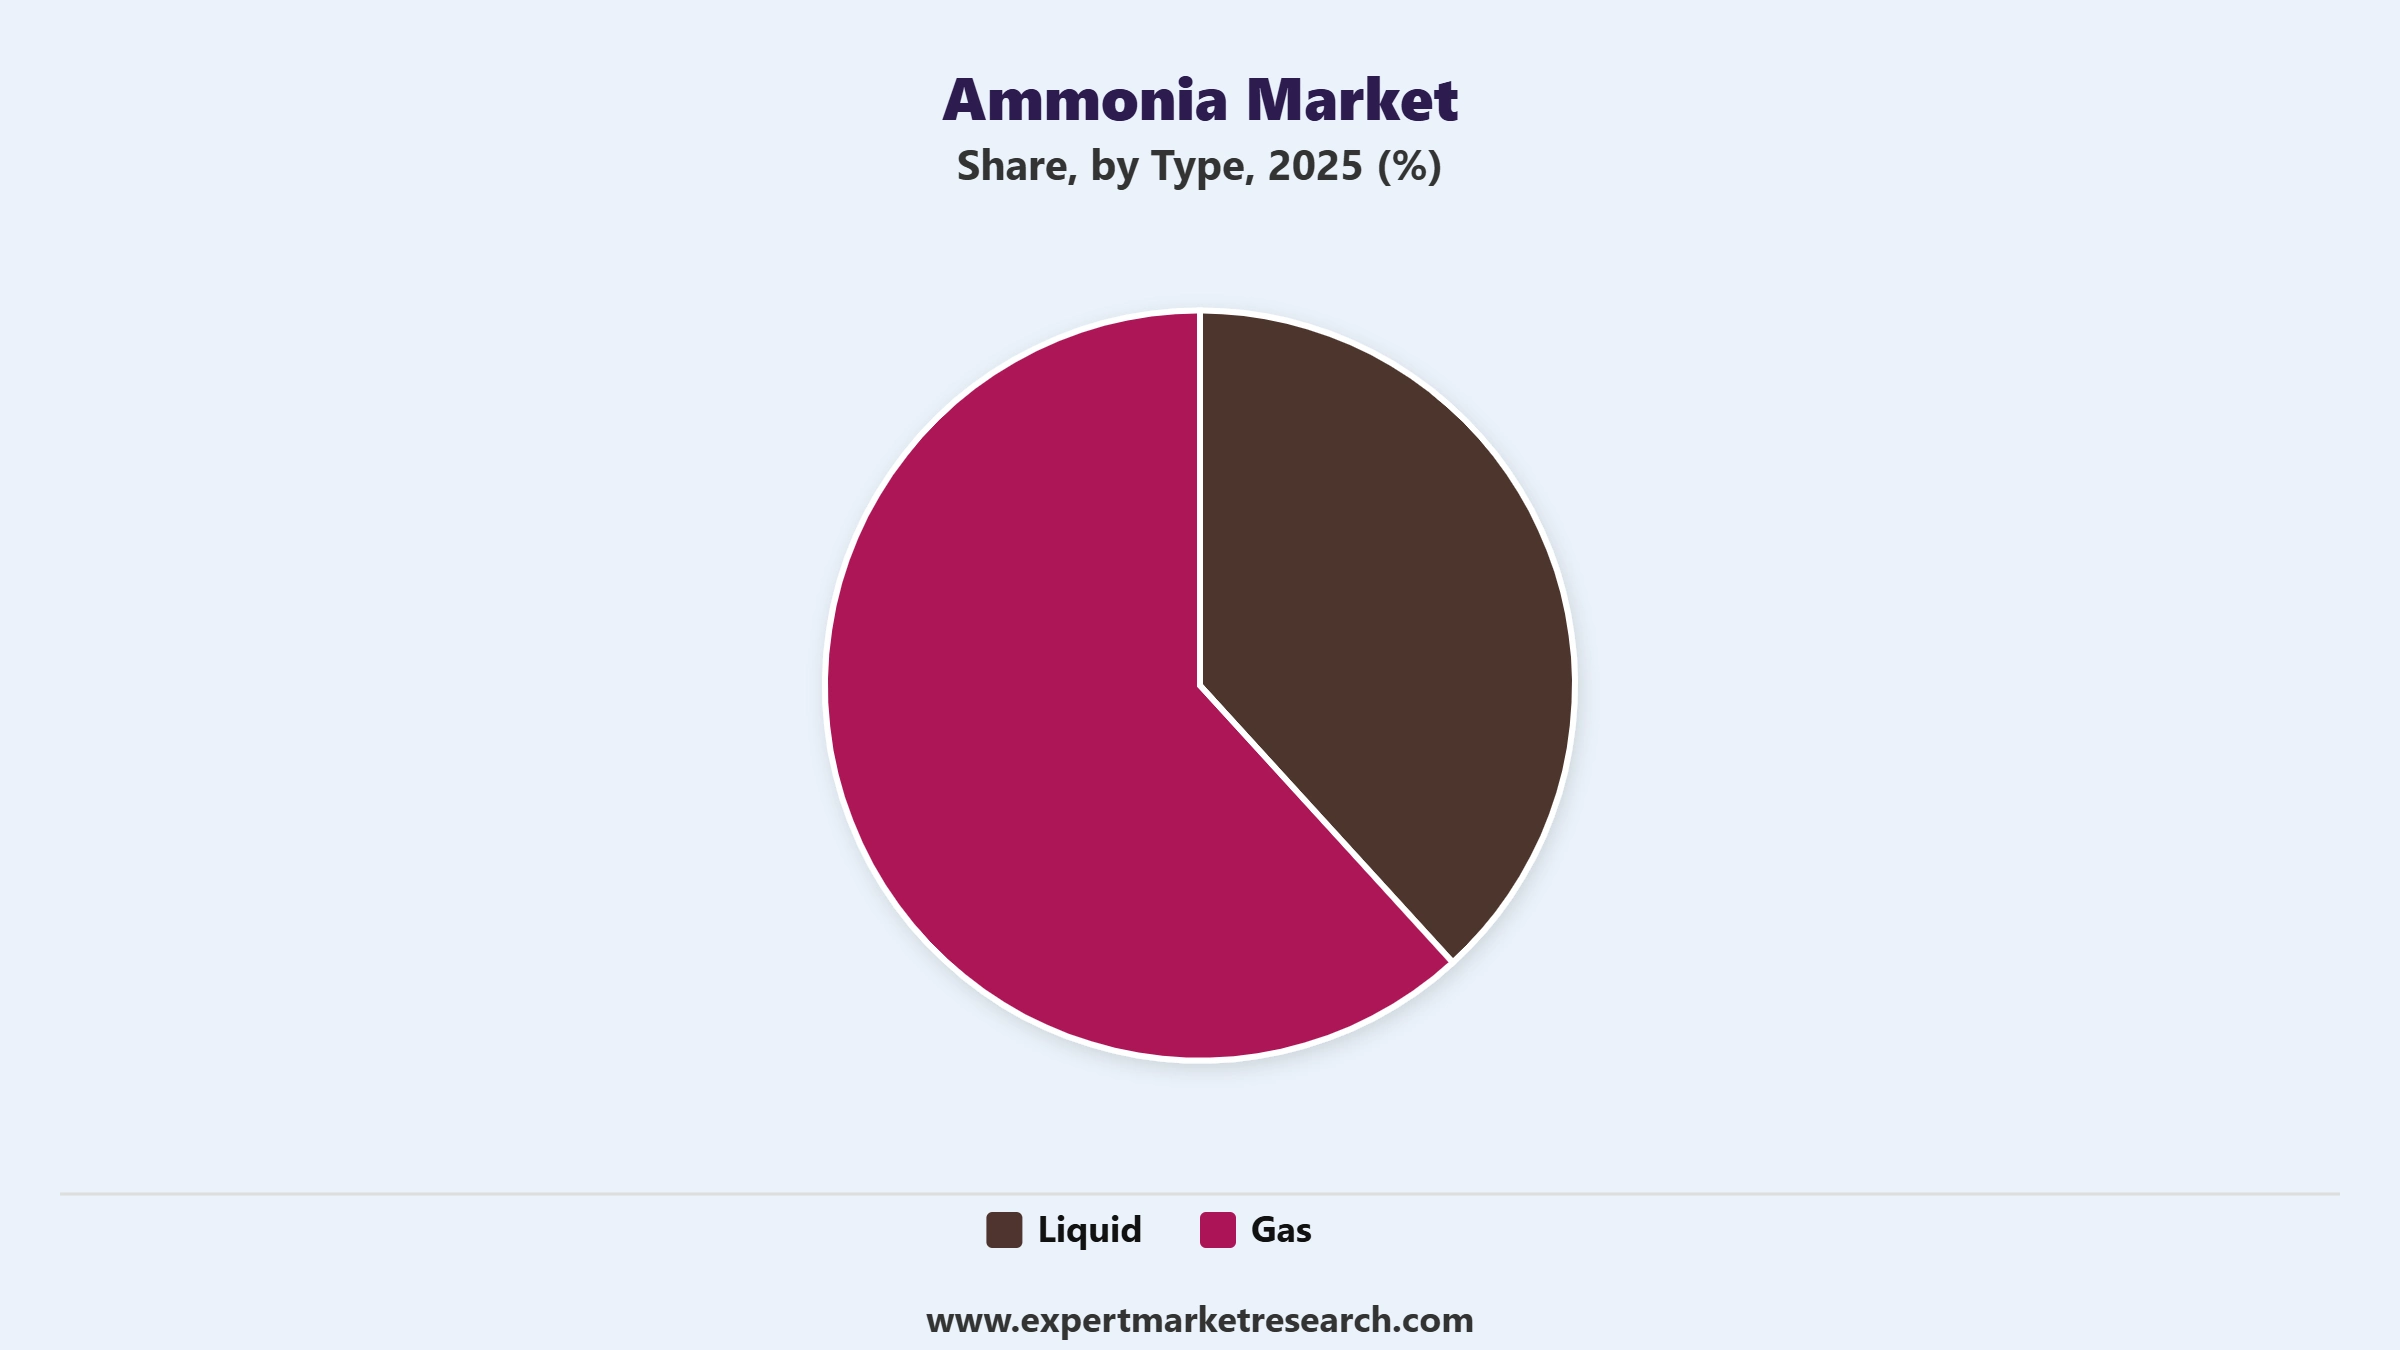
Key Insight: A well-balanced development in the ammonia market is being observed both in terms of the liquid and gaseous form, which meet different needs of industries. Liquid ammonia is widely preferred due to its well-established transportation infrastructure, ease of storage, and extensive use in fertilizer production, chemical manufacturing, and industrial refrigeration applications. The gaseous form is growing steadily due to maturity of hydrogen economies and the adoption of cleaner production techniques by industries that require flexibility in integrating processes. In December 2025, MOL and JERA launched Japan’s first large-scale low-carbon ammonia shipping project, strengthening clean fuel logistics and maritime decarbonization.
Market Breakup by End Use
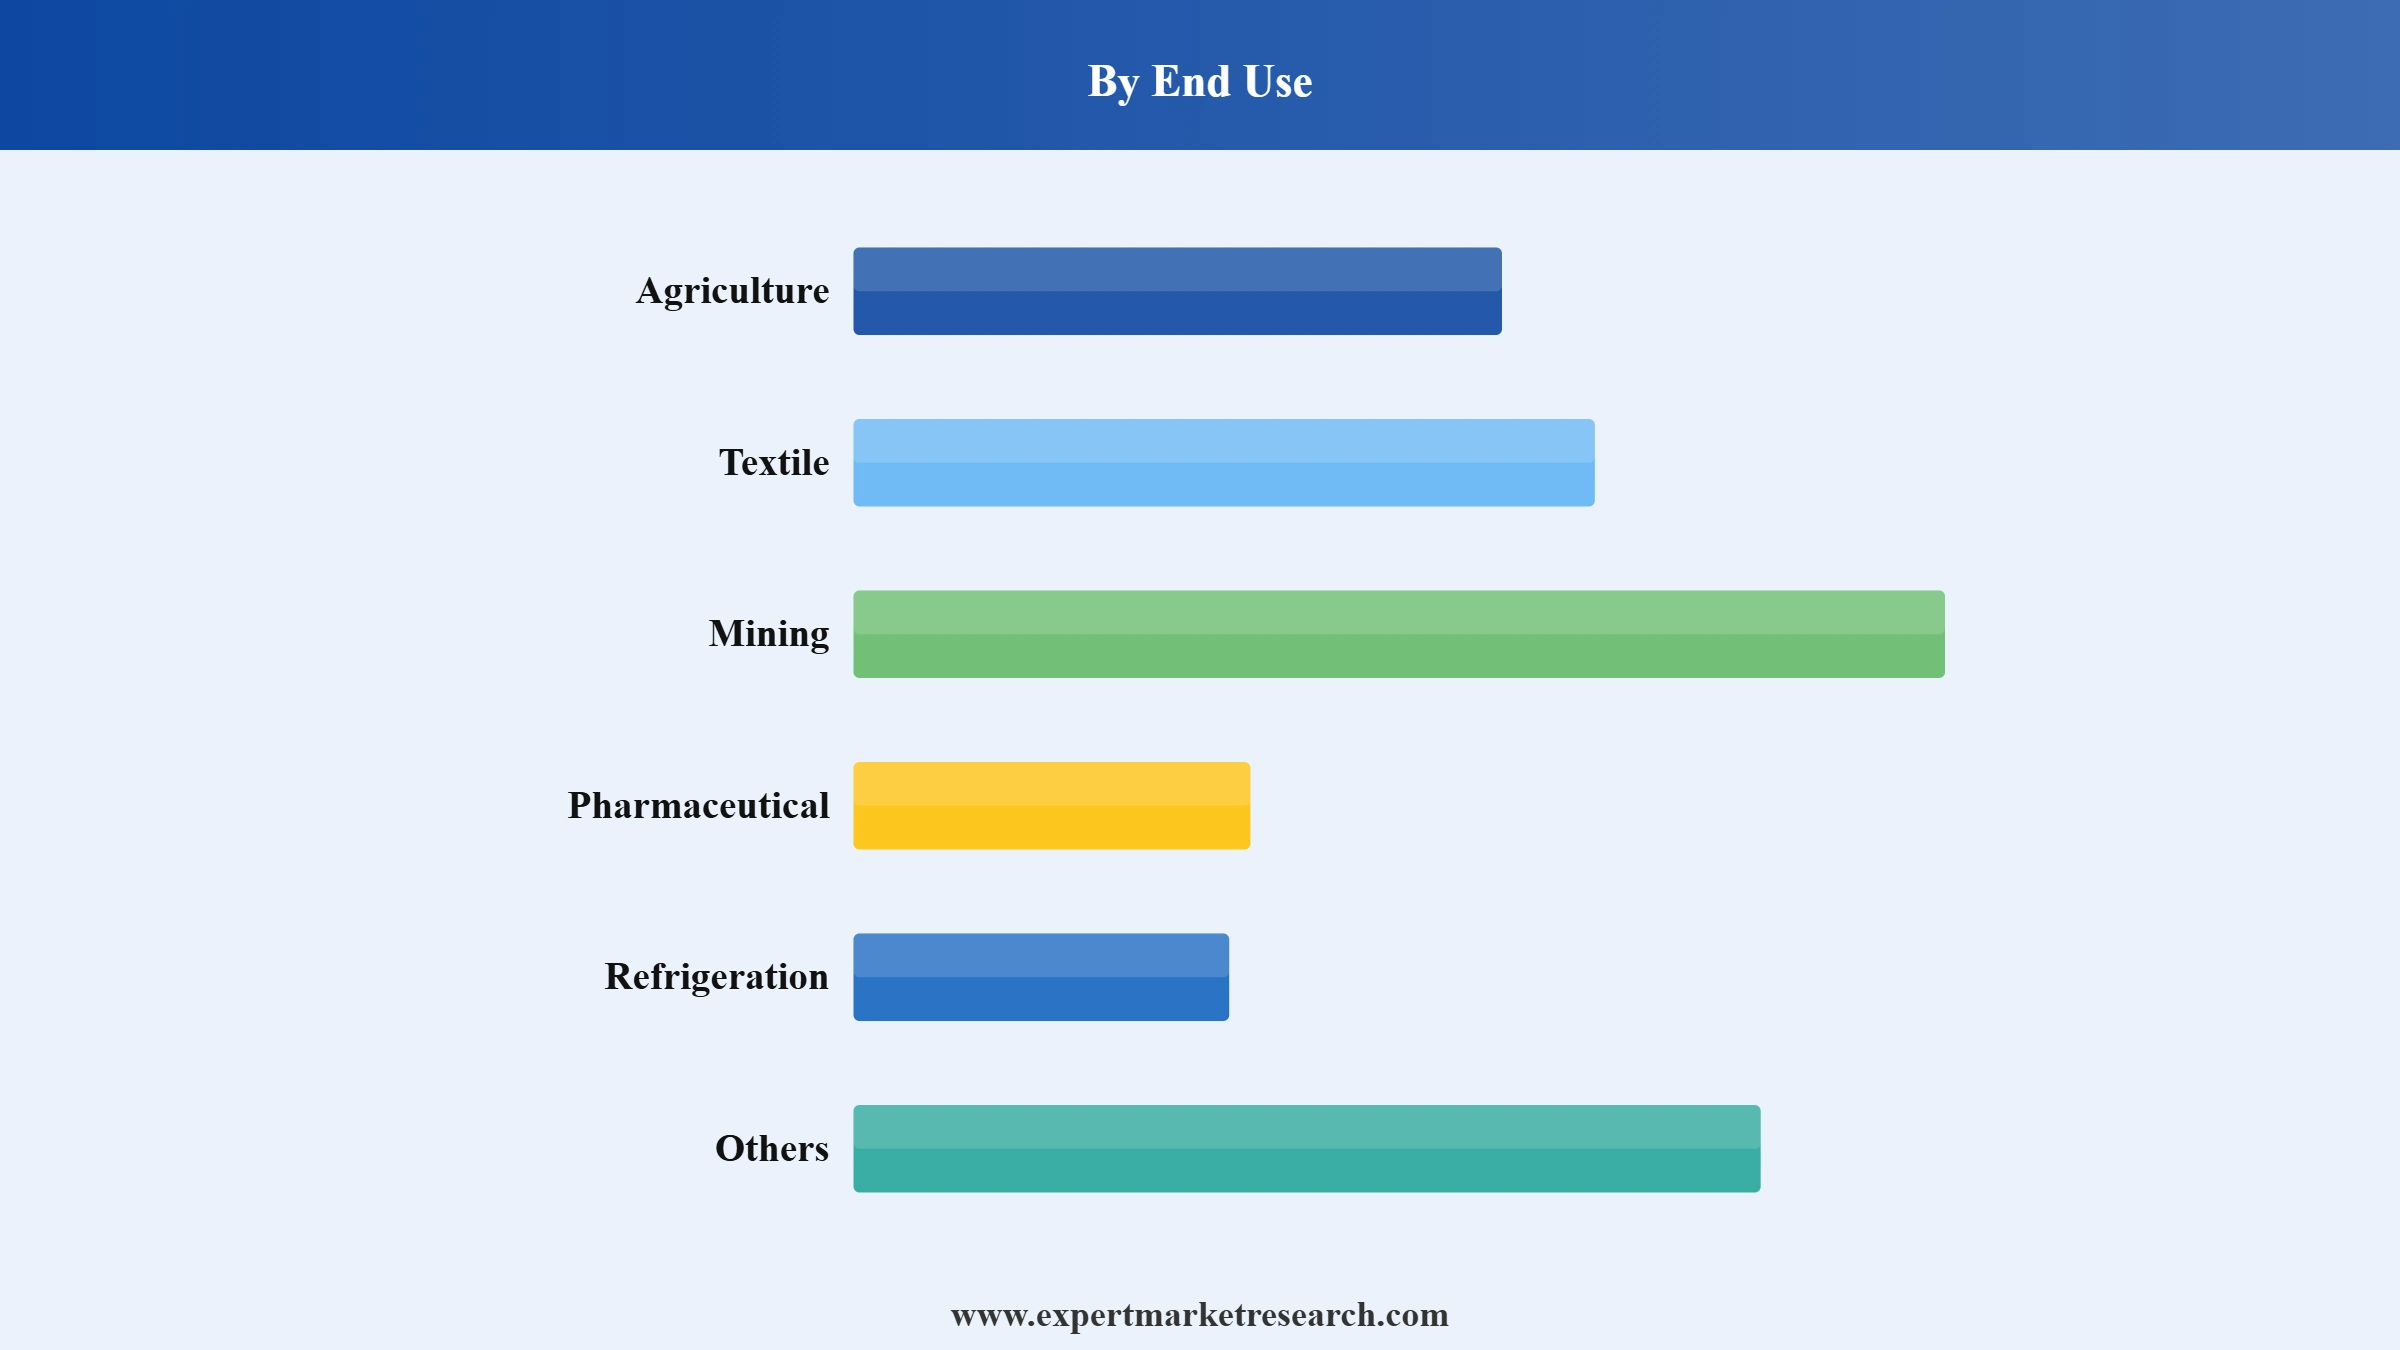
Key Insight: Agriculture remains the largest consumer of ammonia, its primary application is in the production of nitrogen-based fertilizers that support global food production. The pharmaceutical industry is growing rapidly owing to the requirement of specialty chemicals in their manufacture. Textile producers use ammonia for finishing purposes in order to enhance the quality of fabrics while mining companies use explosives made up of ammonia for extraction purposes. Industrial refrigeration remains one of the steady demand sectors as ammonia is used in food processing and logistics industries, accelerating growth in the ammonia market value. Others include water treatment, electronic goods, pulp & paper, and chemical production industries.
Market Breakup by Region
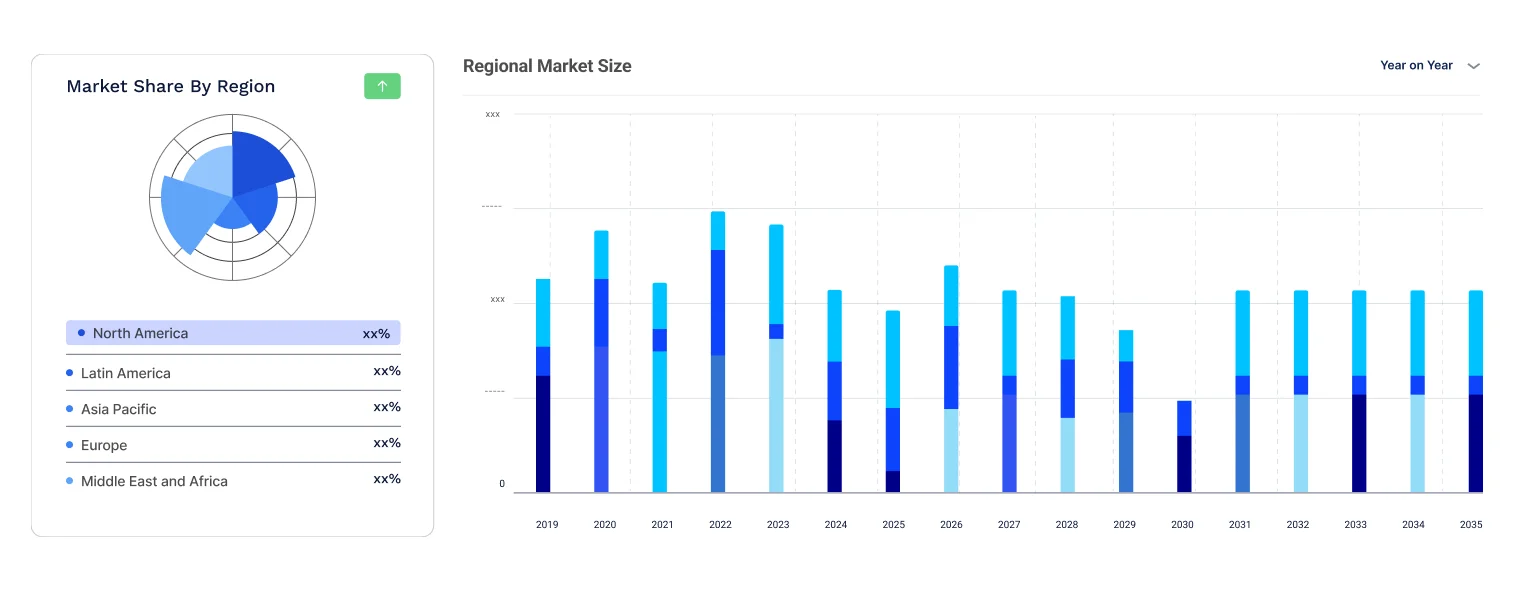
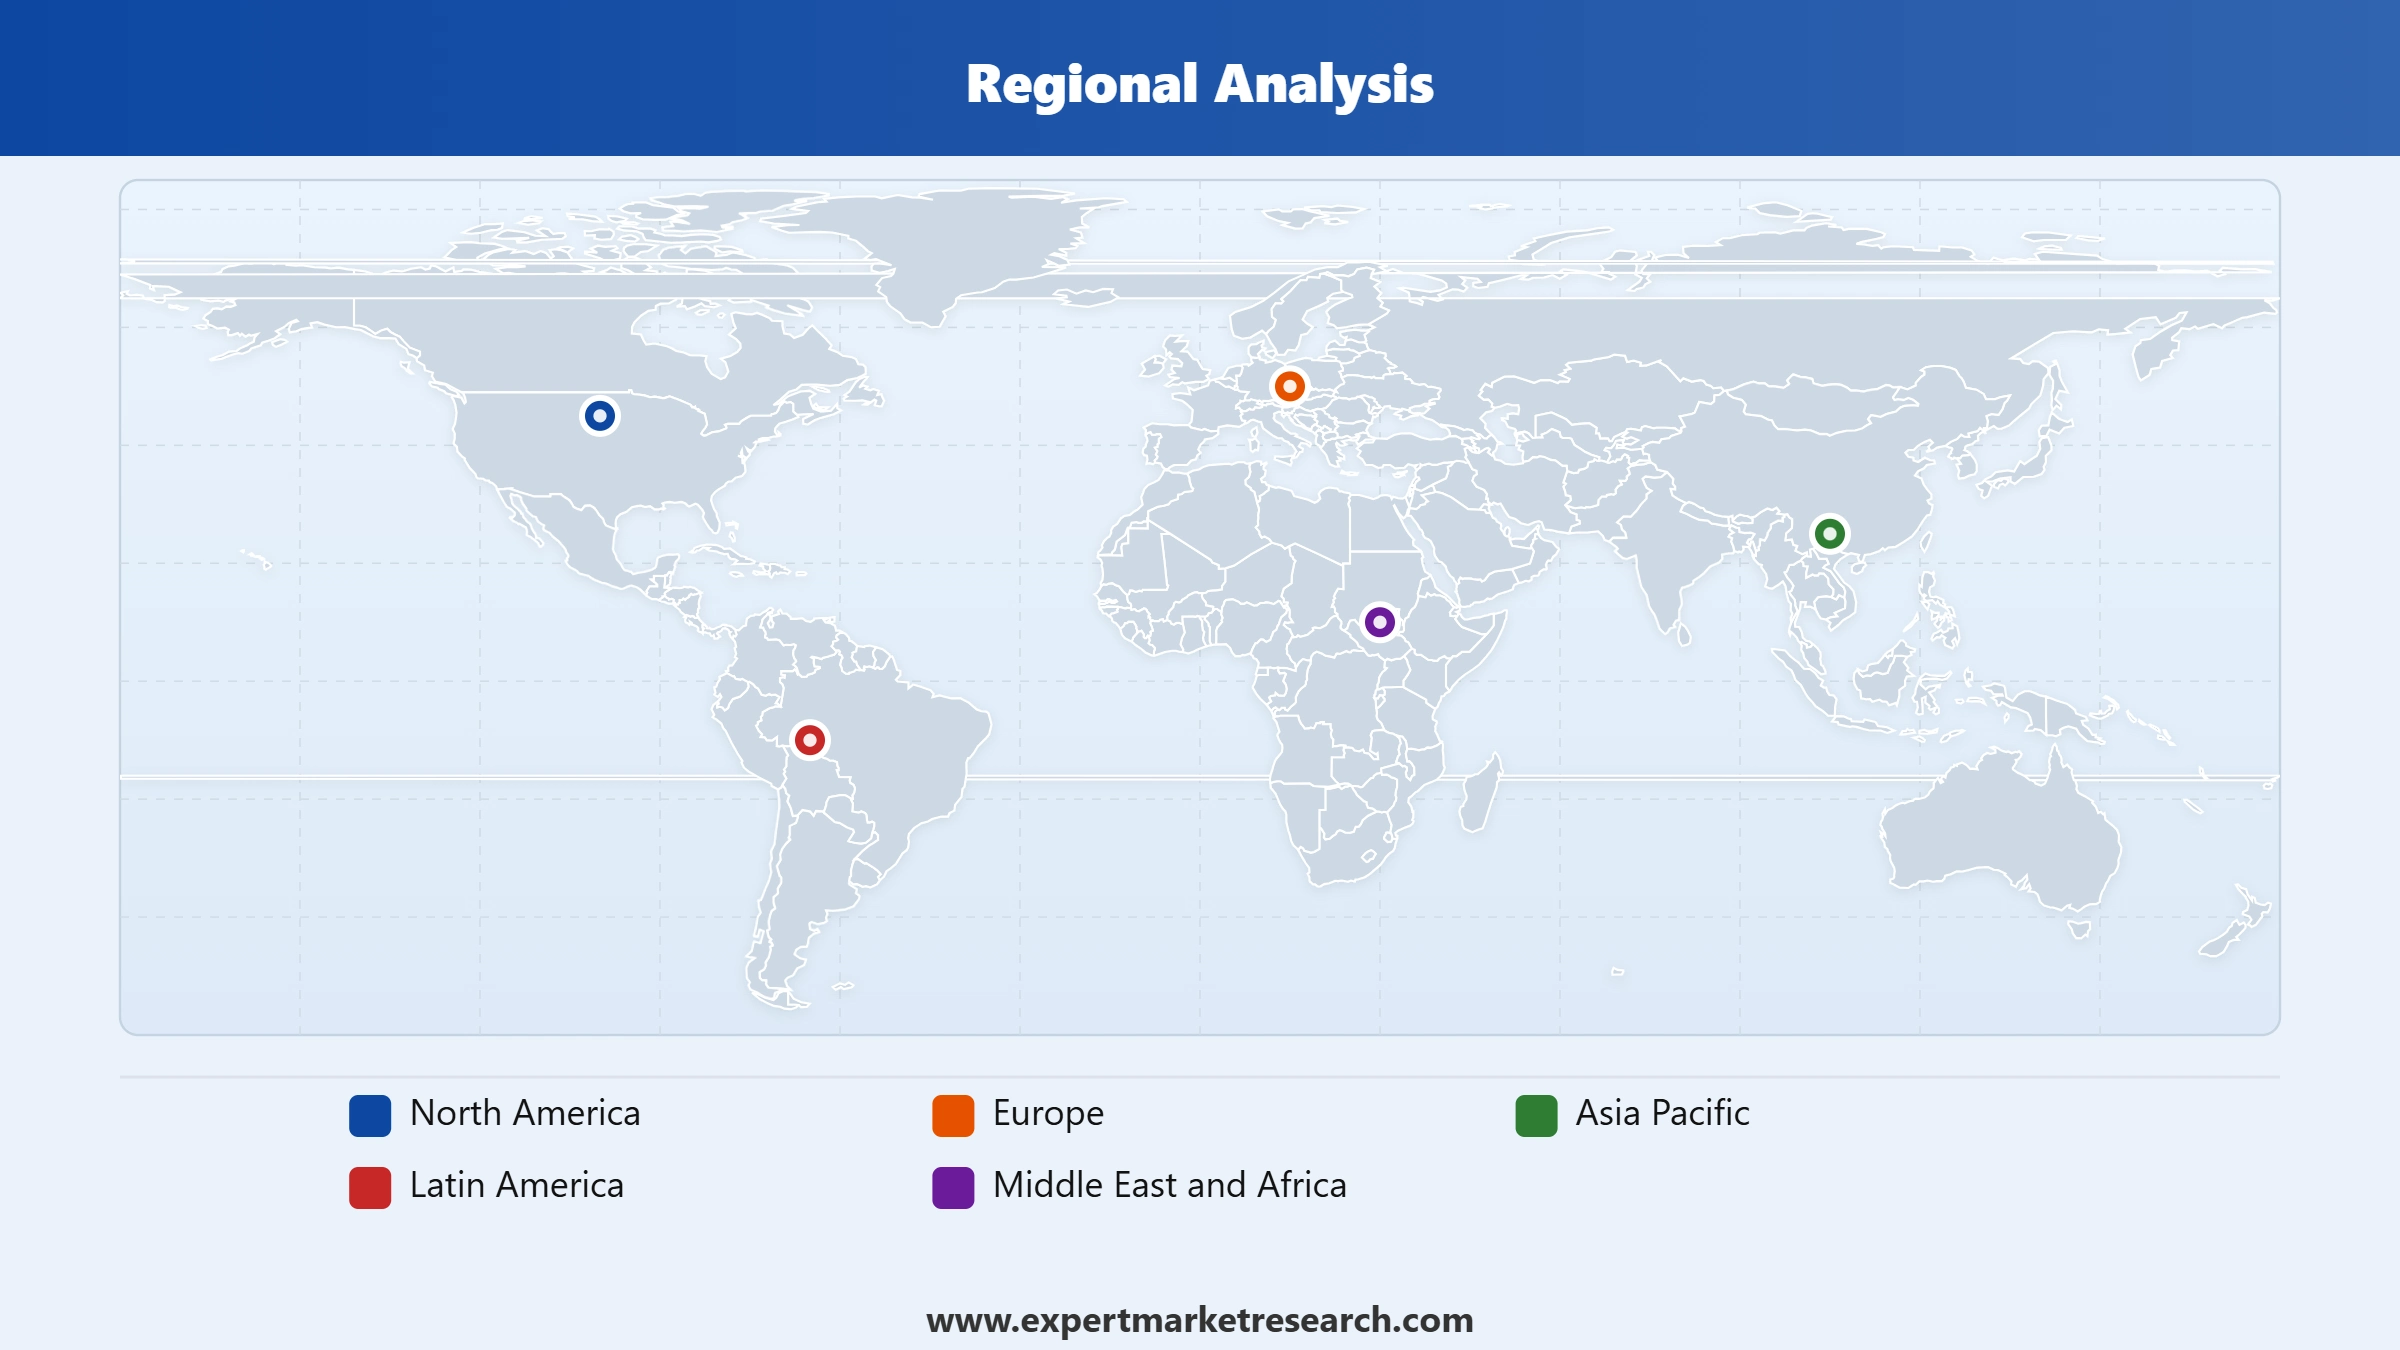
Key Insight: Regional demands in the ammonia market vary depending on the industrial needs and availability of resources. Asia Pacific continues to hold dominance due to the presence of fertilizer production, industrialization, and ecosystem production. North America boasts technological advancements, abundance of natural gas, and increased investments in ammonia production that produce low carbon. Europe focuses on green ammonia production through decarbonization initiatives and the expansion of hydrogen infrastructure. Latin America is witnessing growth with the expanding agriculture industry and renewable resources for future ammonia production. The Middle East and Africa region is fast becoming a major exporting region because of its renewable energy capacity and geography.
By type, liquid ammonia secures the dominant share of the market owing to efficient storage and industrial transportation
Liquid ammonia captures the major share in the ammonia market as it is extensively used in manufacturing fertilizers, refrigeration, industrial chemicals, and exports. Being denser in volume compared to gaseous ammonia, it is cheaper to transport and store liquid ammonia, especially during international transactions. Investments being made in ammonia terminals, cooling storage tanks, and export facilities are playing a key role in the adoption of liquid ammonia. Liquid ammonia is preferred by industries owing to its compatibility with existing distribution channels and helps them to cut down on their operating expenses without compromising on supply. In June 2025, INOX India launched India's first ultra-high-purity ammonia ISO tank, supporting semiconductor, solar manufacturing, and advanced industrial supply chains.
Read more about this report - REQUEST FREE SAMPLE COPY IN PDF
Gaseous ammonia is growing at the fastest pace as it is increasingly used by industries in hydrogen generation, emission control systems, semiconductor manufacturing, and specialty chemical processes. Expansion of clean energy projects is leading to increased demand for gaseous ammonia in cracking technology for hydrogen recovery near point of use, hence stabilizing the overall demand in the ammonia market. Industrial units are opting for gaseous ammonia as they can be integrated directly into manufacturing processes. Investments in advanced delivery systems and industrial automation are encouraging the adoption of gaseous ammonia.
By end use, agriculture leads the market as fertilizers remain ammonia's largest commercial application
Agriculture remains the primary driving factor that is boosting the ammonia market revenue, as nitrogen fertilizers are critical in enhancing crop yield and ensuring food security. Industrial farms are increasingly relying on ammonia-based fertilizers to ensure soil fertility and high crop yields. Producers are developing efficient processes for ammonia-based fertilizers that align with sustainability targets without compromising productivity. Increasing global food demand, the practice of precision farming, and government efforts to modernize agriculture are some of the key factors contributing to growth in ammonia consumption in developed and emerging agricultural markets. In July 2026, India approved anhydrous ammonia for agricultural use, reducing urea import dependence, improving nitrogen efficiency, and supporting fertilizer security.
Read more about this report - REQUEST FREE SAMPLE COPY IN PDF
Pharmaceuticals is becoming one of the key segments that is accelerating rapid demand in the ammonia market on account of growing active pharmaceutical ingredients and specialty chemical manufacture that require ammonia derivatives. Ammonia producers are increasingly deploying high purity ammonia applications in order to satisfy stringent product quality requirements as well as enhance efficiency in production processes. Pharmaceutical companies are increasingly investing in facility construction, biosynthesis, and chemical synthesis. For example, in February 2025, Yaqrit advanced its ammonia scavenger into Phase 3 trials, targeting hepatic encephalopathy through accelerated blood ammonia reduction.
Read more about this report - REQUEST FREE SAMPLE COPY IN PDF
Asia Pacific clocks in the dominant share of the market through large-scale fertilizer production and manufacturing capacity
The largest ammonia market share is registered by the Asia Pacific region owing to intensive production of fertilizers, expansion of manufacturing industries, and robust agricultural demand. Countries including China, India, Japan, and South Korea are expanding ammonia production capacity alongside investments in green hydrogen and low-carbon ammonia to support the transition toward cleaner energy systems. The market records robust demand fueled by rapid industrialization, rising food demands, and improved export capabilities. Energy transition programs by governments are driving investment in green ammonia projects, making the region both a producer and consumer of ammonia.
Read more about this report - REQUEST FREE SAMPLE COPY IN PDF
The Middle East and Africa region is expected to witness the fastest growth in the ammonia industry owing to abundant renewable energy resources making the production of ammonia competitively green and exportable to other markets around the world. Countries within the Gulf region are investing heavily in hydrogen and ammonia projects that target Europe and Asia. The region’s strengths include petrochemical experience, large-scale industrial base, and logistics. In July 2026, Yara finalized NEOM green ammonia marketing agreement, expanding renewable ammonia distribution, accelerating commercialization, and strengthening global low-carbon energy supply chains.
The global industry observes stiff competition in terms of carbon dioxide-free manufacturing of ammonia, carbon capture systems, partnerships in renewable hydrogen, and long-term agreements with industrial end-users. Leading ammonia market players are making considerable investments in their green and blue ammonia plants, process digitalization, and export infrastructure to improve competitiveness.
Most ammonia companies are engaging with logistics companies, electricity providers, and steel manufacturers to explore various uses of ammonia in addition to the fertilizer application. Marine fuel, hydrogen transportation, decarbonization of industries, and power generation are creating new opportunities for firms in the ammonia industry, prompting them to explore different sources of income.
Headquartered in Oslo, Norway and established in 1905, Yara International ASA is one of the world's biggest ammonia producers that concentrate on providing sustainable fertilizer solutions and clean ammonia. The company focuses on the production of green and low-carbon ammonia in collaboration with renewable hydrogen providers and works on supply agreements for shipping, decarbonization of industry, and power generation needs.
CSBP Limited is a company established in 1910 and headquartered in Perth, Australia, that produces ammonia and fertilizers used mostly by Australian agriculture and industries. The company is constantly modernizing its production facilities in order to increase efficiency and improve its performance, while cooperating with local industries for better supply security in the future.
Formed in 1946 and having its headquarters in Northbrook, Illinois, United States, CF Industries Holdings, Inc. is a leading manufacturer of ammonia and nitrogen products. The company is making huge investments in blue ammonia projects driven by carbon capture technologies in addition to developing an export platform for the sale of its products in clean energy markets, maritime fuels, and industrial clients seeking low-carbon footprints.
Formed in 2013 and having its headquarters in Wichita, Kansas, United States, Koch Fertilizer, LLC manufactures ammonia and fertilizers for both agricultural and industrial sectors. The company emphasizes production efficiency, technological advancements, and logistics in order to build the necessary infrastructure for the efficient distribution of ammonia throughout North America and other selected countries.
Other key players in the market include GROUP DF, CASCALE SA, OCI N.V., Acron Group, BASF SE, SABIC, Indian Farmers Fertiliser Cooperative (IFFCO), and Nutrien Ltd., among others.
*Please note that this is only a partial list; the complete list of key players is available in the full report. Additionally, the list of key players can be customized to better suit your needs.*
Unlock the latest insights with our ammonia market trends 2026 report. Discover regional growth patterns, consumer preferences, and key industry players. Stay ahead of competition with trusted data and expert analysis. Download your free sample report today and drive informed decisions in the market.


Upto 15% Off
USD
$2499 $2249
$3999 $3599
$4999 $4249
$5999 $5099


*While we strive to always give you current and accurate information, the numbers depicted on the website are indicative and may differ from the actual numbers in the main report. At Expert Market Research, we aim to bring you the latest insights and trends in the market. Using our analyses and forecasts, stakeholders can understand the market dynamics, navigate challenges, and capitalize on opportunities to make data-driven strategic decisions.*
In 2025, the market reached an approximate volume of 198.50 MMT.
The market is projected to grow at a CAGR of 1.90% between 2026 and 2035.
The market is assessed to reach almost 239.61 MMT by 2035.
Stakeholders are expanding renewable partnerships, strengthening export infrastructure, adopting digital plant technologies, securing long-term supply agreements, investing in carbon capture, and developing innovative ammonia solutions for emerging energy markets.
Key trends aiding market expansion include the increasing utilisation in various end-use sectors, favourable government initiatives, and the rising production of green ammonia.
Ammonia can be an environment-friendly alternative to other fuels in the shipping and aviation sector as it can reduce the emissions.
Regions considered in the market are North America, Europe, the Asia Pacific, Latin America, and the Middle East and Africa.
The green ammonia refers to the ammonia production that is renewable and carbon-free, using nitrogen from the air and hydrogen from water electrolysis.
The various end uses of ammonia include agriculture, textile, mining, pharmaceutical, and refrigeration, among others.
The key players in the market include Yara International ASA, CSBP Limited, CF Industries Holdings, Inc., Koch Fertilizer, LLC, GROUP DF, CASCALE SA, OCI N.V., Acron Group, BASF SE, SABIC, Indian Farmers Fertiliser Cooperative (IFFCO), and Nutrien Ltd., among others.
High capital requirements, volatile natural gas prices, evolving emissions regulations, infrastructure limitations, and uncertainty surrounding low-carbon ammonia commercialization continue challenging producers despite rising industrial demand and sustainability investments.
Explore our key highlights of the report and gain a concise overview of key findings, trends, and actionable insights that will empower your strategic decisions.
| REPORT FEATURES | DETAILS |
| Base Year | 2025 |
| Historical Period | 2019-2025 |
| Forecast Period | 2026-2035 |
| Scope of the Report |
Historical and Forecast Trends, Industry Drivers and Constraints, Historical and Forecast Market Analysis by Segment:
|
| Breakup by Type |
|
| Breakup by End Use |
|
| Breakup by Region |
|
| Market Dynamics |
|
| Trade Data Analysis |
|
| Price Analysis |
|
| Competitive Landscape |
|
| Companies Covered |
|
Datasheet
One User
USD 2,499
USD 2,249
tax inclusive*
Single User License
One User
USD 3,999
USD 3,599
tax inclusive*
Five User License
Five User
USD 4,999
USD 4,249
tax inclusive*
Corporate License
Unlimited Users
USD 5,999
USD 5,099
tax inclusive*
*Please note that the prices mentioned below are starting prices for each bundle type. Kindly contact our team for further details.*
Flash Bundle
Small Business Bundle
Growth Bundle
Enterprise Bundle
*Please note that the prices mentioned below are starting prices for each bundle type. Kindly contact our team for further details.*
Flash Bundle
Number of Reports: 3
20%
tax inclusive*
Small Business Bundle
Number of Reports: 5
25%
tax inclusive*
Growth Bundle
Number of Reports: 8
30%
tax inclusive*
Enterprise Bundle
Number of Reports: 10
35%
tax inclusive*
How To Order

Select License Type
Choose the right license for your needs and access rights.

Click on ‘Buy Now’
Add the report to your cart with one click and proceed to register.

Select Mode of Payment
Choose a payment option for a secure checkout. You will be redirected accordingly.
Strategic Solutions for Informed Decision-Making
Gain insights to stay ahead and seize opportunities.

Get insights & trends for a competitive edge.

Track prices with detailed trend reports.

Analyse trade data for supply chain insights.

Leverage cost reports for smart savings

Enhance supply chain with partnerships.

Connect For More Information
Our expert team of analysts will offer full support and resolve any queries regarding the report, before and after the purchase.
Our expert team of analysts will offer full support and resolve any queries regarding the report, before and after the purchase.
We employ meticulous research methods, blending advanced analytics and expert insights to deliver accurate, actionable industry intelligence, staying ahead of competitors.
Our skilled analysts offer unparalleled competitive advantage with detailed insights on current and emerging markets, ensuring your strategic edge.
We offer an in-depth yet simplified presentation of industry insights and analysis to meet your specific requirements effectively.




