

Consumer Insights
Uncover trends and behaviors shaping consumer choices today
Procurement Insights
Optimize your sourcing strategy with key market data
Industry Stats
Stay ahead with the latest trends and market analysis.
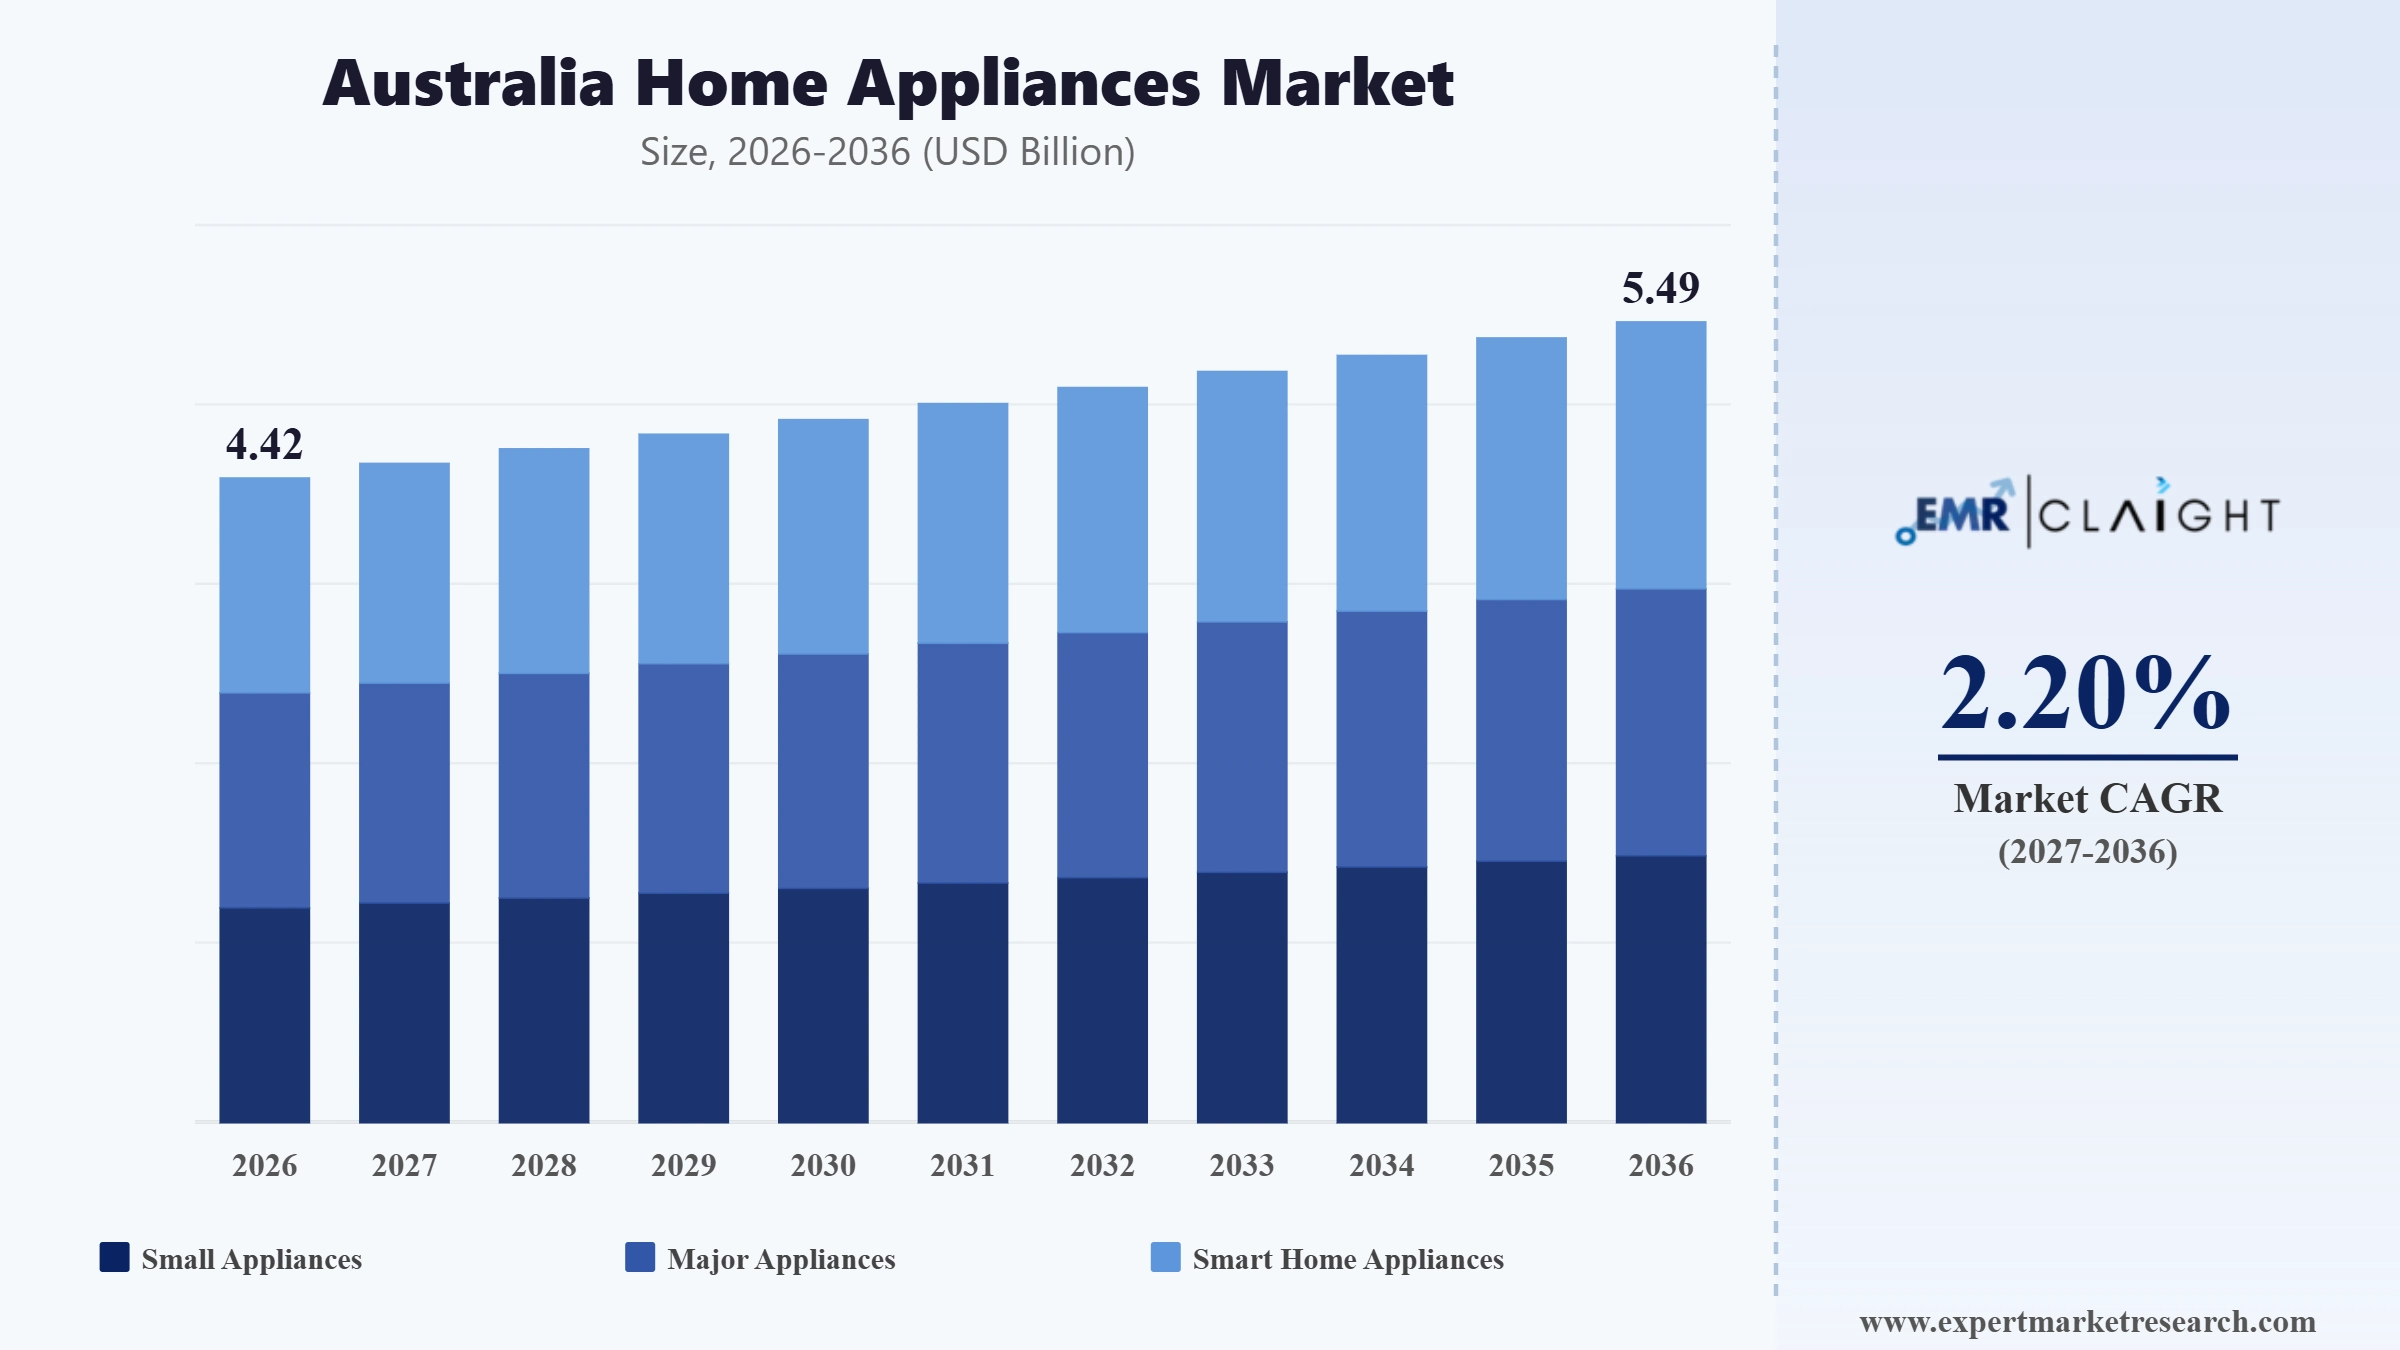
The Australia home appliances market attained a value of USD 4.32 Billion in 2025 and is projected to expand at a CAGR of 2.20% through 2035. The market is further expected to reach USD 5.37 Billion by 2035. Rising demand for smart and energy efficient appliances, alongside growing renovation activity across Australian households, is driving overall growth in the market, with connected home ecosystems and premiumisation reshaping how consumers approach everyday appliance purchases.
The Australia home appliances market encompasses small, major, and smart home appliances distributed through supermarkets, specialty stores, and online channels across the country. Demand continues to be shaped by rising smart connectivity adoption, growing renovation activity, and evolving consumer preferences toward energy efficient products, with major appliances accounting for the largest category share given consistent replacement cycles tied to housing turnover across the market.
Established Australia home appliances companies are increasingly launching AI enabled home ecosystems in the Australian market ahead of other regional markets, reflecting growing confidence in local consumer readiness for connected appliance technology. In April 2026, LG Electronics confirmed that its ThinQ ON artificial intelligence home hub would launch first in Australia and Thailand as part of a phased rollout across the Asia Pacific region.
The Australia home appliances market is increasingly directing investment toward seamless, integrated kitchen design and artificial intelligence features rather than relying solely on conventional standalone appliances, reflecting a strategic shift toward premiumisation as competition intensifies across major retailers. Companies are pursuing parallel investment across voice activated controls, self-managing appliances, and subscription-based service models rather than remaining narrowly focused on one time hardware sales, while strengthening direct to consumer channels to reduce dependence on traditional retail margins. Expanding programmes of this scale give appliance manufacturers greater control over customer relationships while capturing recurring revenue beyond the initial appliance purchase.
Read more about this report - Request a Free Sample
Fisher and Paykel unveiled a new state of the art appliance collection at EuroCucina 2026 in Milan, highlighted by a 30-inch oven platform designed to sit flush within cabinetry with gaps as tight as 2 millimetres. Manufacturers across the Australia home appliances market pursuing seamless integrated design of this kind can differentiate premium kitchen ranges as consumers increasingly prioritise cabinetry matching aesthetics over standalone appliance styling.
Smeg unveiled a new design and product strategy at EuroCucina 2026 in Milan, introducing the Musa and Isola collections that position appliances as visible, tactile centrepieces rather than concealed kitchen technology. Companies can leverage bold design repositioning at major international trade fairs to differentiate premium ranges and capture renewed attention from retailers and design conscious consumers.
BSH Home Appliances showcased Bosch Cook AI, delivering professional chef level cooking guidance through agentic artificial intelligence, alongside its first cordless stick vacuum line at CES 2026 in Las Vegas. Bringing agentic AI capabilities into everyday cooking appliances gives manufacturers across the Australia home appliances market a differentiated value proposition beyond traditional hardware specifications, helping justify premium pricing across increasingly competitive kitchen appliance categories.
Dyson launched its PencilVac cordless vacuum in Australia following its unveiling at Dyson Unveiled, an event coinciding with IFA 2025 in Berlin where the company introduced eleven new products spanning vacuums, robotics, and air purifiers. Companies across the Australia home appliances market can leverage large scale product showcases to launch multiple innovations simultaneously, building sustained retail momentum across several appliance categories at once.
Established appliance distributors across the Australia home appliances market are increasingly showcasing supplier product ranges at national retail conferences, rather than relying solely on individual brand marketing, to strengthen relationships across the independent retail network. This is helping distributors present coordinated innovation narratives to franchise store owners. In August 2026, Arisit joined dozens of appliance suppliers showcasing new products at a major independent retail group's national conference on the Sunshine Coast.
Established premium appliance brands across the Australia home appliances market are increasingly expanding into outdoor cooking categories, rather than remaining confined to indoor kitchen segments, to capture growth in entertaining focused home renovation projects. This is helping manufacturers diversify revenue beyond saturated indoor appliance categories. In April 2026, Miele Australia confirmed its modular outdoor cooking portfolio, including the Fire Pro grill, would launch locally for spring 2026, ahead of several other regional markets, with the more advanced Fire Pro IQ grill following in summer 2027.
Established small appliance brands across the Australia home appliances market are increasingly launching multiple products within a single release cycle, rather than staggering individual launches, to maximise retail shelf presence during key selling periods. This is helping brands capture consumer attention across a broader range of price points simultaneously. In September 2025, Breville launched three new espresso machines spanning entry level to premium price tiers, expanding its coffee making range across every experience level.
Established appliance manufacturers across the Australia home appliances market are increasingly introducing subscription-based service models, rather than relying solely on one time hardware sales, to build recurring revenue streams and strengthen customer relationships. This is helping manufacturers reduce dependence on traditional retail margins over time. In December 2025, LG Electronics reported first quarter direct and online sales growth exceeding 9 percent year on year, reinforcing the regional case for expanded direct to consumer investment across its broader appliance division.
Established regional appliance retail franchises are increasingly undergoing leadership transitions, rather than maintaining static management structures, as ownership groups respond to competitive pressure from larger national chains. This is helping franchise networks refresh strategic direction during periods of market consolidation. In March 2026, Australian retail franchise Betta appointed a new interim chief executive to lead its more than 140 store networks nationwide, as parent group BSR Group navigated ongoing competitive pressure.
The Expert Market Research's report titled “Australia Home Appliances Market Report and Forecast 2026-2035” offers a detailed analysis of the market based on the following segments:
Market Breakup by Type
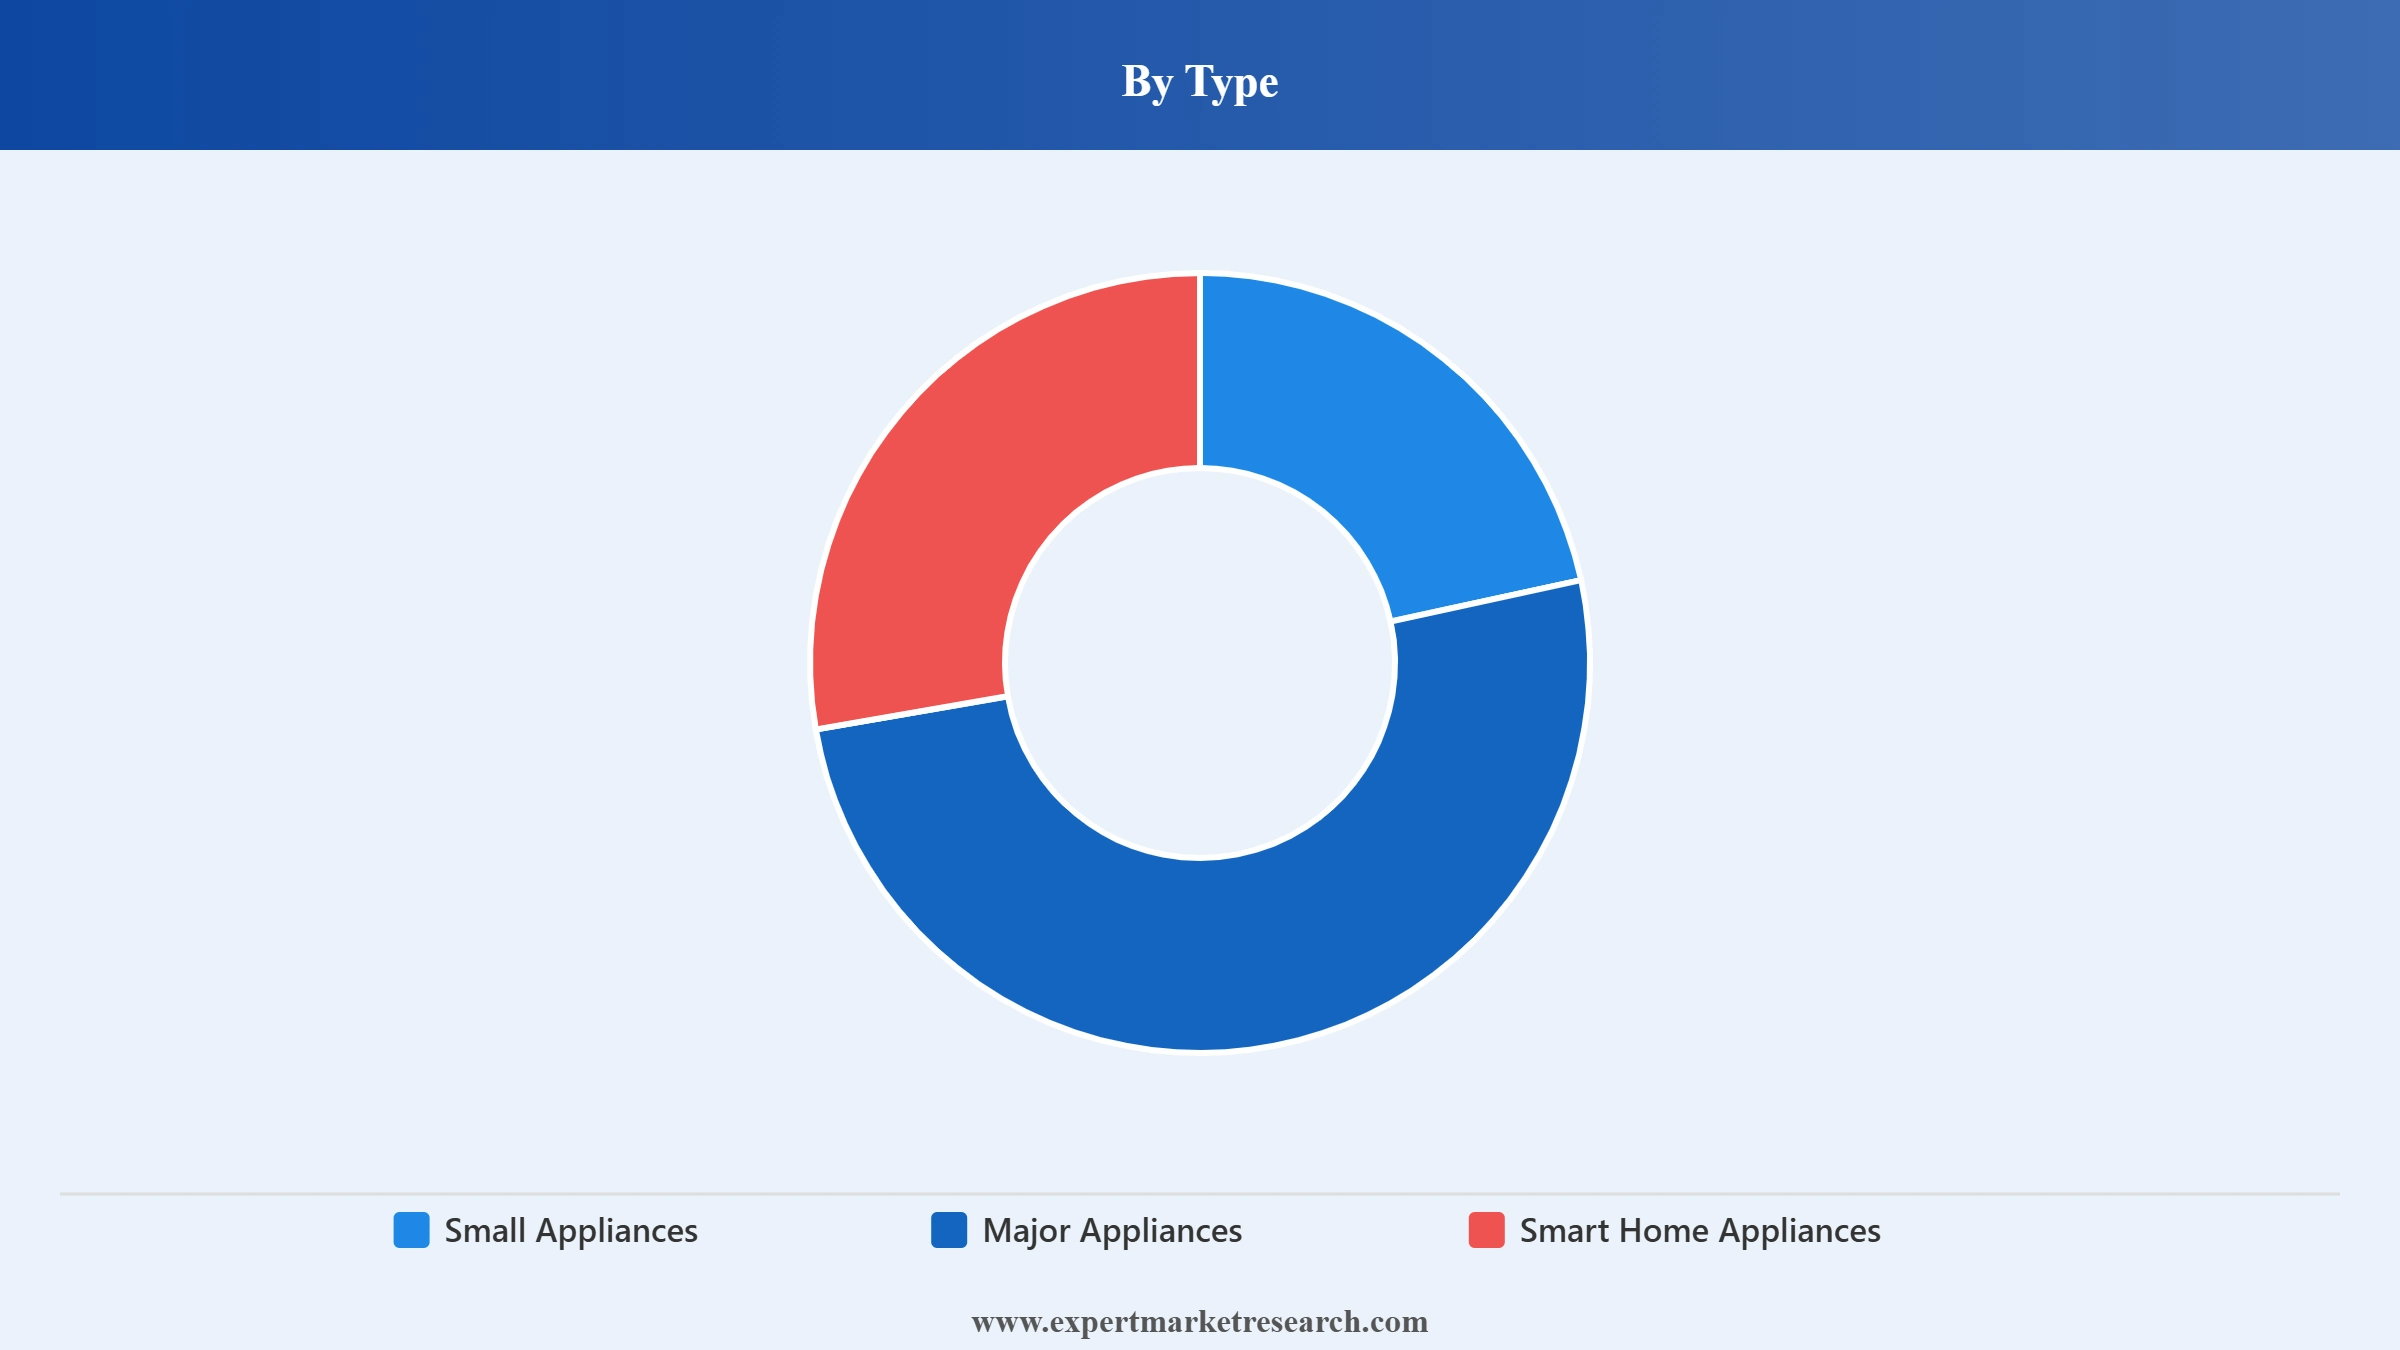
Key Insight: Consistent replacement cycles tied to housing turnover keep major appliances as the largest product category across the Australia home appliances market, spanning heating and cooling, washing and drying, cooking, and refrigeration equipment. Compact kitchen tools including microwave ovens, food processors, and coffeemakers sustain steady demand for small appliances, while rising connectivity adoption is pushing smart home appliances toward the fastest growth, illustrated by Hisense's November 2025 launch of its PureView connected French door refrigerator across the Australian market.
Market Breakup by Distribution Channel
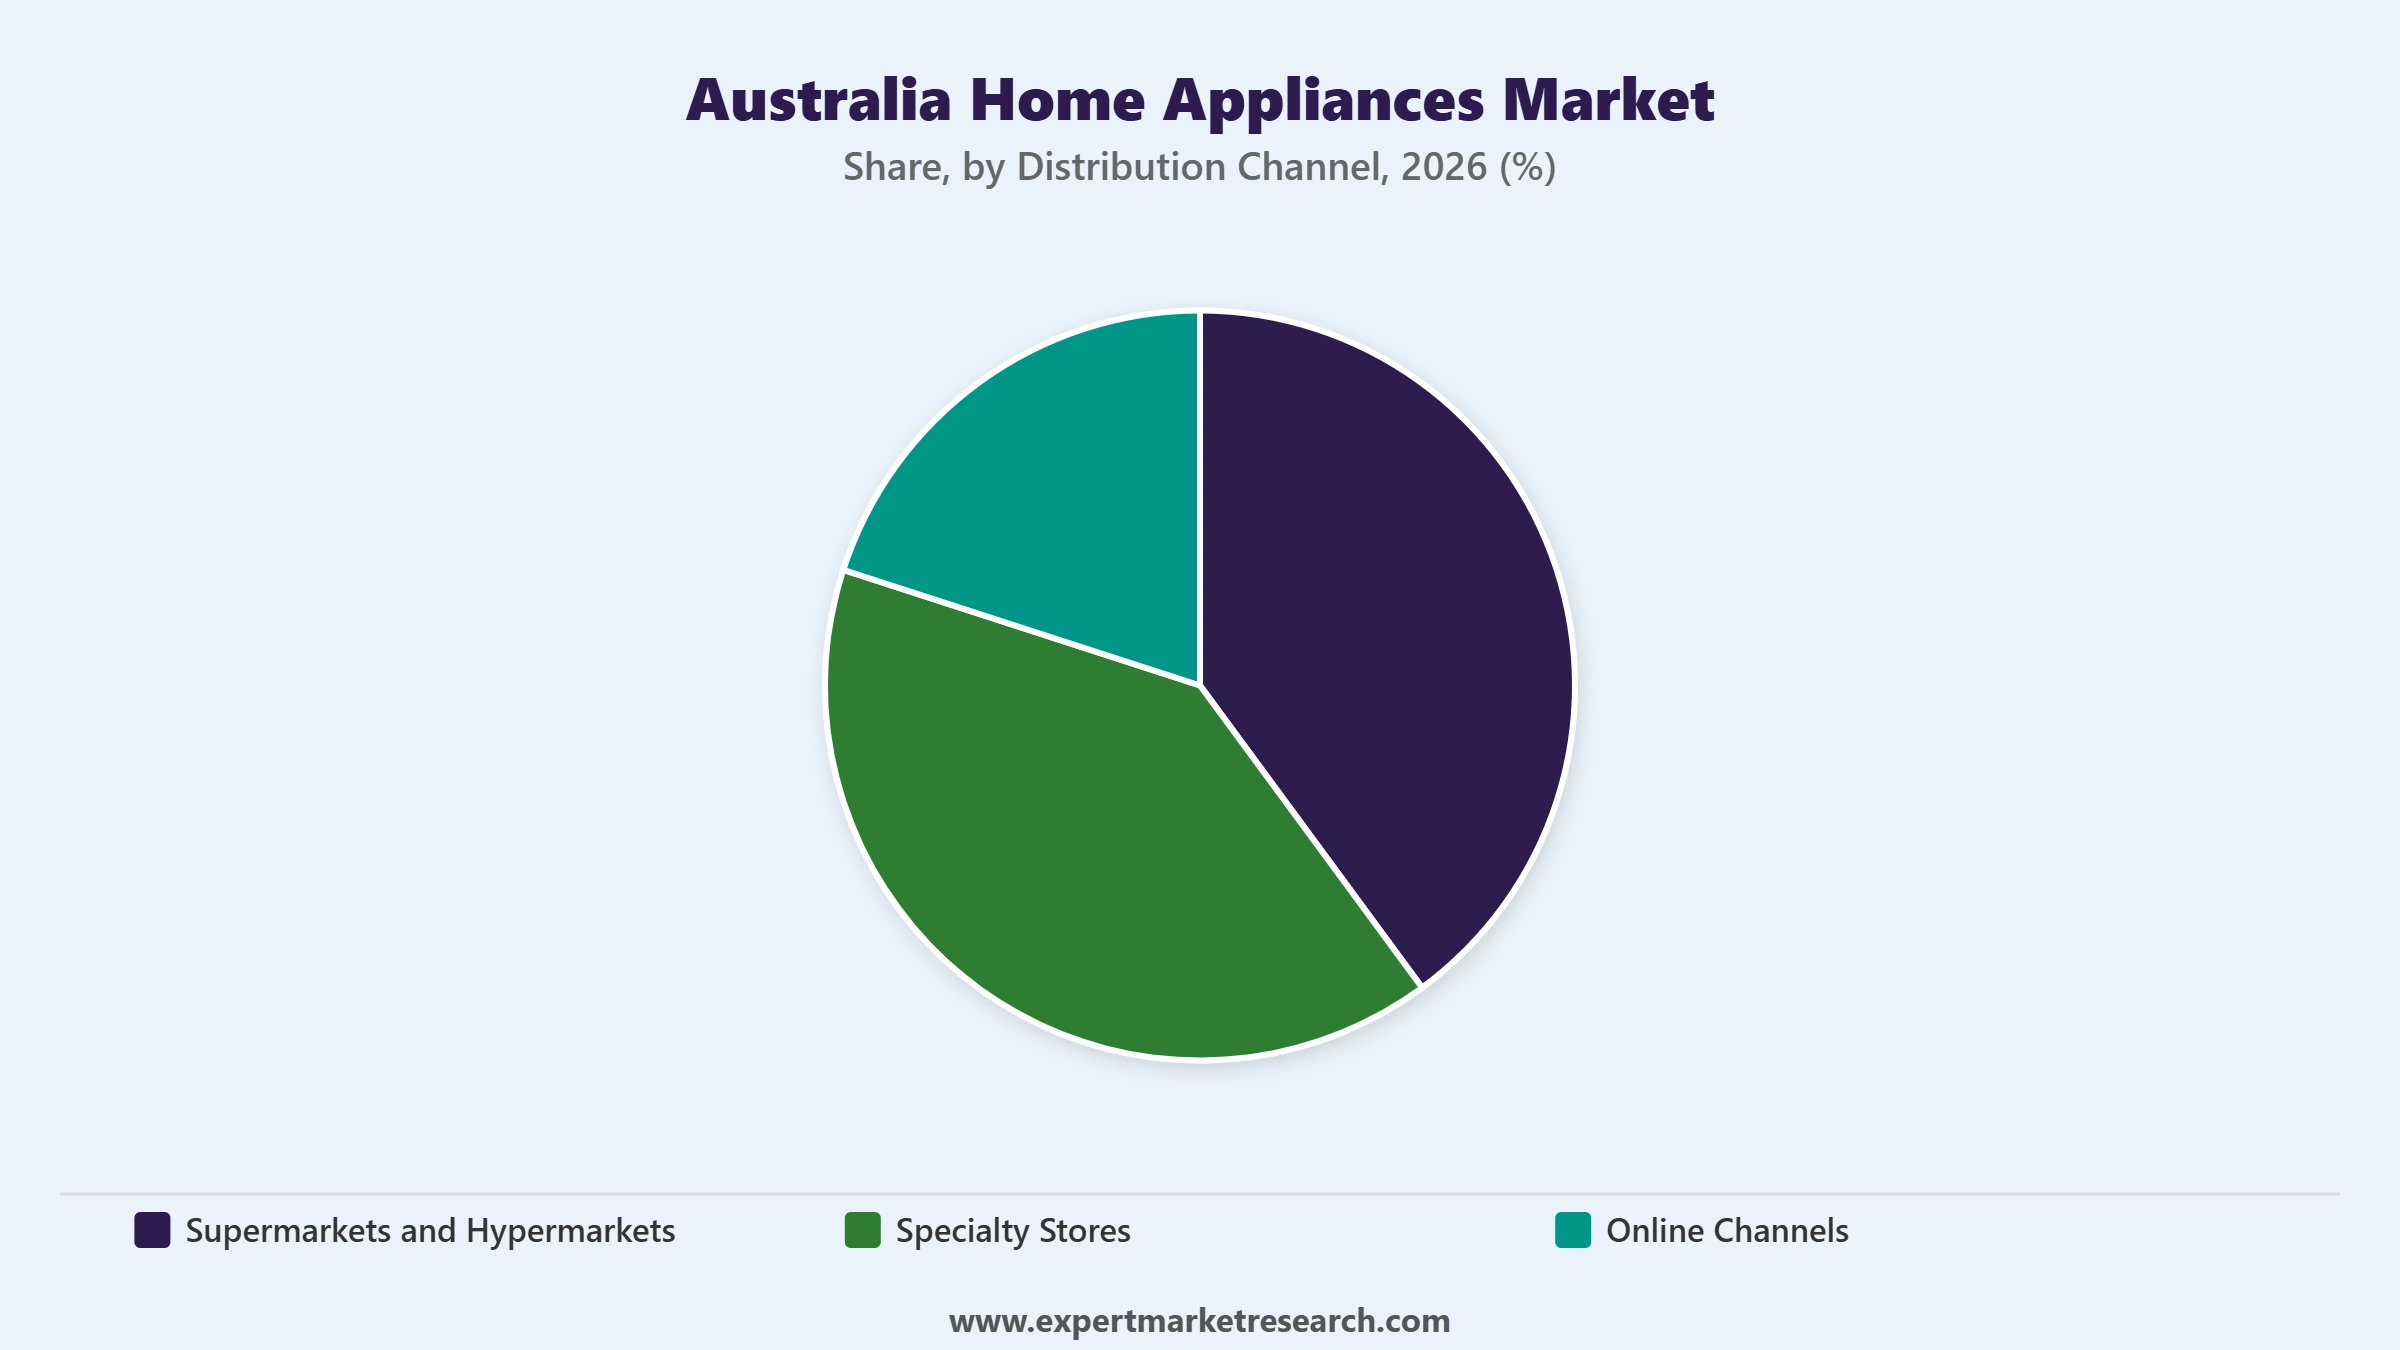
Key Insight: Broad product assortments and established retail networks keep supermarkets and hypermarkets as the leading distribution channel, while specialty stores continue to serve shoppers seeking expert product guidance for premium purchases. Online channels are registering the fastest growth as manufacturers expand direct to consumer platforms and subscription-based service models across the appliance sector.
Market Breakup by Region
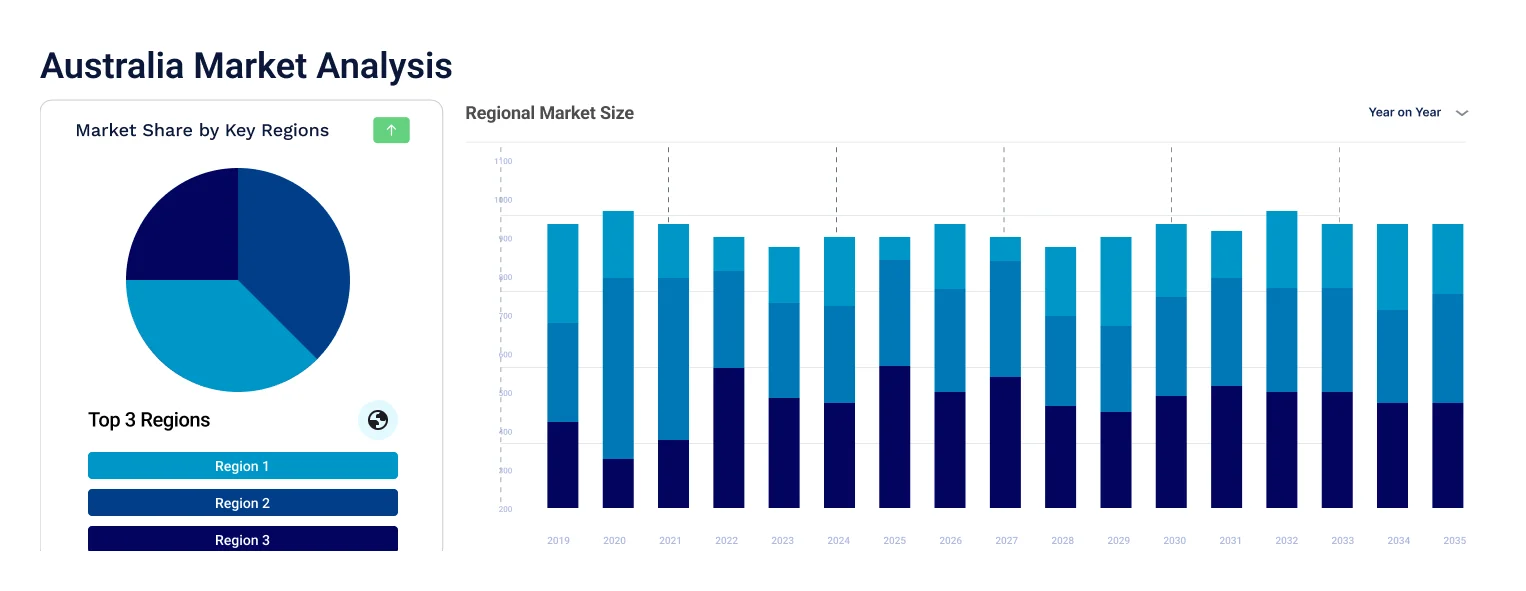
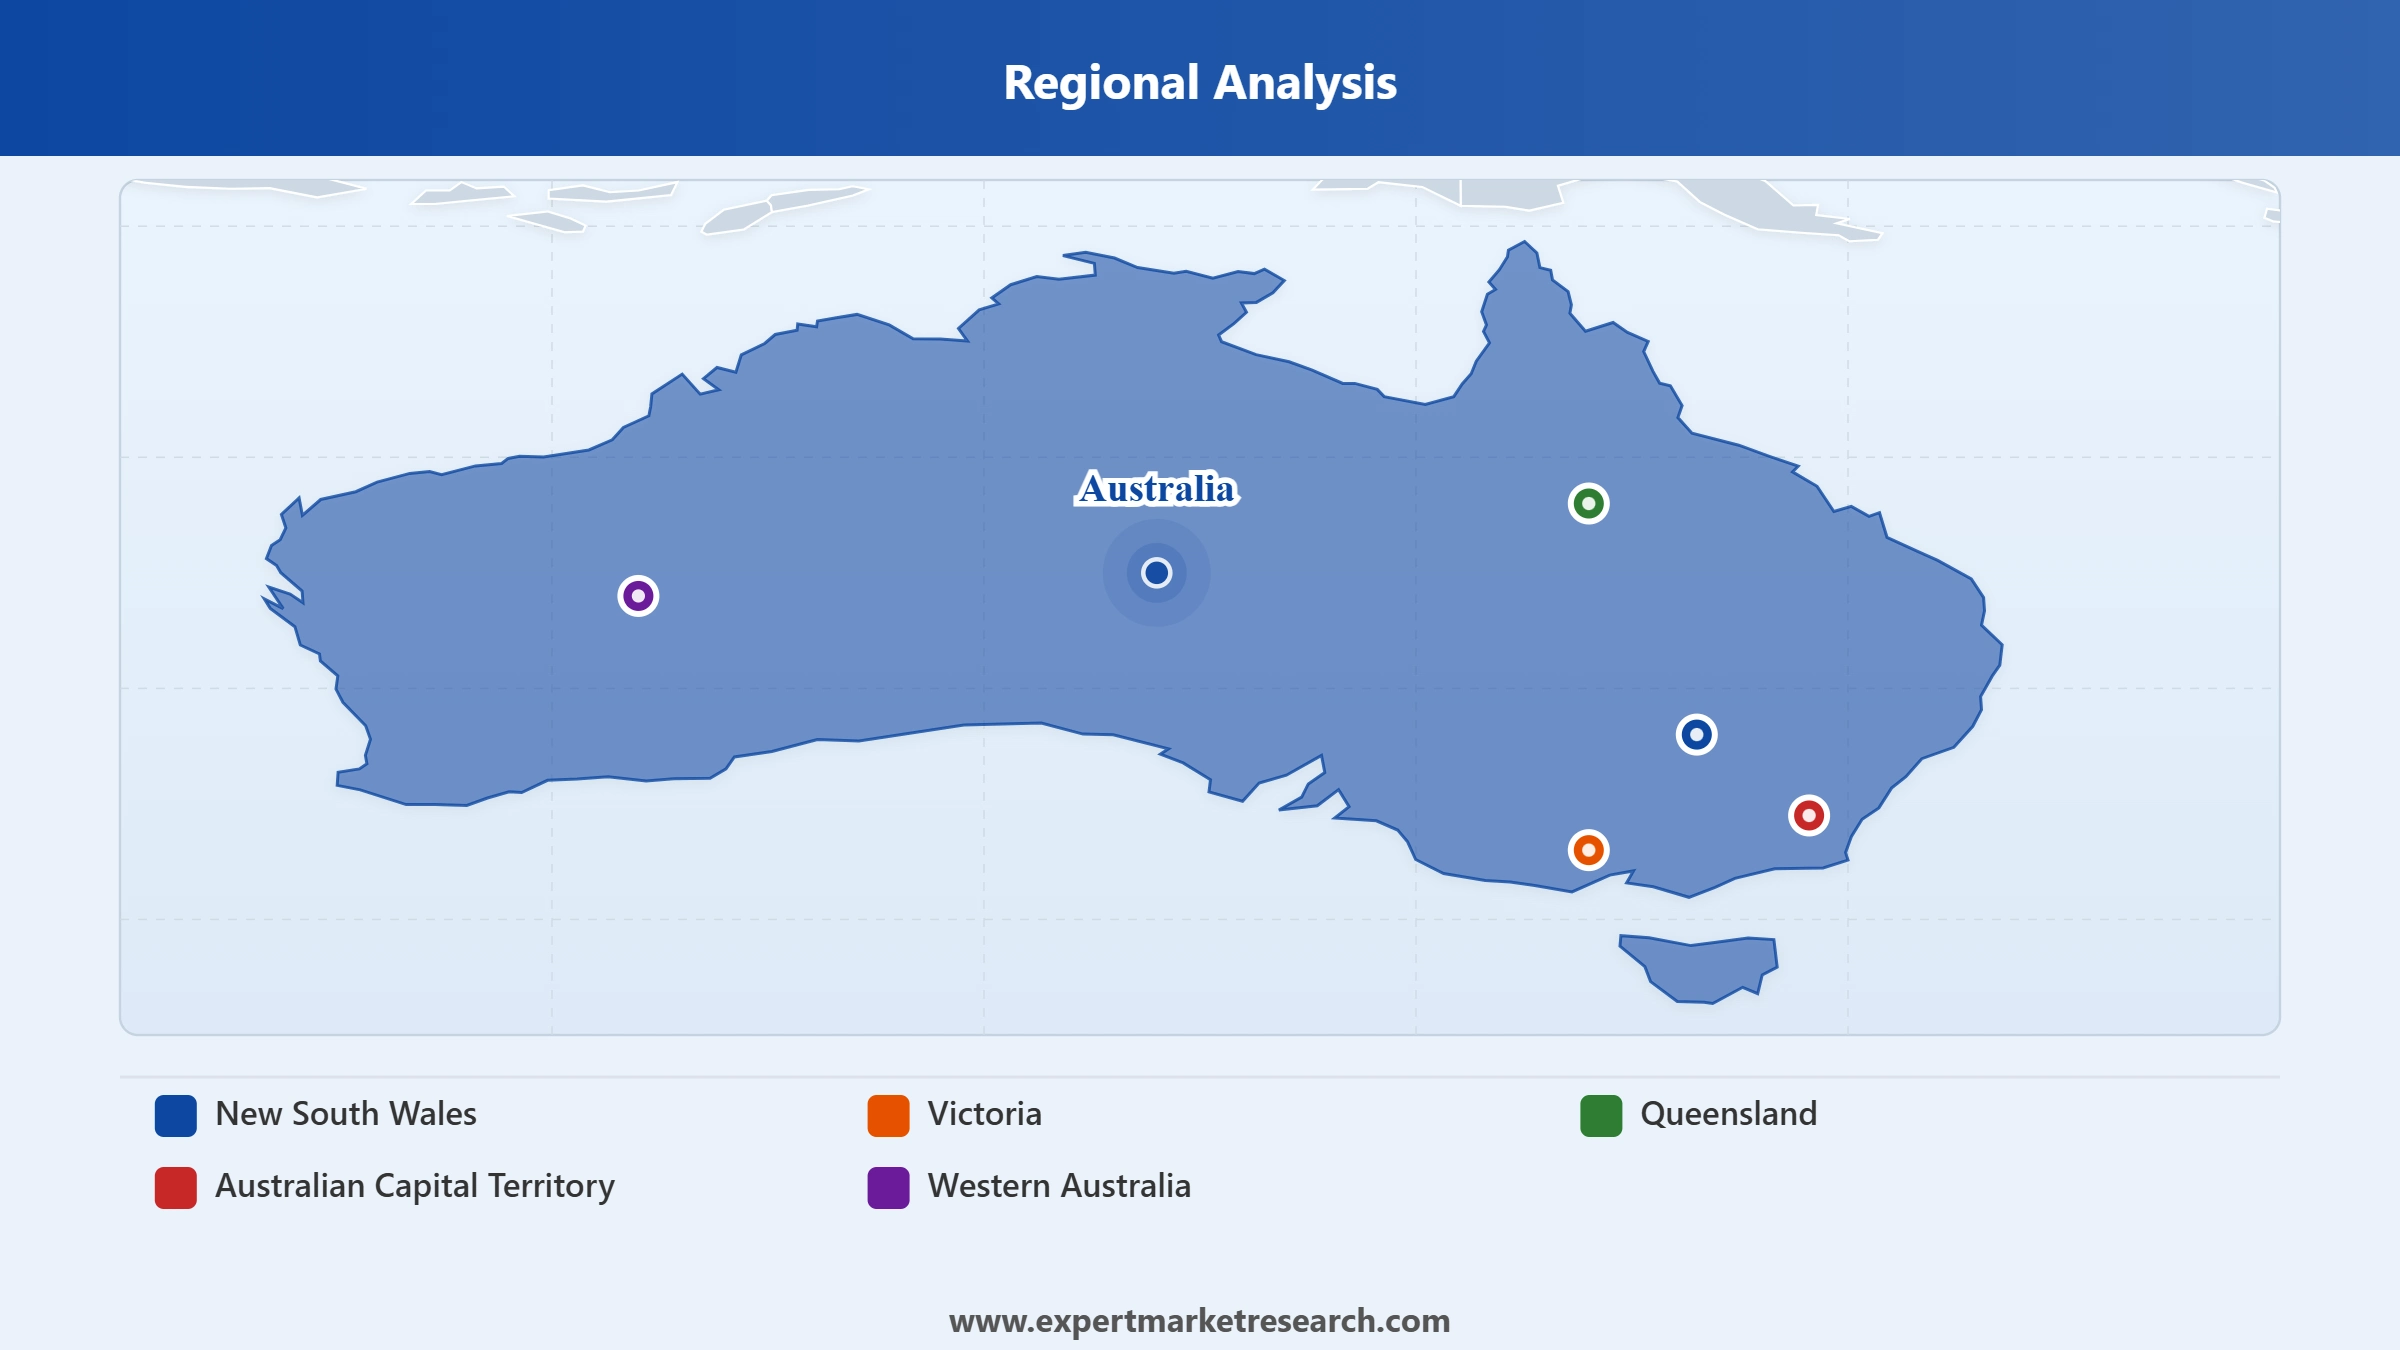
Key Insight: Regional dynamics in the Australia home appliances market continue to shape competitive strategies. Dense population centres and established retail infrastructure keep New South Wales at the front of regional demand, while Victoria sustains steady consumption through Melbourne's metropolitan household base. Western Australia benefits from resource sector income supporting premium appliance purchases, the Australian Capital Territory contributes a smaller but stable government employment driven market, and rising population growth combined with new housing construction is propelling Queensland toward the fastest regional growth.
Read more about this report - Request a Free Sample
By type, major appliances dominate the market through consistent replacement cycles tied to housing turnover
Major appliances account for the largest product type share of the Australia home appliances market, supported by consistent replacement cycles tied to housing turnover. In March 2026, Motley Fool Australia noted Australian consumer sentiment falling amid interest rate rises, prompting appliance retailers to lean more heavily on discounting and price matching to sustain major appliance sales volumes across refrigeration, laundry, and cooking categories, while premium segments held relatively firm amid the broader spending slowdown.
Read more about this report - Request a Free Sample
Smart home appliances are growing quickly as manufacturers embed AI and voice activated features across product ranges to differentiate premium offerings. In October 2025, four replacement GEMS energy performance determinations took effect for major appliance categories including dishwashers, raising testing standards and accelerating recertification cycles across the industry, prompting suppliers to fast-track compliant product redesigns and invest in energy monitoring features that support point of sale efficiency claims and long-term compliance readiness across the sector.
By distribution channel, supermarkets and hypermarkets dominate while online channels register the fastest growth
Supermarkets and hypermarkets account for the largest distribution channel share of the Australia home appliances market, offering broad product assortments through established retail networks. Established Australia home appliances companies continue to expand modern trade partnerships across major national retail chains, serving this consistent, high volume demand base through convenient one stop shopping destinations. Large format retail groups continue to lead the channel by scale, leveraging extensive store networks, competitive pricing strategies, and strong brand recognition to maintain their position as the preferred appliance purchase destination for most Australian households.
Read more about this report - Request a Free Sample
Online channels are growing quickly as manufacturers expand direct to consumer platforms and subscription-based service models across the sector. In May 2026, Electrolux launched a new generation of steam ovens and induction cooktops in Australia, extending its premium cooking portfolio to support built in kitchen electrification, with select models sold directly through its own online storefront alongside traditional retail partner listings across major online marketplaces and comparison-shopping platforms.
Read more about this report - Request a Free Sample
New South Wales dominates the market through dense population centres and established retail infrastructure
New South Wales leads the Australia home appliances market, anchored by dense population centres and established retail infrastructure across the Sydney metropolitan area. In November 2025, Winning Group, the Redfern based parent company of Winning Appliances and Appliances Online, was named a finalist in the Circular Economy category of the Banksia Foundation's NSW Sustainability Awards, recognising its regional environmental initiatives.
Queensland is registering the fastest regional growth as rising population growth and new housing construction drive demand. In December 2025, Haier confirmed a multiyear sponsorship extension with the Australian Open, entering its second year as part of a broader brand growth strategy targeting design focused consumers across Australia and New Zealand, with retail partnerships reinforcing local commercial channel visibility as new residential construction continues expanding across the state's rapidly growing southeast growth corridors, coastal population centres, and inland regional hubs.
The Australia home appliances companies are becoming increasingly competitive as major Australia home appliances companies invest in AI powered connectivity, seamless integrated design, and direct to consumer channels to differentiate their portfolios across small, major, and smart appliance categories. Companies are prioritising subscription-based service models, premium kitchen innovation, and sponsorship driven brand building to appeal to increasingly design conscious and tech literate Australian consumers. Established Australia home appliances companies are also deepening agentic AI capabilities, energy efficiency certification, and outdoor cooking category expansion to strengthen market positioning, while investing in online platform development to defend market share against rising direct to consumer competition.
Major Australia home appliances market players are also focusing on regional leadership transitions and category exits to capture growing demand across evolving product segments. Strategic emphasis on connected home ecosystems and energy performance compliance is allowing established companies to capture market share as consumer expectations around smart, sustainable appliances evolve. The market players continue to pursue partnerships with major sporting and cultural events, particularly through sponsorships and retail collaborations, to diversify brand visibility beyond traditional advertising while smaller specialist brands compete on design led differentiation to retain premium customers.
Founded in 1969 and headquartered in Suwon, South Korea, with its Australian subsidiary based in Sydney, Samsung Electronics is a global consumer electronics and home appliance manufacturer offering refrigerators, washing machines, and connected kitchen ecosystems. The company markets its appliances alongside its broader consumer electronics portfolio, including television and mobile device businesses.
Founded in 1934 and headquartered in East Tamaki, New Zealand, Fisher and Paykel is a premium appliance manufacturer owned by Haier Group, designing refrigerators, ovens, dishwashers, and laundry appliances. The company markets its products directly to Australian consumers alongside its traditional retail partnerships.
Founded in 1967 and headquartered in Munich, Germany, BSH Home Appliances is a global appliance manufacturer whose brand portfolio includes Bosch, Siemens, Neff, and Gaggenau across more than 50 countries. The company operates 39 factories worldwide, serving both mainstream and premium segments of the Australian appliance market.
Founded in 1958 and headquartered in Seoul, South Korea, LG Electronics is a global manufacturer of home appliances and consumer electronics offering refrigerators, washing machines, and AI enabled connected home solutions. The company operates through its dedicated Home Appliance Solution division, which recently integrated LG's robotics business to advance smart home technology development.
Other key players in the market include Panasonic Australia Pty Ltd., Arisit Pty Ltd., and Electrolux Home Products Pty Limited, among others.
*Please note that this is only a partial list; the complete list of key players is available in the full report. Additionally, the list of key players can be customized to better suit your needs.*
Unlock the latest insights with our Australia home appliances market trends 2026 report. Discover regional growth patterns, type and distribution channel economics, and key industry players. Stay ahead of competition with trusted data and expert analysis. Download your free sample report today and drive informed decisions in the market.
Saudi Arabia Home Appliances Market
South Korea Major Home Appliances Market


Upto 15% Off
USD
$2499 $2249
$3999 $3599
$4999 $4249
$5999 $5099


*While we strive to always give you current and accurate information, the numbers depicted on the website are indicative and may differ from the actual numbers in the main report. At Expert Market Research, we aim to bring you the latest insights and trends in the market. Using our analyses and forecasts, stakeholders can understand the market dynamics, navigate challenges, and capitalize on opportunities to make data-driven strategic decisions.*
In 2025, the market reached an approximate value of USD 4.32 Billion.
The market is projected to grow at a CAGR of 2.20% between 2026 and 2035.
The revenue generated from the home appliances market is expected to reach USD 5.37 Billion in 2035.
The market is categorised according to its type, which includes small appliances, major appliances, smart home appliances and others.
The key players in the market include Samsung Electronics Australia Pty Limited, Panasonic Australia Pty Ltd., BSH Home Appliances Pty Ltd., Fisher & Paykel Australia Pty Limited, Arisit Pty Ltd., LG Electronics Inc., and Electrolux Home Products Pty Limited, among others.
Investing in connected platforms, expanding localized service networks, co-designing with developers, optimizing supply chains, and leveraging data insights help stakeholders strengthen resilience and capture premium consumer value.
The market is categorised according to its distribution channel, which includes supermarkets and hypermarkets, specialty stores, online channels, and others.
Some Australian-owned kitchen appliance brands renowned for high-quality, locally designed products include Qasair for kitchen ventilation, Oliveri for sinks, Billi for water dispensers, Zip for boiling water taps, and Sussex Taps for faucets.
High energy expectations, fast design cycles, supply chain friction, and price competition pressure appliance makers while buyers demand better durability, smarter software, smaller footprints, and stronger after-sales support.
New South Wales dominates the market, supported by dense population centres and established retail infrastructure.
Major appliances hold the largest share, supported by consistent replacement cycles tied to housing turnover.
Explore our key highlights of the report and gain a concise overview of key findings, trends, and actionable insights that will empower your strategic decisions.
| REPORT FEATURES | DETAILS |
| Base Year | 2025 |
| Historical Period | 2019-2025 |
| Forecast Period | 2026-2035 |
| Scope of the Report |
Historical and Forecast Trends, Industry Drivers and Constraints, Historical and Forecast Market Analysis by Segment:
|
| Breakup by Type |
|
| Breakup by Distribution Channel |
|
| Breakup by Region |
|
| Market Dynamics |
|
| Competitive Landscape |
|
| Companies Covered |
|
Datasheet
One User
USD 2,499
USD 2,249
tax inclusive*
Single User License
One User
USD 3,999
USD 3,599
tax inclusive*
Five User License
Five User
USD 4,999
USD 4,249
tax inclusive*
Corporate License
Unlimited Users
USD 5,999
USD 5,099
tax inclusive*
*Please note that the prices mentioned below are starting prices for each bundle type. Kindly contact our team for further details.*
Flash Bundle
Small Business Bundle
Growth Bundle
Enterprise Bundle
*Please note that the prices mentioned below are starting prices for each bundle type. Kindly contact our team for further details.*
Flash Bundle
Number of Reports: 3
20%
tax inclusive*
Small Business Bundle
Number of Reports: 5
25%
tax inclusive*
Growth Bundle
Number of Reports: 8
30%
tax inclusive*
Enterprise Bundle
Number of Reports: 10
35%
tax inclusive*
How To Order

Select License Type
Choose the right license for your needs and access rights.

Click on ‘Buy Now’
Add the report to your cart with one click and proceed to register.

Select Mode of Payment
Choose a payment option for a secure checkout. You will be redirected accordingly.
Strategic Solutions for Informed Decision-Making
Gain insights to stay ahead and seize opportunities.

Get insights & trends for a competitive edge.

Track prices with detailed trend reports.

Analyse trade data for supply chain insights.

Leverage cost reports for smart savings

Enhance supply chain with partnerships.

Connect For More Information
Our expert team of analysts will offer full support and resolve any queries regarding the report, before and after the purchase.
Our expert team of analysts will offer full support and resolve any queries regarding the report, before and after the purchase.
We employ meticulous research methods, blending advanced analytics and expert insights to deliver accurate, actionable industry intelligence, staying ahead of competitors.
Our skilled analysts offer unparalleled competitive advantage with detailed insights on current and emerging markets, ensuring your strategic edge.
We offer an in-depth yet simplified presentation of industry insights and analysis to meet your specific requirements effectively.




