

Consumer Insights
Uncover trends and behaviors shaping consumer choices today
Procurement Insights
Optimize your sourcing strategy with key market data
Industry Stats
Stay ahead with the latest trends and market analysis.
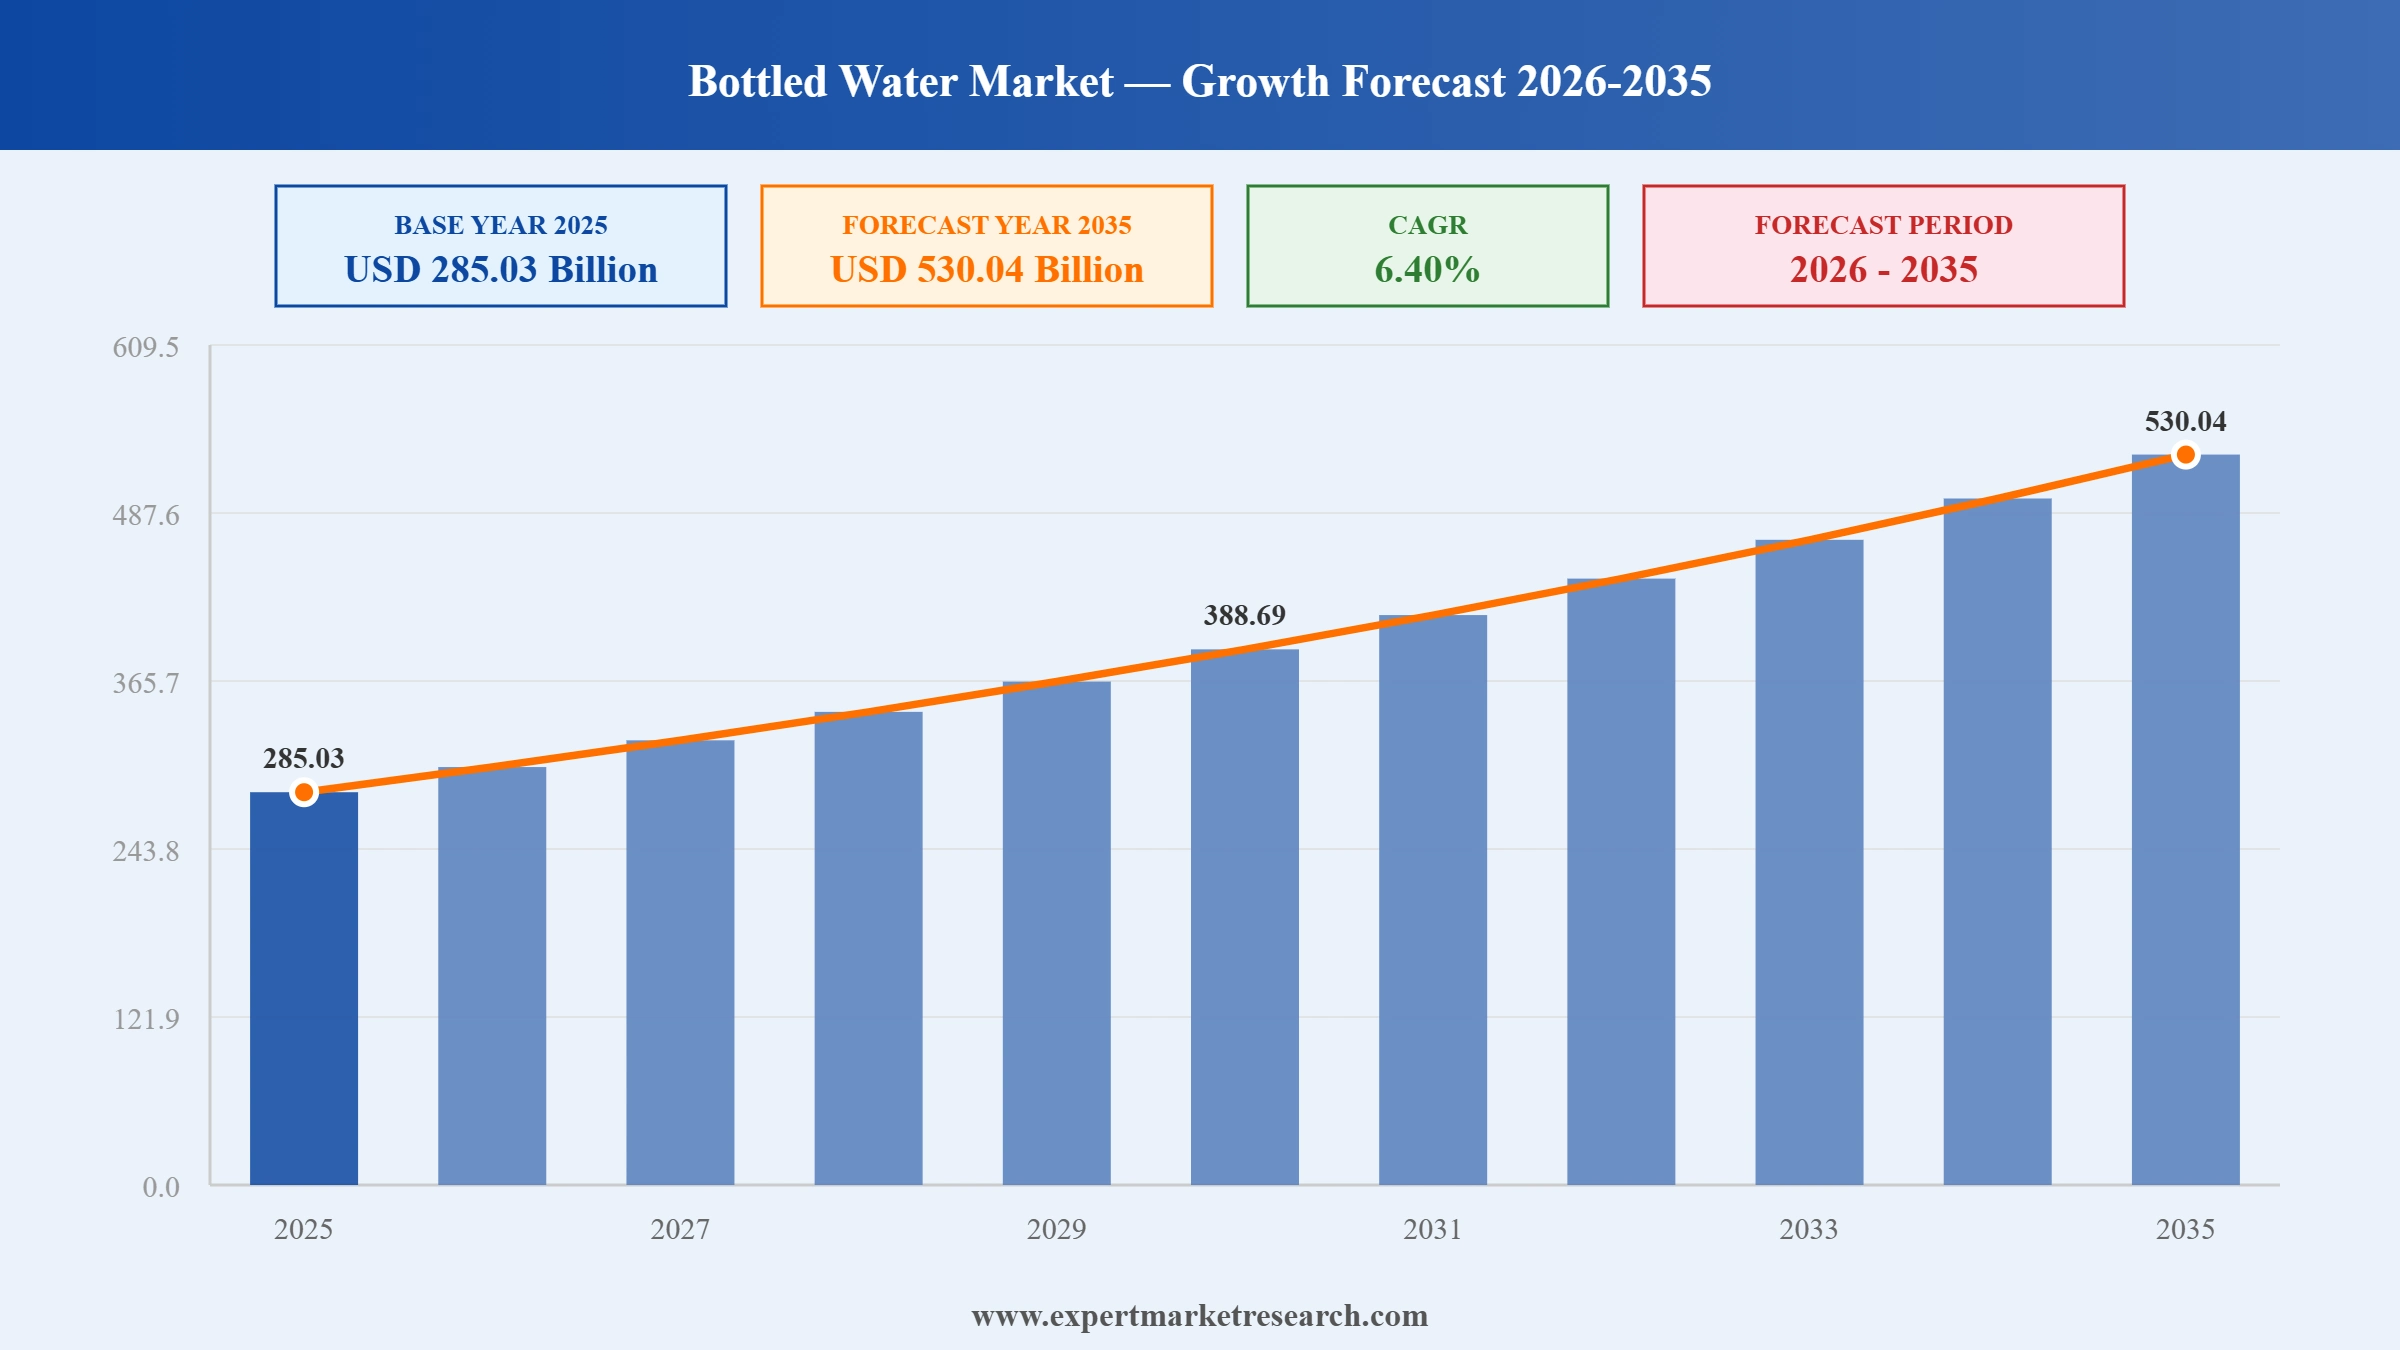
The global bottled water market reached a value of USD 285.03 Billion in 2025 and is projected to expand at a CAGR of around 6.40% during the forecast period of 2026-2035 to reach USD 530.04 Billion by 2035. Rising health and hydration awareness, expanding premium and flavoured water assortments, growing home and office delivery in the GCC, and a clear shift to recycled and biodegradable packaging across global brands.
Read more about this report - REQUEST FREE SAMPLE COPY IN PDF
| Global Bottled Water Market Report Summary | Description | Value |
| Base Year | USD Billion | 2025 |
| Historical Period | USD Billion | 2019-2025 |
| Forecast Period | USD Billion | 2026-2035 |
| Market Size 2025 | USD Billion | 285.03 |
| Market Size 2035 | USD Billion | 530.04 |
| CAGR 2019-2025 | Percentage | XX% |
| CAGR 2026-2035 | Percentage | 6.40 |
| CAGR 2026-2035 - Market by Region | Latin America | 6.9% |
| CAGR 2026-2035 - Market by Country | India | 7.1% |
| CAGR 2026-2035 - Market by Country | Saudi Arabia | 6.8% |
| CAGR 2026-2035 - Market by Type | Purified Water | 7.4% |
| CAGR 2026-2035 - Market by Distribution Channels | On Trade Channels | 9.7% |
| Market Share by Country 2025 | Brazil | 2.6% |
The global bottled water market is reshaped by sustainability led packaging shifts, premium and flavoured water growth, and rapid GCC and Asia Pacific growth. These shifts are pulling specifications toward recycled bottle materials, mineral water positioning, and direct to consumer delivery.
Coca-Cola European Partners acquired a regional bottled water brand in Italy to expand its portfolio of premium products, reinforcing the role of European still water acquisitions in the global bottled water competitive environment across hospitality and modern retail channels.
Danone partnered with a European recycling firm to enhance its sustainability efforts and achieve carbon neutrality by 2026, supporting recycled PET supply chains and brand positioning for Evian, Volvic, and Aqua bottled water portfolios across European and global markets.
Nestlé Waters launched a line of biodegradable bottles aimed at reducing plastic waste and appealing to eco conscious consumers, suggesting a structural shift in still water packaging toward bio based and recycled PET across Pure Life, S.Pellegrino, Perrier, and Acqua Panna lines.
Major bottled water brands accelerated commitments to recycled and recyclable bottles in 2025, with Nestlé, Coca-Cola, and Danone scaling RPET bottles across product lines and supporting global circular plastic packaging targets across multiple regions.
Sustainability Push: The global bottled water market is reshaped by recycled and biodegradable bottles, with Nestlé Waters biodegradable line and Danone European recycler partnership suggesting a structural shift in still and sparkling water packaging across global markets.
Premium Push: Global bottled water market growth is shaped by premium mineral water growth, with Coca-Cola European Partners acquiring an Italian regional brand and major European brands scaling premium glass bottle assortments across modern retail and hospitality.
HoReCa Push: The global bottled water market benefits from rapid GCC home and office delivery and on trade growth, with Masafi, Agthia, and Health Water Bottling scaling residential and commercial delivery across Saudi Arabia, UAE, and Kuwait.
Flavoured Push: The global bottled water market is lifted by flavoured and functional water launches, with leading global and regional brands adding sparkling, citrus, and vitamin enriched water lines across modern retail, convenience, and on trade channels.
Retail Push: Global bottled water market growth is aided by modern supermarket, hypermarket, and convenience store growth across fast-growing markets, anchoring everyday bottled water consumption and private label growth alongside branded SKUs.
The report of the Expert Market Research's titled "Global Bottled Water Market Report and Forecast 2026-2035" offers a detailed analysis of the market based on the following segments:
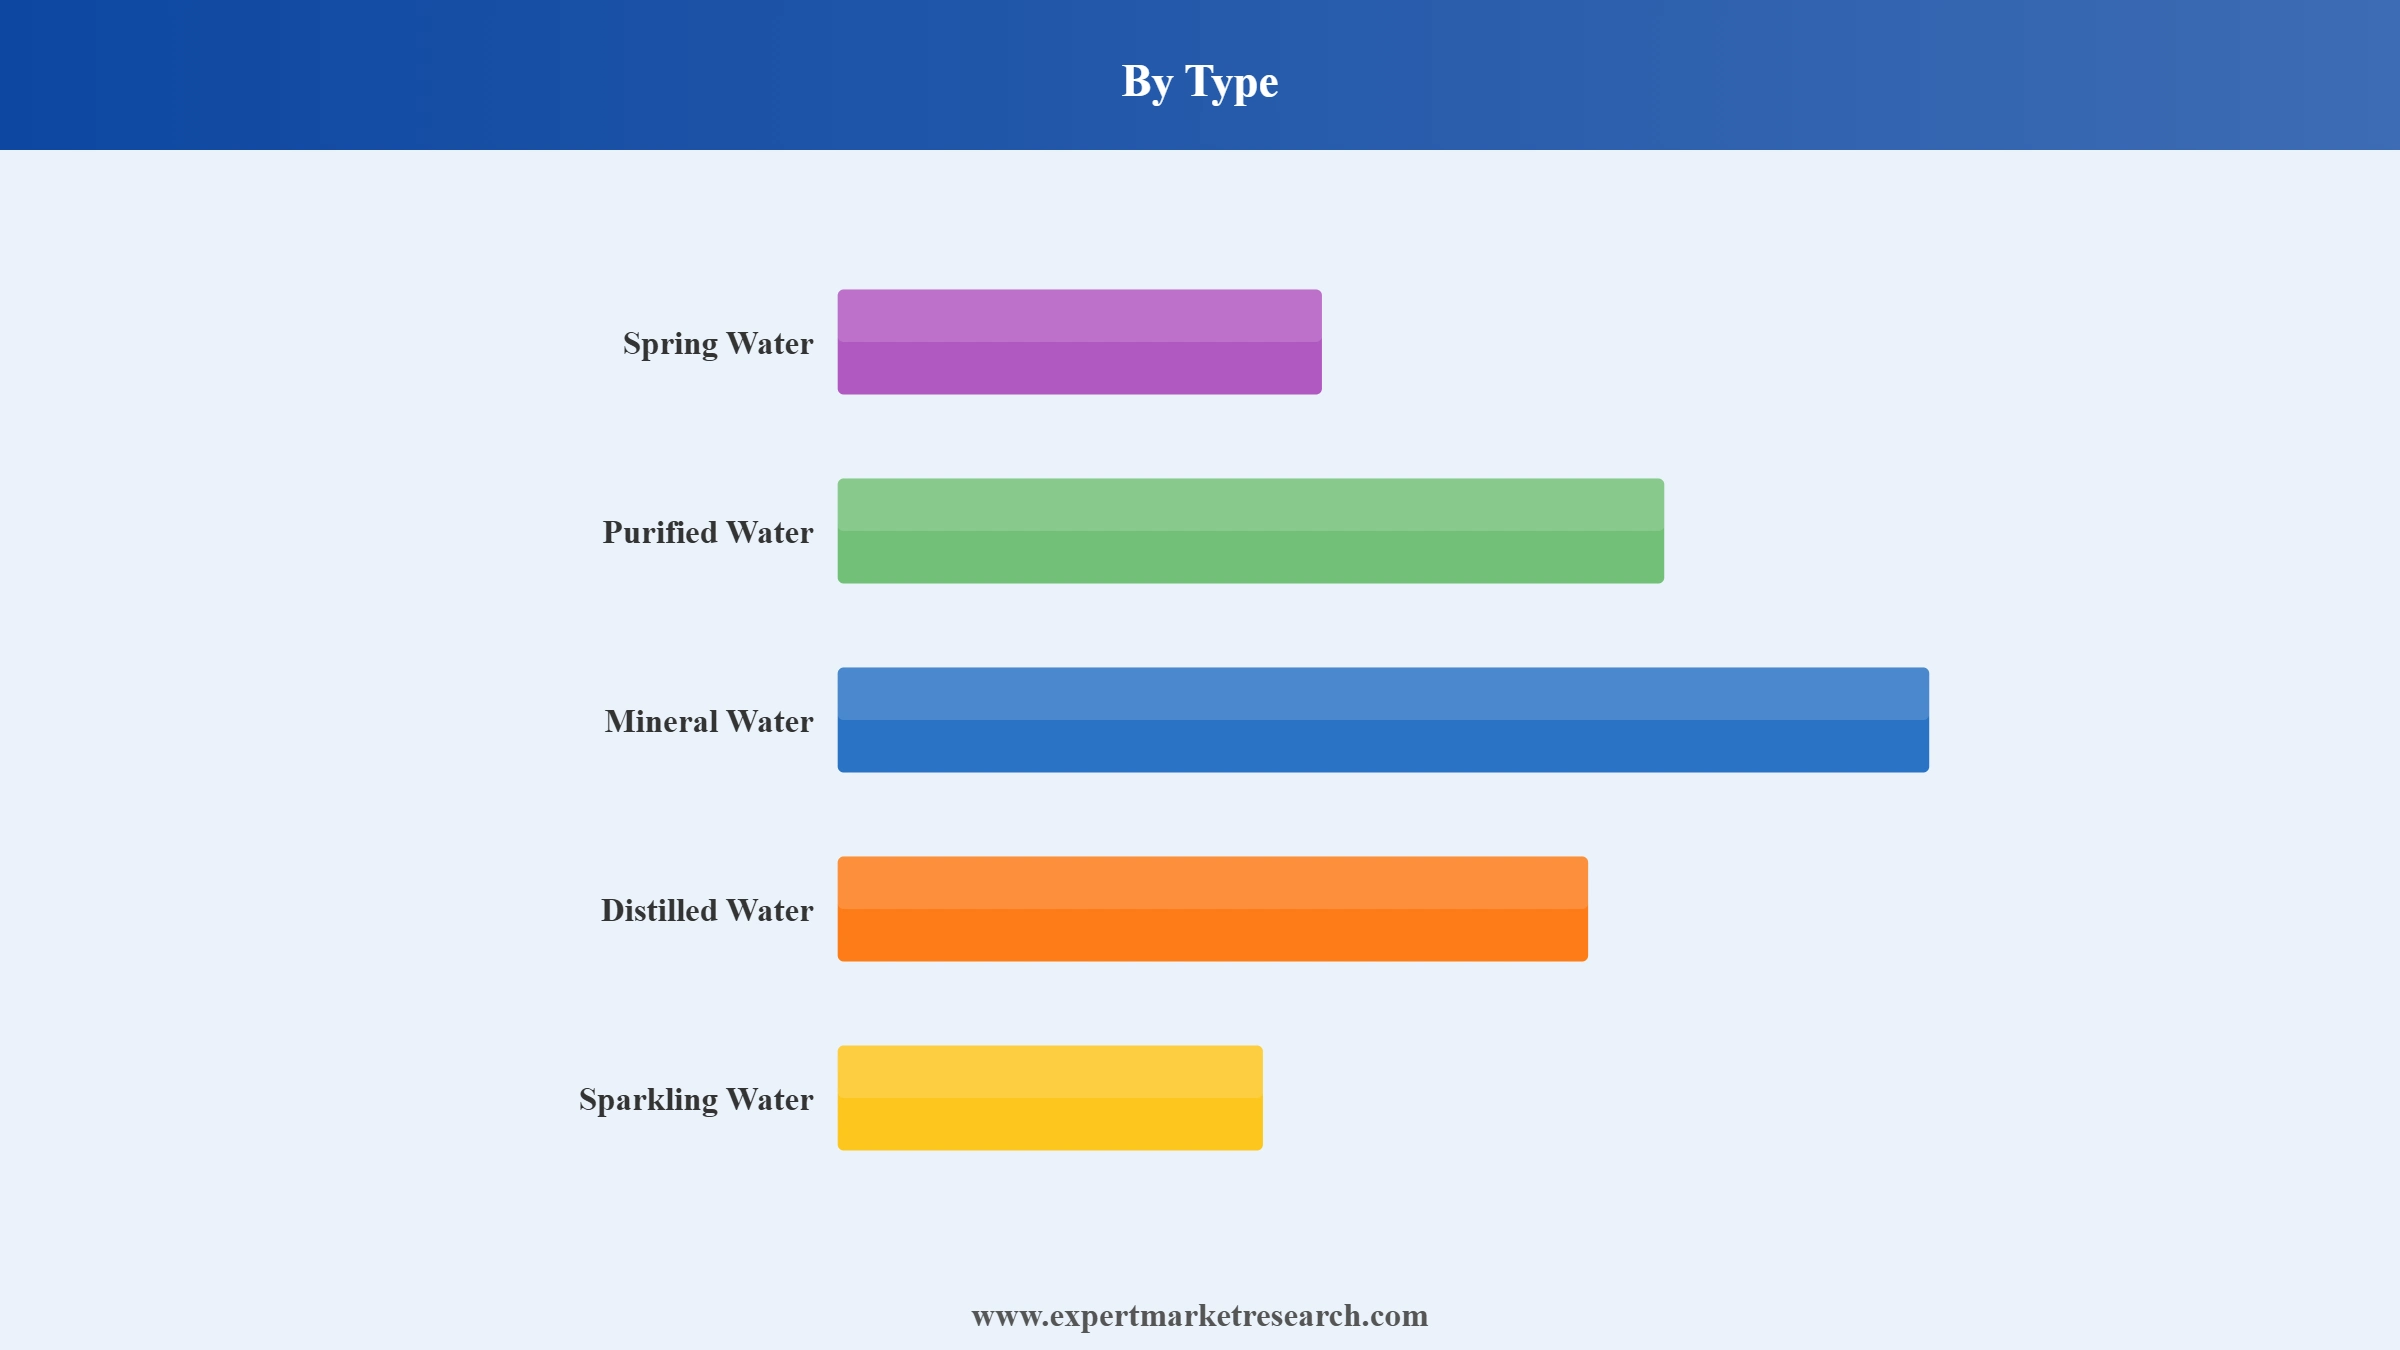
Market Breakup by Type
Key Insight: Spring water dominates the type segment in the global bottled water market with mass household consumption across all regions. Mineral water leads premium consumption, anchored by hospitality, on trade, and modern retail demand. Carbonated and flavoured water are the fastest growing pools, aided by health positioning, sugar reduction, and functional ingredient additions including vitamins, minerals, and natural flavours.
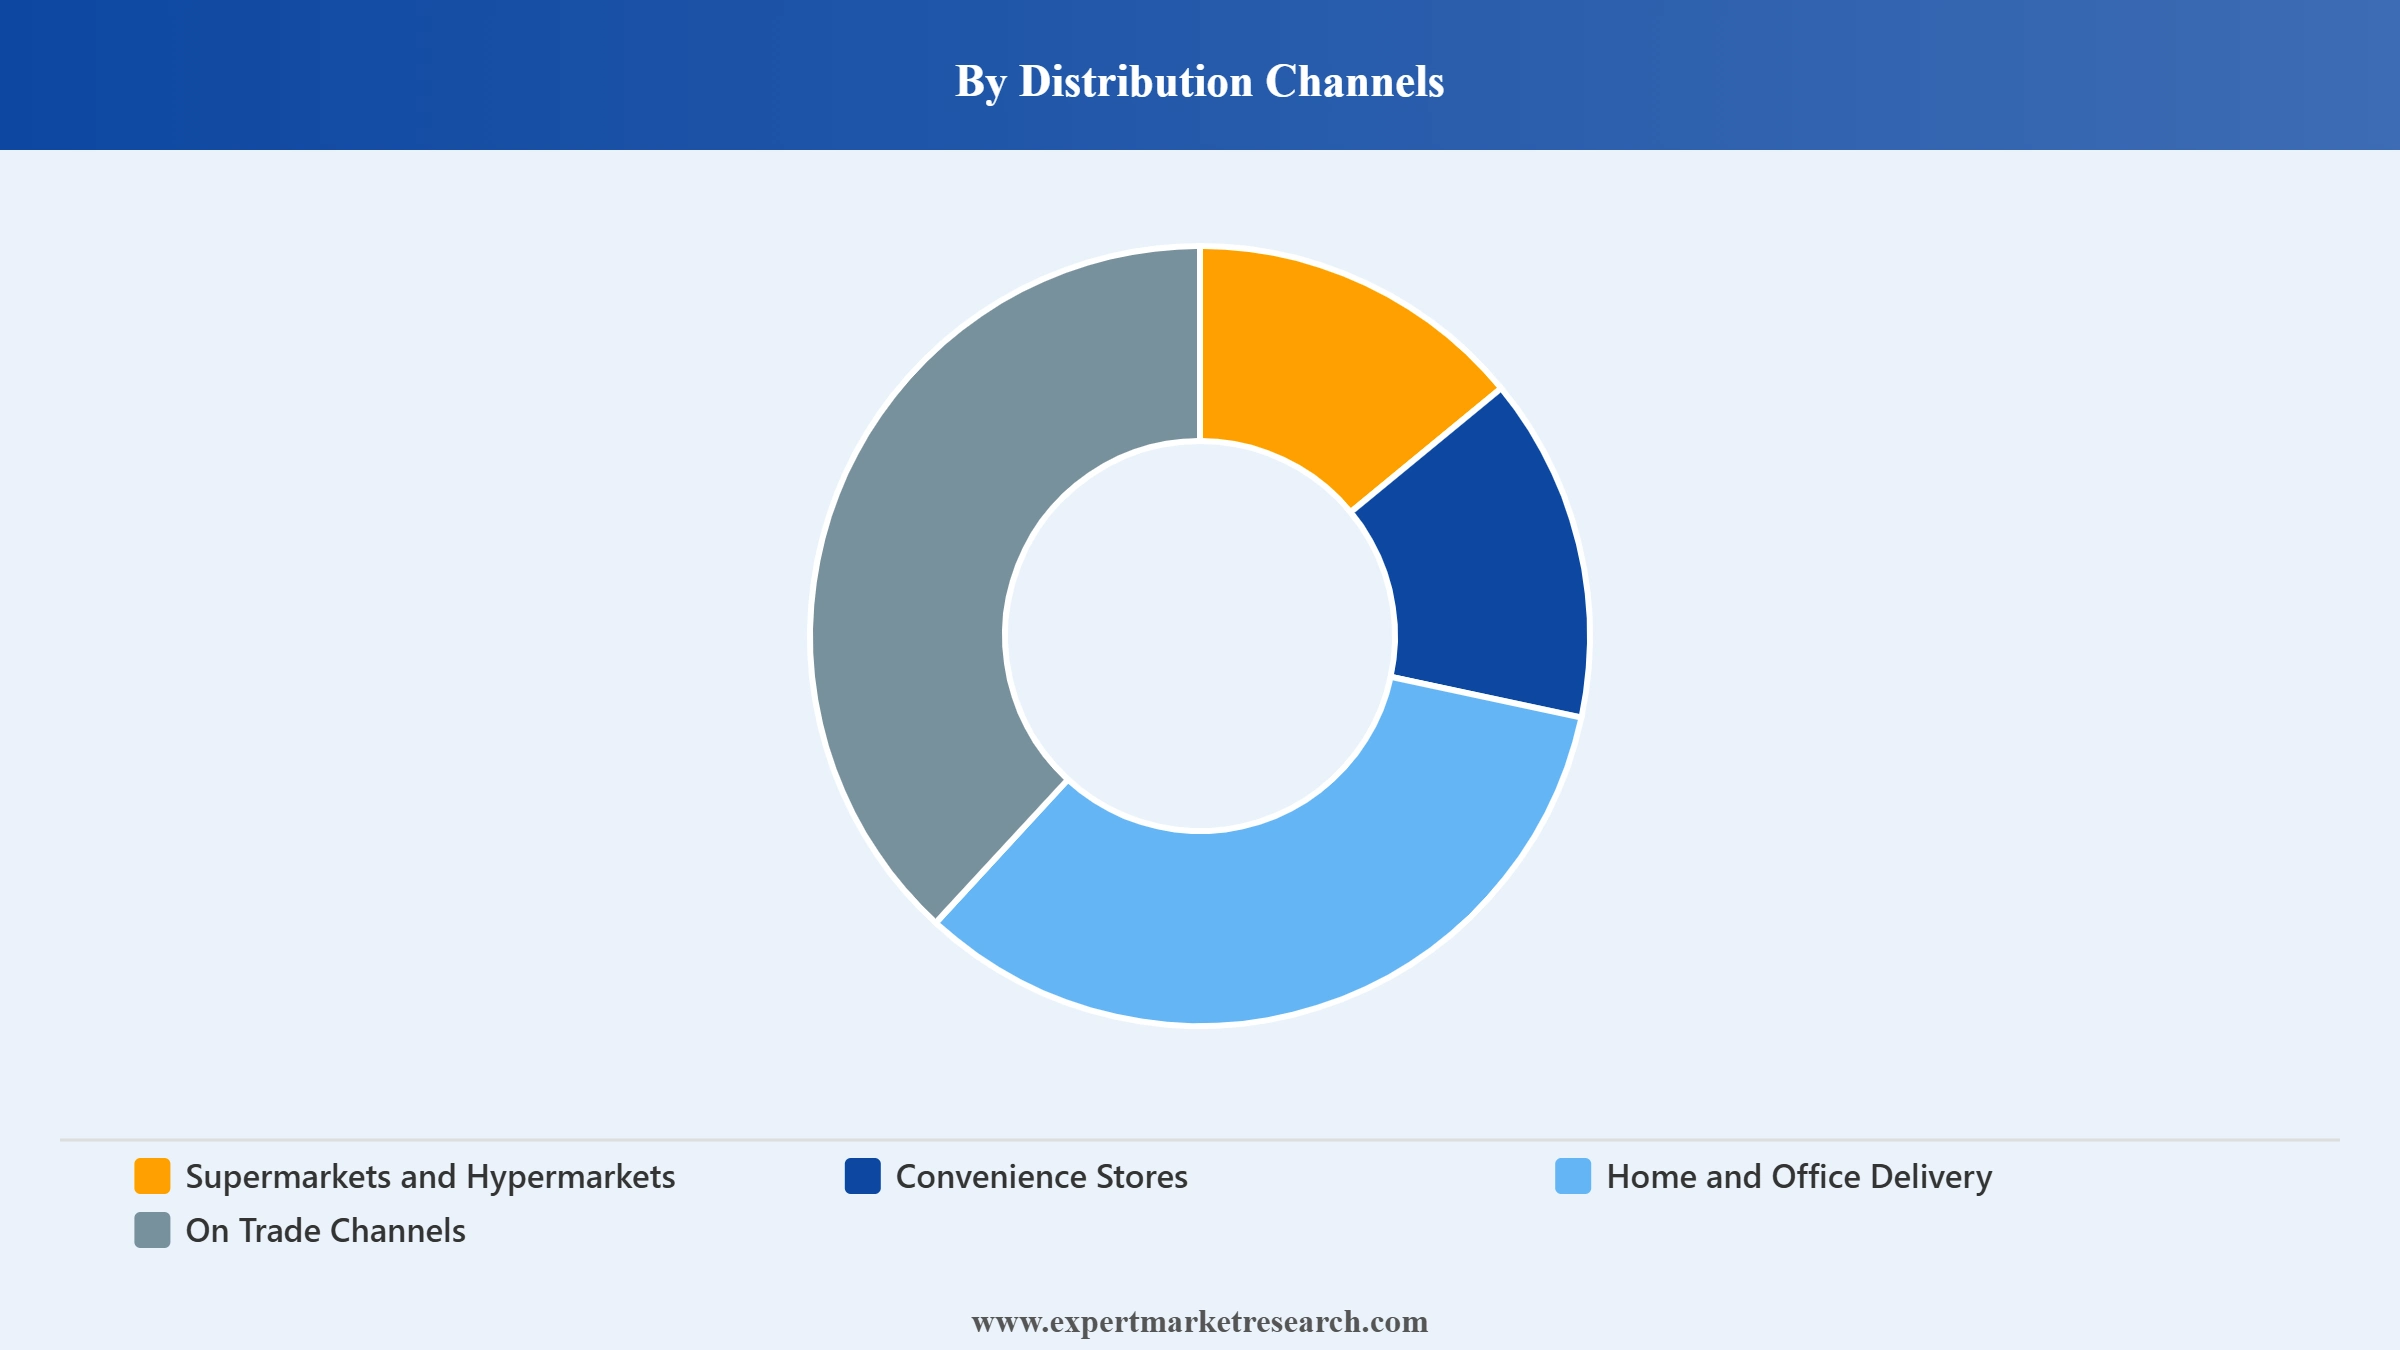
Market Breakup by Distribution Channels
Key Insight: Supermarkets and hypermarkets lead distribution, anchored by modern retail growth and multipack still water assortments. Broadly speaking, convenience stores are the fastest growing channel on impulse and single serve purchases. Home and office delivery is a high growth pool in GCC and metro markets, while on trade is anchored by hospitality, premium mineral and sparkling water. Others including vending and e-commerce complete the addressable channel pool.
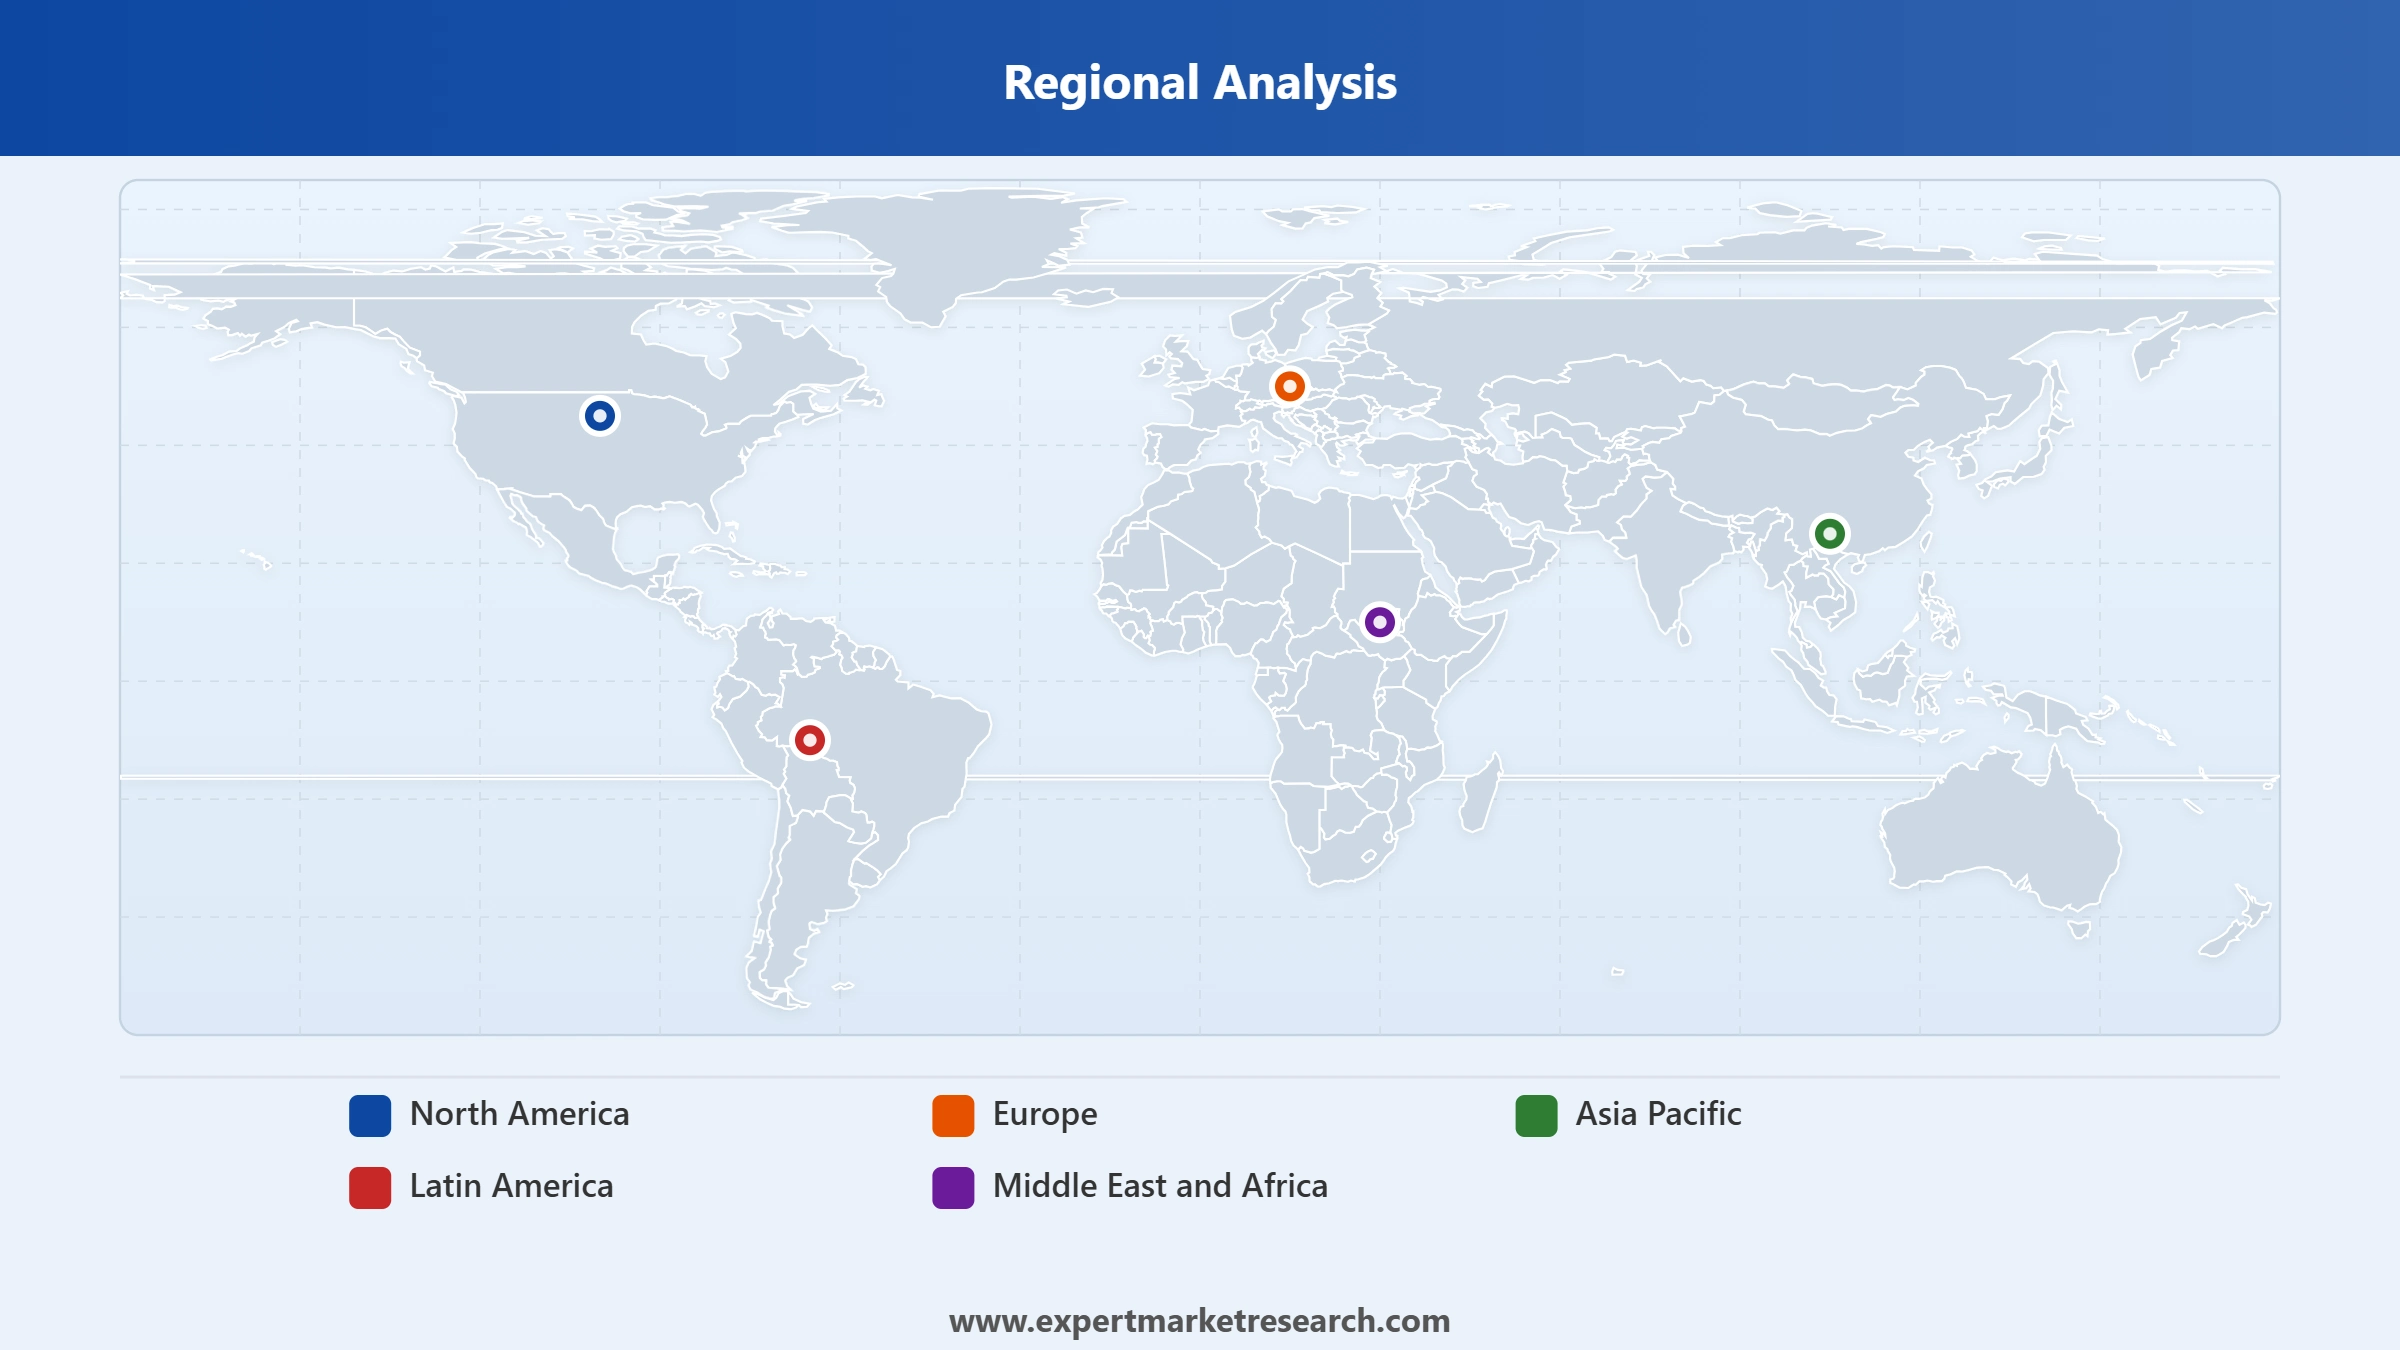
Market Breakup by Region
Key Insight: Asia Pacific dominates the global bottled water market on the back of China, India, and ASEAN household consumption, urbanisation, and rising disposable incomes. Broadly speaking, europe is anchored by premium mineral and sparkling water brands such as Evian, Volvic, S.Pellegrino, and Perrier. North America is led by US mass household and premium category growth. Middle East and Africa anchored by GCC home and office delivery and pilgrimage demand are the fastest growing region. Latin America is led by Brazil and Mexico household consumption.


Read more about this report - REQUEST FREE SAMPLE COPY IN PDF
By Type, Still Water dominates the market due to mass household consumption and brand assortment depth
Still water leads the global bottled water market with mass household consumption across all regions, anchored by single-serve PET, multipack, and family size SKUs across Nestlé Pure Life, Aquafina, Dasani, Masafi, and other major brands. Modern retail and convenience channels stock daily still water assortments at scale, supporting consistent volume across emerging and developed markets.
Mineral water leads premium consumption, anchored by European glass bottle brands and hospitality demand. On balance, June 2025 Coca-Cola European Partners acquisition of an Italian regional water brand illustrates how premium growth is supporting global bottled water market growth. Carbonated and flavoured water are the fastest-growing pools, aided by health positioning, sugar reduction, and functional ingredient additions.
Read more about this report - REQUEST FREE SAMPLE COPY IN PDF
By Distribution Channels, Supermarkets and Hypermarkets account for the dominant share of the market due to modern retail expansion and broad multipack still water assortments
Supermarkets and hypermarkets lead distribution in the global bottled water market, anchored by modern retail growth across all major regions and the breadth of still, mineral, and sparkling water multipack assortments. Their combination of high foot traffic, promotional shelf space, and private label water ranges makes them the primary volume channel for household and single-serve purchases globally.
Convenience stores are the fastest-growing channel on impulse and single-serve purchases, especially across Asia Pacific and the GCC. Home and office delivery is a high-growth pool in GCC metro markets, while on-trade distribution is anchored by hospitality-grade premium mineral and sparkling water. Vending machines and e-commerce channels complete the addressable distribution pool and are gaining share in select urban markets.
Read more about this report - REQUEST FREE SAMPLE COPY IN PDF
Middle East and Africa is the fastest-growing region driven by GCC home and office delivery and hospitality
Middle East and Africa is the fastest-growing region in the global bottled water market on the back of GCC home and office delivery, pilgrimage-related hospitality, and modern retail growth across Saudi Arabia, UAE, Kuwait, and Qatar. Masafi, Agthia, Health Water Bottling, and Dubai Crystal Mineral Water are scaling residential and commercial delivery routes, with on-trade hospitality supporting premium mineral and sparkling water across leading hotel and restaurant chains.
Asia Pacific dominates volume on the back of household consumption in China, India, and ASEAN, while Europe leads premium mineral water positioning. North America is anchored by US mass household and premium category growth, aided by Coca-Cola, Nestlé, Danone, and PepsiCo. Latin America is led by Brazil and Mexico household consumption. Together these regions support global bottled water market growth across multiple segments.
Read more about this report - REQUEST FREE SAMPLE COPY IN PDF
The global bottled water market is moderately consolidated, with global FMCG majors, GCC regional bottlers, and European premium mineral water brands competing across still, carbonated, flavoured, and mineral water. Competitive priorities revolve around recycled and biodegradable bottle commitments, premium positioning, home and office delivery, and modern retail and on trade reach.
Companies are differentiating through brand portfolios, recycled bottle commitments, premium glass packaging, and direct-to-consumer delivery models. Strategic moves include the June 2025 Coca-Cola European Partners regional brand acquisition, April 2025 Danone recycler partnership, March 2025 Nestlé Waters biodegradable bottle launch, and broader 2025 commitments by global brands.
Founded in 1976 and headquartered in Ras Al Khaimah, UAE, the company is a leading GCC bottled water and FMCG firm with still and flavoured water portfolios. Its operations include large bottling facilities, home and office delivery, and modern retail distribution across UAE, Saudi Arabia, Kuwait, and other GCC markets.
Founded in 1981 and headquartered in Dubai, UAE, the company is a UAE based bottled water producer marketed under brands including Oasis still and sparkling water. Its operations include large bottling and distribution across UAE supermarkets, convenience stores, on trade, and home and office delivery channels.
Founded in 1980 and headquartered in Jeddah, Saudi Arabia, the company is a Saudi bottled water producer with brands including Nova water. Its operations include large bottling facilities, modern retail and convenience distribution, and home and office delivery across Saudi Arabia and select GCC markets.
Founded in 2004 and headquartered in Abu Dhabi, UAE, the company is a UAE FMCG firm with leading bottled water brands including Al Ain water. Its operations span large bottling facilities, retail and on trade distribution, and home and office delivery across UAE, Saudi Arabia, and other GCC markets.
Other leading companies in the market are Dubai Crystal Mineral Water & Refreshments L.L.C, Hana Food Industries Company, and Others.
*Please note that this is only a partial list; the complete list of key players is available in the full report. Additionally, the list of key players can be customized to better suit your needs.*
Discover the latest insights on the global bottled water market 2026 with our comprehensive report. Stay ahead of the curve with valuable data on product innovations, consumer demand, and top growth regions. Whether you are launching a new product or expanding your brand, this report gives you the clarity you need. Download your free sample now and discover the key opportunities in the thriving Global Bottled Water.
Upto 15% Off
USD
$2499 $2249
$3999 $3599
$4999 $4249
$5999 $5099


*While we strive to always give you current and accurate information, the numbers depicted on the website are indicative and may differ from the actual numbers in the main report. At Expert Market Research, we aim to bring you the latest insights and trends in the market. Using our analyses and forecasts, stakeholders can understand the market dynamics, navigate challenges, and capitalize on opportunities to make data-driven strategic decisions.*
In 2025, the market reached an approximate value of USD 285.03 Billion.
The market is projected to grow at a CAGR of 6.40% between 2026 and 2035.
The market is estimated to witness a healthy growth in the forecast period of 2026-2035 to reach about USD 530.04 Billion by 2035.
Stakeholders are expanding rPET sourcing, localizing bottling operations, strengthening B2B contracts, integrating demand analytics, and developing premium and functional water portfolios to stabilize margins and volumes.
The market is expected to be augmented by the growing focus on healthy hydration, the rising demand for sustainable bottled water, and the increasing research activities to develop hybrid bottles.
The major regions in the market are North America, Latin America, the Middle East and Africa, Europe, and the Asia Pacific.
The major types of bottled water in the market are spring water, purified water, mineral water, distilled water, and sparkling water, among others.
The significant distribution channels in the market are supermarkets and hypermarkets, convenience stores, home and office delivery, and on trade channels, among others.
The key players in the market include Nestlé SA, The Coca-Cola Company, Danone S.A., PepsiCo Inc., FIJI Water Company LLC., BlueTriton Brands, Inc., SUNTORY HOLDINGS LIMITED, Gerolsteiner Brunnen GmbH & Co. KG, Nongfu Spring Co., Ltd., VOSS of Norway AS, Grupo Peñafiel, and Bisleri International Pvt. Ltd., among others.
Companies face tightening plastic regulations, water extraction scrutiny, volatile packaging costs, and rising logistics expenses, while defending margins against private labels and meeting retailer sustainability scorecards across markets.
Explore our key highlights of the report and gain a concise overview of key findings, trends, and actionable insights that will empower your strategic decisions.
| REPORT FEATURES | DETAILS |
| Base Year | 2025 |
| Historical Period | 2019-2025 |
| Forecast Period | 2026-2035 |
| Scope of the Report |
Historical and Forecast Trends, Industry Drivers and Constraints, Historical and Forecast Market Analysis by Segment:
|
| Breakup by Type |
|
| Breakup by Distribution Channels |
|
| Breakup by Region |
|
| Market Dynamics |
|
| Competitive Landscape |
|
| Companies Covered |
|
| Report Price and Purchase Option | Explore our purchase options that are best suited to your resources and industry needs. |
| Delivery Format | Delivered as an attached PDF and Excel through email, with an option of receiving an editable PPT, according to the purchase option. |
Datasheet
One User
USD 2,499
USD 2,249
tax inclusive*
Single User License
One User
USD 3,999
USD 3,599
tax inclusive*
Five User License
Five User
USD 4,999
USD 4,249
tax inclusive*
Corporate License
Unlimited Users
USD 5,999
USD 5,099
tax inclusive*
*Please note that the prices mentioned below are starting prices for each bundle type. Kindly contact our team for further details.*
Flash Bundle
Small Business Bundle
Growth Bundle
Enterprise Bundle
*Please note that the prices mentioned below are starting prices for each bundle type. Kindly contact our team for further details.*
Flash Bundle
Number of Reports: 3
20%
tax inclusive*
Small Business Bundle
Number of Reports: 5
25%
tax inclusive*
Growth Bundle
Number of Reports: 8
30%
tax inclusive*
Enterprise Bundle
Number of Reports: 10
35%
tax inclusive*
How To Order

Select License Type
Choose the right license for your needs and access rights.

Click on ‘Buy Now’
Add the report to your cart with one click and proceed to register.

Select Mode of Payment
Choose a payment option for a secure checkout. You will be redirected accordingly.
Strategic Solutions for Informed Decision-Making
Gain insights to stay ahead and seize opportunities.

Get insights & trends for a competitive edge.

Track prices with detailed trend reports.

Analyse trade data for supply chain insights.

Leverage cost reports for smart savings

Enhance supply chain with partnerships.

Connect For More Information
Our expert team of analysts will offer full support and resolve any queries regarding the report, before and after the purchase.
Our expert team of analysts will offer full support and resolve any queries regarding the report, before and after the purchase.
We employ meticulous research methods, blending advanced analytics and expert insights to deliver accurate, actionable industry intelligence, staying ahead of competitors.
Our skilled analysts offer unparalleled competitive advantage with detailed insights on current and emerging markets, ensuring your strategic edge.
We offer an in-depth yet simplified presentation of industry insights and analysis to meet your specific requirements effectively.


