

Consumer Insights
Uncover trends and behaviors shaping consumer choices today
Procurement Insights
Optimize your sourcing strategy with key market data
Industry Stats
Stay ahead with the latest trends and market analysis.
The global computational fluid dynamics (CFD) market size attained a value of USD 2.81 Billion in 2025. The market is further expected to grow in the forecast period of 2026-2035 at a CAGR of 11.70% to reach USD 8.50 Billion by 2035. The market for computational fluid dynamics (CFD) is being considerably expanded by technological advancements such as cloud-based solutions and high-performance computing (HPC) and the ever-growing demand for efficient product design. The sector is expected to witness veritable growth due to huge opportunities for optimization provided by automotive, aerospace, and energy applications to increasingly cater to the rising environmental issues. Other motivations that are spearheading CFD uptake include looming environmental challenges and increasing acceptance for sustainable practices.
What's really driving this momentum is the convergence of three forces happening simultaneously-computing power has become cheaper, software has become more accessible, and industries are under real pressure to cut development costs without sacrificing precision. According to the U.S. Department of Energy, over 70% of national laboratory supercomputing time in 2023 was allocated to fluid dynamics and climate modelling simulations. The International Journal of Heat and Fluid Flow reported that CFD-driven design iterations reduced wind tunnel testing by 40-60% in aerospace firms between 2020 and 2023 - a compelling cost case that's hard to ignore. Cloud-based CFD adoption saw a 50% year-on-year increase in compute hours consumed in 2024, driven primarily by SMEs and startups accessing on-demand HPC without heavy capital investment.
Compound Annual Growth Rate
11.7%
Value in USD Billion
2026-2035
The Computational Fluid Dynamics (CFD) market share reflects the growing use of simulation technologies across aerospace, automotive, energy, and healthcare sectors. CFD software enables engineers and researchers to analyze fluid flow, heat transfer, and turbulence with high accuracy, reducing reliance on costly physical prototypes. Market development is supported by advancements in high-performance computing, artificial intelligence integration, and cloud-based simulation platforms, helping organizations optimize designs efficiently and enhance product performance.
Increasing focus on energy-efficient solutions and environmental sustainability contributes to CFD adoption. Industries utilize CFD for applications such as aerodynamic optimization, thermal management, and renewable energy system design. Key players strengthen their market presence through strategic collaborations, product innovations, and regional expansions. With the rising use of digital twin technology and predictive analytics, the CFD market continues to show steady momentum in various sectors.
Demand for effective product optimization and design
The rise of efficient product design and optimization is an important trend in the CFD market. Companies are able to make real prototypes through CFD simulations and thus manage to significantly reduce the expenses for physical testing and experimentation, in turn accelerating the product development cycles. On the one hand, this indicates efficient designs to market faster and at an affordable cost. CFD enables engineers to optimize energy efficiency and performance for an environment-friendly designs by simulating the fluid flow and the heat transfer process. It has, therefore, become vital that industries come up with cost-effective designs and optimized products with energy efficiency in their quest for competitive advantages. Additionally, to align with the sustainability perspective, CFD will play a huge role in reducing waste during manufacturing processes.
Growing environmental awareness and efforts to promote sustainability
The rising demand for CFD simulation to analyze fluid dynamics and optimize energy-efficient systems for concerned sustainable development is backed up by a set of stringent regulations for lower environmental footprint. With growing environmental issues, organizations are taking on sustainable practices to meet such standards. CFD is at the heart of minimizing emissions and optimizing resource utilization, helping organizations make environment conscious decisions while increasing competitiveness, boosting the overall market outlook. Use of CFD technology in manufacturing eco-friendly products is fast becoming an essential tool for companies to gain the competitive edge in an increasingly eco-conscious global market.
Cloud-based solutions and high-performance computing (HPC) advancements
Developments in computing technology and cloud-based solutions are driving significant changes in the CFD space, thus fueling market growth. The complex simulations possible with manufactured high-performance computing (HPC) clusters is improving the design and optimization processes, bringing in more iterations for improved accuracy when modeling real-world scenarios. Such advantageous developments empower business enterprises to handle a higher amount of data and perform a greater level of detail inside the CFD simulation. Cloud resources can be flipped to many uses: scalability and flexibility, saving one from investing in unusually expensive on-premises infrastructure. It also makes the collaboration part easier; different teams located in different areas can work together easily. With both HPC clusters and cloud-based solutions, companies can execute their remote collaborations much more efficiently and accurately while speeding up product development and cheaper operational costs.
Application of CFD in a wider range of industries
The versatility of CFD technology is driven by its widespread adoption across several industries. CFD is utilized for aerodynamic analysis in the aerospace industry and is necessary for more fuel-efficient and safer aircraft designs. CFD is the solution used in the automotive manufacturing in optimizing engine performance and vehicle aerodynamics for reducing emissions and enhancing fuel efficiency. CFD also help the energy sector by ensuring optimized energy production through enhanced combustion processes and highly efficient turbines. Thus, this growing body of applications turns out to be useful in tackling the critical value points of sustainability and performance optimization, aligning it with the modern industrial landscape in relevance and scope further.
Expert Market Research report offers forecasts for 2026-2035 at the regional and global levels, as well as an analysis of the key trends in each market sector. The market has been categorized by end-user segment and deployment model in per the industry research.
Read more about this report - REQUEST FREE SAMPLE COPY IN PDF
Breakup by Deployment Model
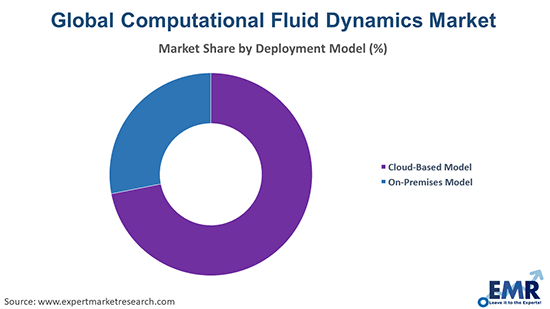
The majority of market share is accounted for by the on-premises model.
The cloud-based model in computational fluid dynamics offers ample opportunities because of the scalability and flexibility it provides. The model enables users to apply extensive CFD tools without substantial capital investment in computing facility or on-site infrastructure. This becomes a huge advantage in industries where teams can simply tap the cloud resources as needed. This model allows working remotely, which could mean geographically separated teams collaborating without hassles. As a result, product development can be more expeditious and cost-effective.
In contrast to the cloud model, the on-premises model of CFD deployment is favored by companies which require complete control over their data and their computational resources. In this model, through the utilization of in-house servers and infrastructure, businesses can address critical needs, such as data security and information confidentiality, especially in industries dealing with sensitive information. In addition, this deployment model allows for consistent access to CFD applications without the need to rely on specific internet connections. However, it entails a substantial initial investment on the part of hardware, software, and maintenance. The on-premises model is better suited for big corporations with enough resources dedicated to an IT team, creating a stable and secure environment to execute complex simulations or applications that deal with high volumes of data.
Breakup by End-User
The biggest market share is held by aerospace and defense.
The automotive sector is a huge consumer of CFD technology, CFD has wide application in the areas of engine performance optimization and vehicle aerodynamics design. Simulating airflow and heat transfer helps in designing cars more fuel efficient, reduce aerodynamic drag, and enhance safety features. It expedites products in development and allows for the creation of more sustainable and cost-effective automotive designs.
CFD simulations are being increasingly used to describe fluid flow in the aerospace and defense concepts. It helps to design aircraft that are not only fuel-efficient but also safer. The thermal management in the microwave high-altitude drone was aided in the successful completion of complex systems in conjunction with the reliability requirements, allowing higher efficiency performance in the aerospace industries through the use of CFD technology.
CFD plays an important role in the electrical and electronics industry, specifically in the design and optimization of heat dissipation systems for various components such as circuit boards and semiconductors. By simulating thermal behavior and fluid flow, CFD enables engineers to create designs that guarantee product efficiency and dependability, reducing energy losses while optimizing performance.
CFD is a technique used by operators of industrial machinery to maximize performance and efficiency in precise and complex systems including compressors, turbines, pumps, and launches. Fluid dynamics simulations can identify potential problem areas, such as inefficiencies or obstructions in fluid flow. Recognition and elimination help optimize the performance of the system and minimize energy consumption, bringing greater efficiency into the picture.
The energy sector widely uses CFD technology to improve turbine efficiencies, optimal combustion systems for heat, and energy production. Simulating the flows of air and fuel through CFD adds to the generation of performance for renewable technologies, optimization efforts within wind turbines and solar thermal systems, as well as traditional energy generation methods that add up in sustainability and energy efficiency.
CFD is relied upon to model and optimize chemical reactions and fluid flows through reactors and pipelines. CFD assists engineers in earning efficiencies in their manufacturing processes, decreasing waste, and designing more sustainable and cost-effective production systems through simulation of mixing processes, heat transfer, and reaction kinetics.
Breakup by Region:


Europe accounts for a considerable share of the CFD market with demand coming from the strengths of automotive, aerospace, and energy industries. Sustainability and energy efficiency are the major driving forces accelerating the adoption of this tool in Europe, among others, for product design optimization. Additionally, stringency in environmental regulations in Europe promotes the application of CFD for reducing emissions and optimizing resource utilization.
The CFD market in the Asia Pacific region witnesses high growth in demand owing to expanding industrialization in countries like China, India, and Japan. The market growth is supported by well-developed automotive and electronic industries which increasingly use CFD for design optimization as well as performance enhancement of products.
North America is still in a position of dominance in the CFD market owing to application integrations mainly auto, aerospace and energy. The high-performance computing infrastructure that this region boasts is immensely beneficial for processing these complex CFD simulations. In addition, North American businesses are highly focused on creating novel products, leaning toward sustainability.
The energy, oil and gas, and manufacturing sectors are boosting the CFD adoption in the Middle East and Africa (MEA) region. Given the region's emphasis on energy efficiency and sustainability, CFD is essential to the optimization of processes like fluid dynamics and combustion. The market is still developing, though, and cloud-based CFD solutions are becoming increasingly popular.
The CFD market in Latin America is expanding steadily due to its growing application in the manufacturing, energy, and automotive industries. The use of CFD for energy-efficient planning and process optimization is driven by the region's increasing need to be efficient and sustainable in its resource usage. Infrastructure constraints and financial concerns cause adoption to lag behind other regions.
The market for computational fluid dynamics is competitive, with key players concentrating on creating extremely advanced CFD software that produces increasingly accurate simulations. In addition to providing cloud-based CFD solutions to boost scalability, the user interfaces are being improved to make CFD applications more approachable and intuitive. Businesses can provide specialized CFD solutions to industries like aerospace, automotive, and energy by partnering with industry-specific companies. The need for effective, accessible, and customizable CFD tools across a range of industries is also fueling market expansion. In order to attain optimal performance and a competitive advantage in a market that is becoming increasingly driven by innovation, strategic partnerships, and collaborations, organizations are concentrating on offering solutions to enhance design processes.
Some of the key players in the market include:
March 2025
Quanscient demonstrated the world's first multi-time-step CFD simulation using the Quantum Lattice-Boltzmann Method (QLBM) executed on a superconducting quantum computer at the launch of Europe's first 50-qubit superconducting quantum computer, developed by VTT Technical Research Centre of Finland and IQM Quantum Computers.
October 2024
Altair, a world leader in computational intelligence, and researchers from the Technical University of Munich made a significant advancement in the field of quantum computing for computational fluid dynamics (CFD). The breakthrough, published in the journal Computer Physics Communications, presents runnable code for quantum computers and quantum simulators that addresses several important obstacles of the Lattice-Boltzmann Method's quantum computing implementation.
September 2024
A major research milestone for simulating Computational Fluid Dynamics (CFD) was disclosed by BQP, a startup that is at the forefront of developing quantum-based engineering simulations. A hybrid quantum-classical solution, a component of BQP's next-generation simulation platform, BQPhy, was used to reach the milestone.
June 2024
Parallel RANS Solver for Aerospace Vehicle Aero-thermo-dynamic Analysis (PraVaHa) is a computational fluid dynamics (CFD) program created by the Indian Space Research Organization (ISRO).
May 2023
In an effort to increase jet engines' efficiency, NVIDIA, Rolls-Royce, and the quantum software startup Classiq unveiled a quantum computer breakthrough. For computational fluid dynamics (CFD), the businesses have created and simulated the biggest quantum computing circuit in the world, which has 39 qubits and 10 million layers thick, using NVIDIA's quantum computing platform.
Computer Aided Engineering Software Trends
Finite Element Analysis Software Outlook
Engineering Simulation CFD Software Trends
Upto 15% Off
USD
$2499 $2249
$3999 $3599
$4999 $4249
$5999 $5099


*While we strive to always give you current and accurate information, the numbers depicted on the website are indicative and may differ from the actual numbers in the main report. At Expert Market Research, we aim to bring you the latest insights and trends in the market. Using our analyses and forecasts, stakeholders can understand the market dynamics, navigate challenges, and capitalize on opportunities to make data-driven strategic decisions.*
The current size of the global computational fluid dynamics market is USD 2.81 Billion.
The global computational fluid dynamics market is expected to grow at a CAGR of 11.70% during the forecast period.
The market is estimated to witness a healthy growth in the forecast period of 2026-2035 to reach about USD 8.50 Billion by 2035.
The global market for computational fluid dynamics is being driven by the increasing use of CFD in the aerospace and military industry for cost reduction, operational efficiency, compliance standards, and resource management of many vital systems and components.
The key trend guiding the growth of the market includes the rising demand of the product due to its ability to predict the performance of new processes and designs prior to their production and implementation, which is required in several organisations.
The key regions considered in the market report are North America, Europe, Asia Pacific, Latin America, and Middle East and Africa.
The global market for computational fluid dynamics has been divided into two segments based on the deployment model: cloud-based and on-premises. At the moment, the on-premises approach holds the biggest market share.
The global market for computational fluid dynamics can be segmented by end-user, including automotive, energy, industrial machinery, aerospace and defense, electrical and electronics, and material and chemical processing.
The major players in the market are Altair Engineering, Inc., ANSYS, Inc., Autodesk Inc., COMSOL AB., Hexagon AB, Dassault Systemes, Siemens, and The MathWorks, Inc., among others.
Numerous end-use sectors for computational fluid dynamics, including aerospace and aeronautics, industrial equipment, automotive, etc., were temporarily closed as a result of the COVID-19 pandemic's abrupt onset, which prompted the introduction of strict lockdown rules in various countries.
Explore our key highlights of the report and gain a concise overview of key findings, trends, and actionable insights that will empower your strategic decisions.
| REPORT FEATURES | DETAILS |
| Base Year | 2025 |
| Historical Period | 2019-2025 |
| Forecast Period | 2026-2035 |
| Scope of the Report |
Historical and Forecast Trends, Industry Drivers and Constraints, Historical and Forecast Market Analysis by Segment:
|
| Breakup by Deployment Model |
|
| Breakup by End Use |
|
| Breakup by Region |
|
| Market Dynamics |
|
| Competitive Landscape |
|
| Companies Covered |
|
| Report Price and Purchase Option | Explore our purchase options that are best suited to your resources and industry needs. |
| Delivery Format | Delivered as an attached PDF and Excel through email, with an option of receiving an editable PPT, according to the purchase option. |
Datasheet
One User
USD 2,499
USD 2,249
tax inclusive*
Single User License
One User
USD 3,999
USD 3,599
tax inclusive*
Five User License
Five User
USD 4,999
USD 4,249
tax inclusive*
Corporate License
Unlimited Users
USD 5,999
USD 5,099
tax inclusive*
*Please note that the prices mentioned below are starting prices for each bundle type. Kindly contact our team for further details.*
Flash Bundle
Small Business Bundle
Growth Bundle
Enterprise Bundle
*Please note that the prices mentioned below are starting prices for each bundle type. Kindly contact our team for further details.*
Flash Bundle
Number of Reports: 3
20%
tax inclusive*
Small Business Bundle
Number of Reports: 5
25%
tax inclusive*
Growth Bundle
Number of Reports: 8
30%
tax inclusive*
Enterprise Bundle
Number of Reports: 10
35%
tax inclusive*
How To Order

Select License Type
Choose the right license for your needs and access rights.

Click on ‘Buy Now’
Add the report to your cart with one click and proceed to register.

Select Mode of Payment
Choose a payment option for a secure checkout. You will be redirected accordingly.
Strategic Solutions for Informed Decision-Making
Gain insights to stay ahead and seize opportunities.

Get insights & trends for a competitive edge.

Track prices with detailed trend reports.

Analyse trade data for supply chain insights.

Leverage cost reports for smart savings

Enhance supply chain with partnerships.

Connect For More Information
Our expert team of analysts will offer full support and resolve any queries regarding the report, before and after the purchase.
Our expert team of analysts will offer full support and resolve any queries regarding the report, before and after the purchase.
We employ meticulous research methods, blending advanced analytics and expert insights to deliver accurate, actionable industry intelligence, staying ahead of competitors.
Our skilled analysts offer unparalleled competitive advantage with detailed insights on current and emerging markets, ensuring your strategic edge.
We offer an in-depth yet simplified presentation of industry insights and analysis to meet your specific requirements effectively.


