Consumer Insights
Uncover trends and behaviors shaping consumer choices today
Procurement Insights
Optimize your sourcing strategy with key market data
Industry Stats
Stay ahead with the latest trends and market analysis.
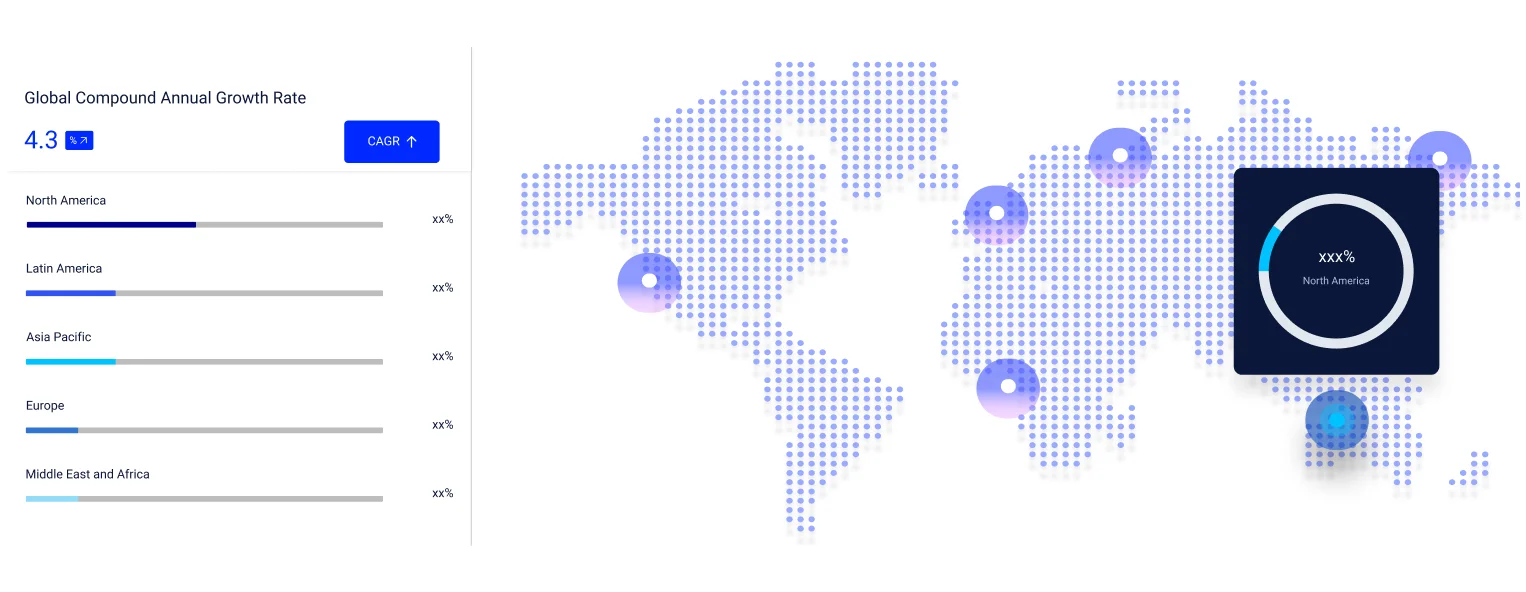
The global copper sulphate market attained a volume of 386.79 Kilo Tons in 2025 and is projected to expand at a CAGR of 3.30% through 2035. The market is further expected to achieve 535.15 Kilo Tons by 2035, driven by its widening use in agriculture as a fungicide and soil additive, the need for crop protection as global food demand rises, and steady consumption in mining, electroplating, chemical production and animal feed supplements.
Sulphuric acid supply is shaping the copper chain on which copper sulphate depends. Chinese customs data showed exports of sulphuric acid to Chile fell to zero in March 2026, as Mining Reporters noted in April 2026, after 31,870 metric tons shipped in February 2026. About 37% of Chile's acid imports come from China, and acid underpins the leaching that produces roughly half of the country's refined copper. Tighter acid availability raises costs along the leach chain that supplies copper sulphate producers, and it can slow output of the copper feedstock they buy.
The Chilean Copper Commission, Cochilco, said in August 2026 in its copper market trends report that world mine output will grow only 0.2% in 2026 to 23.57 million tons, leaving a refined copper surplus of just 225,000 tons, or 0.8% of demand. It projects refined demand of 27.86 million tons, up 1.9%, and an average price of US$5.95 per pound. It expects mine supply to recover 3.8% in 2027 to 24.47 million tons. A tight copper supply keeps feedstock costs firm for copper sulphate makers.
Copper sulphate pentahydrate prices follow the copper market. Tartana Minerals said in July 2026 that its product, which contains about 25% copper, is priced off the previous month's average London Metal Exchange copper price plus a premium, and that the June 2026 average of about US$13,552 per tonne was 38% above June 2025. The company estimated a realised sales price above A$5,000 per tonne, a sharply stronger revenue backdrop for producers than in 2025. Buyers of copper sulphate therefore see prices move with the metal.
Compound Annual Growth Rate
3.3%
Value in Kilo Tons
2026-2035
Read more about this report - REQUEST FREE SAMPLE COPY IN PDF
MKS Inc. announced in October 2026 that its Atotech and ESI brands will present printed circuit board and package substrate solutions at CPCA Show Plus in Shenzhen, China, with Atotech featuring Printoganth electroless copper, InPro via filling and Stannatech immersion tin processes. The portfolio targets artificial intelligence, high-performance computing and automotive electronics. Companies can leverage integrated copper plating chemistry and equipment to win fine-line and via-filling programs.
Wego said in September 2026 that its CASE and Construction sales and product management team met in Philadelphia to exchange insights on customer needs and market dynamics. The group said it aims to become a more proactive resource, combining commercial and product intelligence to offer dependable sourcing and long-term partnership. Companies can secure steadier supply by working with distributors that pair market intelligence with sourcing depth.
PT Amman Mineral Nusa Tenggara's chief executive, Rachmat Makassau, told an Indonesian parliamentary committee in July 2026 that the company plans 162,662 dry metric tons of copper cathode in 2026, up from 79,848 tons in 2025, after completing its smelter ramp-up in April. It also plans 572,036 dry metric tons of sulphuric acid. Companies can expand integrated copper and acid output to anchor regional supply of copper chemicals.
Tartana Minerals said in April 2026 that it had restacked about 50,000 tonnes of copper-mineralised pit fill onto its lower heap leach pad in Far North Queensland, averaging 0.22% copper, and expected copper sulphate pentahydrate production to resume within three weeks, with a first shipment to offtaker Kanins International targeted for May 2026. Companies can secure feed grade by restacking leach pads before restarting crystallisation plants.
MKS Inc. said in June 2026 that Atotech and ESI would show advanced packaging and printed circuit board solutions at the JPCA Show in Tokyo, including Printoganth MV TP3 electroless copper, Cupraganth MV copper-based activation and InPro Pulse TGV copper filling for through-glass vias. It said ESI laser drilling combined with Atotech chemistry supports finer interconnects. Companies can leverage copper-based activation and filling chemistry to serve advanced packaging customers.
Aurubis AG and Prysmian signed a long-term agreement in September 2026 for the supply of copper wire rod, extending a partnership of more than 30 years. Aurubis produces rod containing about 36% recycled material at four plants across Europe, and Prysmian describes itself as the world's largest buyer of copper wire rod. Companies can lock in long-term copper supply to shield production plans from raw material swings.
Ivanhoe Mines said in January 2026 that its Kamoa-Kakula smelter in the Democratic Republic of the Congo produced its first copper anodes in December 2025, followed by a first batch of by-product sulphuric acid, with up to 700,000 tonnes a year expected at steady state. The acid will be sold locally to mines across the Copperbelt. Companies can monetise smelter acid to support regional leach operations.
Noah Chemicals published a guide on vanadium oxysulfate in February 2026, describing a specialised compound with a controlled +4 oxidation state used in catalysis, chemical synthesis and electrochemical systems, with moderate recurring consumption, limited global supply and output often made to specification. It noted that quality depends on trace metals, hydration state and oxidation-state consistency. Companies can secure supplier qualification early to protect development timelines for specialty chemical programs.
This Expert Market Research Report titled "Global Copper Sulphate Market Report and Forecast 2026-2035" offers a detailed analysis of the market based on the following segments:
Market Breakup by End Use
Key Insight: Agriculture is the anchor use, and France's ANSES withdrew authorization for 19 copper-based fungicides in July 2025, with sales barred from January 2026; Mining and Metallurgy relies on copper supply, and Zambia's Ministry of Mines and Minerals Development said in July 2026 that copper output rose 0.45% to 447,181.93 tonnes in the six months ended June 2026; Chemicals covers electroplating and pigments, and Atotech said in March 2026 it would present a non-etch adhesion promoter for printed circuit boards at the APEX Expo; Construction covers wood preservation and concrete, and Koppers reported in August 2026 that domestic utility pole volumes rose 16 percent in the quarter ended June 2026 and cited a benefit from its copper-hedging program; and Healthcare uses cupric sulfate in trace element injections for pediatric parenteral nutrition, as in American Regent's Multrys product.
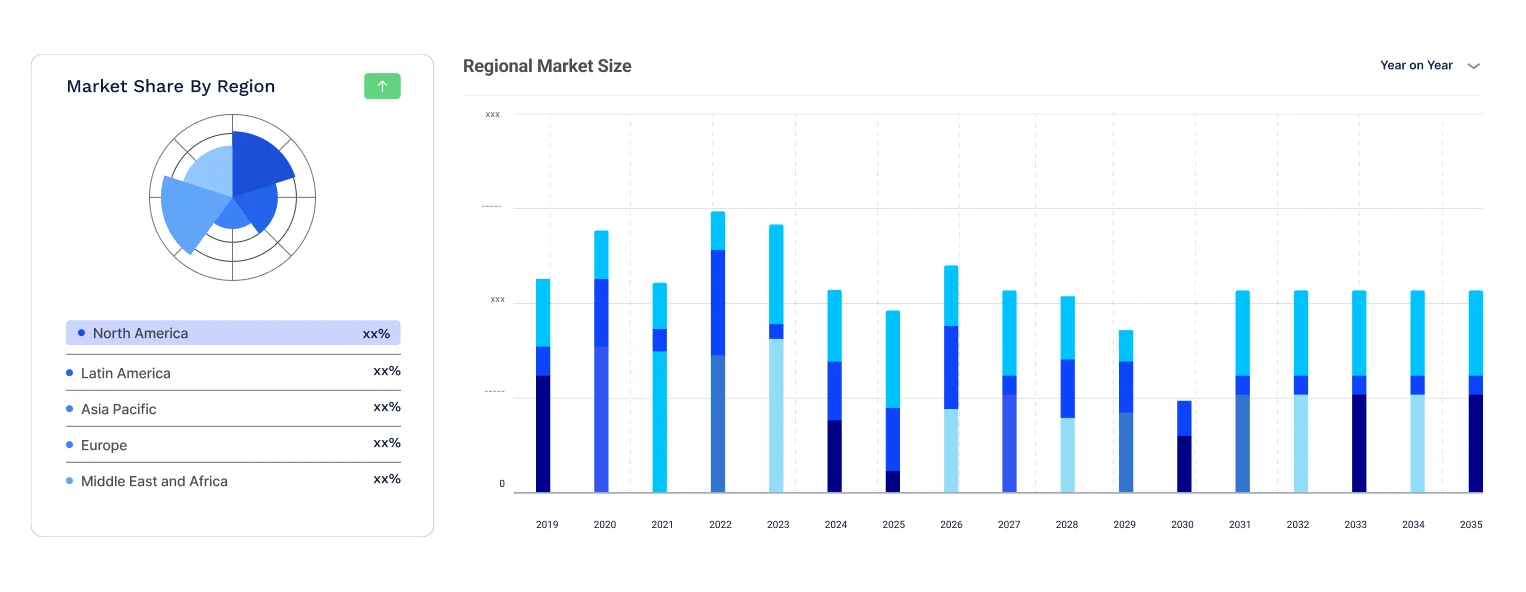
Based on region, the market can be segregated into:
Key Insight: North America is led by the United States of America and Canada, where the U.S. Geological Survey added copper to its Final 2025 List of Critical Minerals in November 2025 and its Mineral Commodity Summaries 2026 estimated 2025 U.S. mine output at 1.0 million tons, down 5%; Europe is anchored by the United Kingdom, Germany, France and Italy, where Aurubis AG reported in August 2026 operating earnings before taxes up 31% to EUR 374 million for the nine months ended June 2026, helped by higher sulphuric acid sales; Asia Pacific is led by China and India, where India added liquid copper sulphate, with a minimum 4.8% copper content, to its Fertiliser Control Order in September 2026; Latin America is led by Brazil, Argentina and Mexico, while Cochilco data reported in August 2026 showed Chile's Codelco output falling 4.8% to 114,400 tons in June 2026; and Middle East and Africa is led by Saudi Arabia, the United Arab Emirates, Nigeria and South Africa, while Ecofin Agency reported in May 2026 that First Quantum Minerals plans to sell surplus sulphuric acid in Zambia.
Read more about this report - REQUEST FREE SAMPLE COPY IN PDF
By End Use, Agriculture leads the market while Chemicals grows fastest because crop protection and soil treatment keep fungicide demand steady, while electroplating and circuit board manufacturing lift chemical-industry use.
Agriculture leads because copper sulphate works as a fungicide against blight and mildew and as a soil additive that corrects nutrient deficiencies. Wego said in June 2026 that it would exhibit at Specialty and Agro Chemicals America in Savannah, offering specialty and agrochemical solutions backed by a robust supply network. Farmers choosing eco-friendly crop protection and organic systems keep buying copper-based products, and that steady seasonal demand across every growing season sustains the segment's lead over every other end use.
Chemicals grows fastest as electronics and clean energy raise demand for the copper used in circuit boards and batteries. Shanghai Metals Market estimated in May 2026 that the operating rate of China's copper foil enterprises would reach 91.48%, up 19.32 percentage points year on year, with electronic circuit copper foil at 89.42% and lithium battery copper foil at 92.55%. Higher foil output points to heavier use of plating and chemical inputs, while pigments and electroplating solutions keep drawing copper sulphate.
Asia Pacific holds the leading position in the copper sulphate market, supported by large agricultural economies such as India and China, a deep copper refining base and expanding electronics manufacturing.
This is supported by China's General Administration of Customs data, reported by Shanghai Metals Market in October 2026, which showed imports of 254,600 tons of copper cathode in September 2026 and 2.1383 million tons in the nine months ended September 2026. The Democratic Republic of Congo and Russia supplied about 60.67% of September cargoes. Volumes of this scale keep Asia Pacific at the center of copper trade and the downstream chemicals that depend on it.
Asia Pacific is also the fastest-growing region, as India's agricultural output is projected to rise 4% and demand for advanced circuit boards builds in Southeast Asia. MKS said in August 2026 that Atotech process chemistry and ESI laser systems would be on show at Thailand Electronics Circuit Asia in Bangkok, citing demand from artificial intelligence, high-performance computing and data center applications for advanced circuit boards. North America, Europe, Latin America, and the Middle East and Africa follow with steadier demand.
The global copper sulphate market is served by a mix of specialty chemical distributors, process chemistry suppliers, copper producers and regional manufacturers that supply agriculture, mining, electroplating and industrial customers across mature and emerging economies.
Competitive dynamics are shaped by product quality and purity grades, compliance with stricter environmental and agricultural input rules, manufacturing efficiency, access to copper feedstock and sulphuric acid, and portfolio diversification into new applications and emerging markets.
Wego Chemical Group was founded in 1978 and is headquartered in Great Neck, New York, United States. It sources and supplies ingredients and chemicals worldwide to industrial, agricultural, food and pharmaceutical customers. In April 2026 it rebranded as Wego and launched a new website that it said was built around speed, accountability and easier access to materials, information and people.
Allan Chemical Corporation was established in 1984 in Fort Lee, New Jersey, and is based in Ringwood, New Jersey, United States. It supplies specialty and industrial chemicals, including copper sulfate pentahydrate. In August 2025 it published a guide to copper sulfate pentahydrate covering agriculture, electroplating, construction and wood treatment uses, and the USP, ACS and FCC grades needed for pharmaceutical, laboratory and food applications.
Atotech was founded in 1993 and is headquartered in Berlin, Germany, and has been part of MKS Inc. since 2022. It supplies process chemistry, plating equipment, software and services for printed circuit boards and package substrates. In September 2026 MKS announced Atotech would show electroless copper, adhesion promotion and copper filling processes at KPCA Show in Incheon, South Korea.
Noah Chemicals was founded in 1978 as Noah Industrial Corporation in New York and is headquartered in San Antonio, Texas, United States. It supplies traditional and custom chemical products and chemical services to industrial customers. In April 2026 it published a guide to sodium nitrate covering steel heat treating, glass manufacturing, pharmaceutical synthesis, metal treatment and agriculture.
Other key players in the copper sulphate market include a wider group of regional and specialised copper sulphate suppliers, among others.
*Please note that this is only a partial list; the complete list of key players is available in the full report. Additionally, the list of key players can be customized to better suit your needs.*
For a detailed assessment of opportunities across the copper sulphate market's end use and regional segments through 2026 and beyond, connect with Expert Market Research for a customized consultation.


Upto 15% Off
USD
$2499 $2249
$3999 $3599
$4999 $4249
$5999 $5099


*While we strive to always give you current and accurate information, the numbers depicted on the website are indicative and may differ from the actual numbers in the main report. At Expert Market Research, we aim to bring you the latest insights and trends in the market. Using our analyses and forecasts, stakeholders can understand the market dynamics, navigate challenges, and capitalize on opportunities to make data-driven strategic decisions.*
The global copper sulphate market attained a volume of 386.79 Kilo Tons in 2025.
The copper sulphate market is projected to grow at a CAGR of 3.30% from 2026 to 2035.
The market is estimated to witness healthy growth in the forecast period of 2026-2035 to reach a volume of around 535.15 Kilo Tons by 2035.
The major drivers of the market are the increasing applications of the copper sulphate in agricultural activities in order to meet the ever-increasing demand for food, and in animal feed as an additive, to improve the functioning of the body.
The key trends guiding the growth of the market include the increasing research and development activities for effective fungicide and herbicides production to protect farm yield and continuously growing global population.
The major regions in the market are North America, Latin America, the Middle East and Africa, Europe, and the Asia Pacific.
Agriculture, mining and metallurgy, chemicals, construction, and healthcare are the major end use segments of copper sulphate in the market.
Key players in the copper sulphate market are Wego Chemical Group, Allan Chemical Corporation, Atotech, and NOAH Technologies Corporation.
Key challenges include fluctuating copper prices that raise production costs, environmental concerns about toxicity that invite stricter regulation, tight sulphuric acid supply for leach operations, limited awareness of benefits in emerging markets, and competition from alternative chemicals and substitutes.
Key strategies include investing in sustainable production approaches such as bioleaching, improving product quality to meet tighter regulatory standards, upgrading manufacturing efficiency, diversifying portfolios across agriculture, water treatment and industrial uses, and entering emerging economies.
Explore our key highlights of the report and gain a concise overview of key findings, trends, and actionable insights that will empower your strategic decisions.
| REPORT FEATURES | DETAILS |
| Base Year | 2025 |
| Historical Period | 2019-2025 |
| Forecast Period | 2026-2035 |
| Scope of the Report |
Historical and Forecast Trends, Industry Drivers and Constraints, Historical and Forecast Market Analysis by Segment:
|
| Breakup by End Use |
|
| Breakup by Region |
|
| Market Dynamics |
|
| Competitive Landscape |
|
| Companies Covered |
|
| Report Price and Purchase Option | Explore our purchase options that are best suited to your resources and industry needs. |
| Delivery Format | Delivered as an attached PDF and Excel through email, with an option of receiving an editable PPT, according to the purchase option. |
Datasheet
One User
USD 2,499
USD 2,249
tax inclusive*
Single User License
One User
USD 3,999
USD 3,599
tax inclusive*
Five User License
Five User
USD 4,999
USD 4,249
tax inclusive*
Corporate License
Unlimited Users
USD 5,999
USD 5,099
tax inclusive*
*Please note that the prices mentioned below are starting prices for each bundle type. Kindly contact our team for further details.*
Flash Bundle
Small Business Bundle
Growth Bundle
Enterprise Bundle
*Please note that the prices mentioned below are starting prices for each bundle type. Kindly contact our team for further details.*
Flash Bundle
Number of Reports: 3
20%
tax inclusive*
Small Business Bundle
Number of Reports: 5
25%
tax inclusive*
Growth Bundle
Number of Reports: 8
30%
tax inclusive*
Enterprise Bundle
Number of Reports: 10
35%
tax inclusive*
How To Order

Select License Type
Choose the right license for your needs and access rights.

Click on ‘Buy Now’
Add the report to your cart with one click and proceed to register.

Select Mode of Payment
Choose a payment option for a secure checkout. You will be redirected accordingly.
Strategic Solutions for Informed Decision-Making
Gain insights to stay ahead and seize opportunities.
Get insights & trends for a competitive edge.
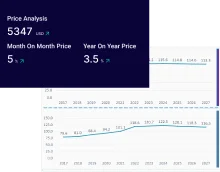
Track prices with detailed trend reports.
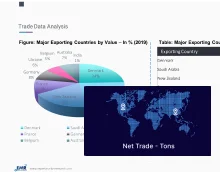
Analyse trade data for supply chain insights.
Leverage cost reports for smart savings
Enhance supply chain with partnerships.
Connect For More Information
Our expert team of analysts will offer full support and resolve any queries regarding the report, before and after the purchase.
Our expert team of analysts will offer full support and resolve any queries regarding the report, before and after the purchase.
We employ meticulous research methods, blending advanced analytics and expert insights to deliver accurate, actionable industry intelligence, staying ahead of competitors.
Our skilled analysts offer unparalleled competitive advantage with detailed insights on current and emerging markets, ensuring your strategic edge.
We offer an in-depth yet simplified presentation of industry insights and analysis to meet your specific requirements effectively.