

Consumer Insights
Uncover trends and behaviors shaping consumer choices today
Procurement Insights
Optimize your sourcing strategy with key market data
Industry Stats
Stay ahead with the latest trends and market analysis.
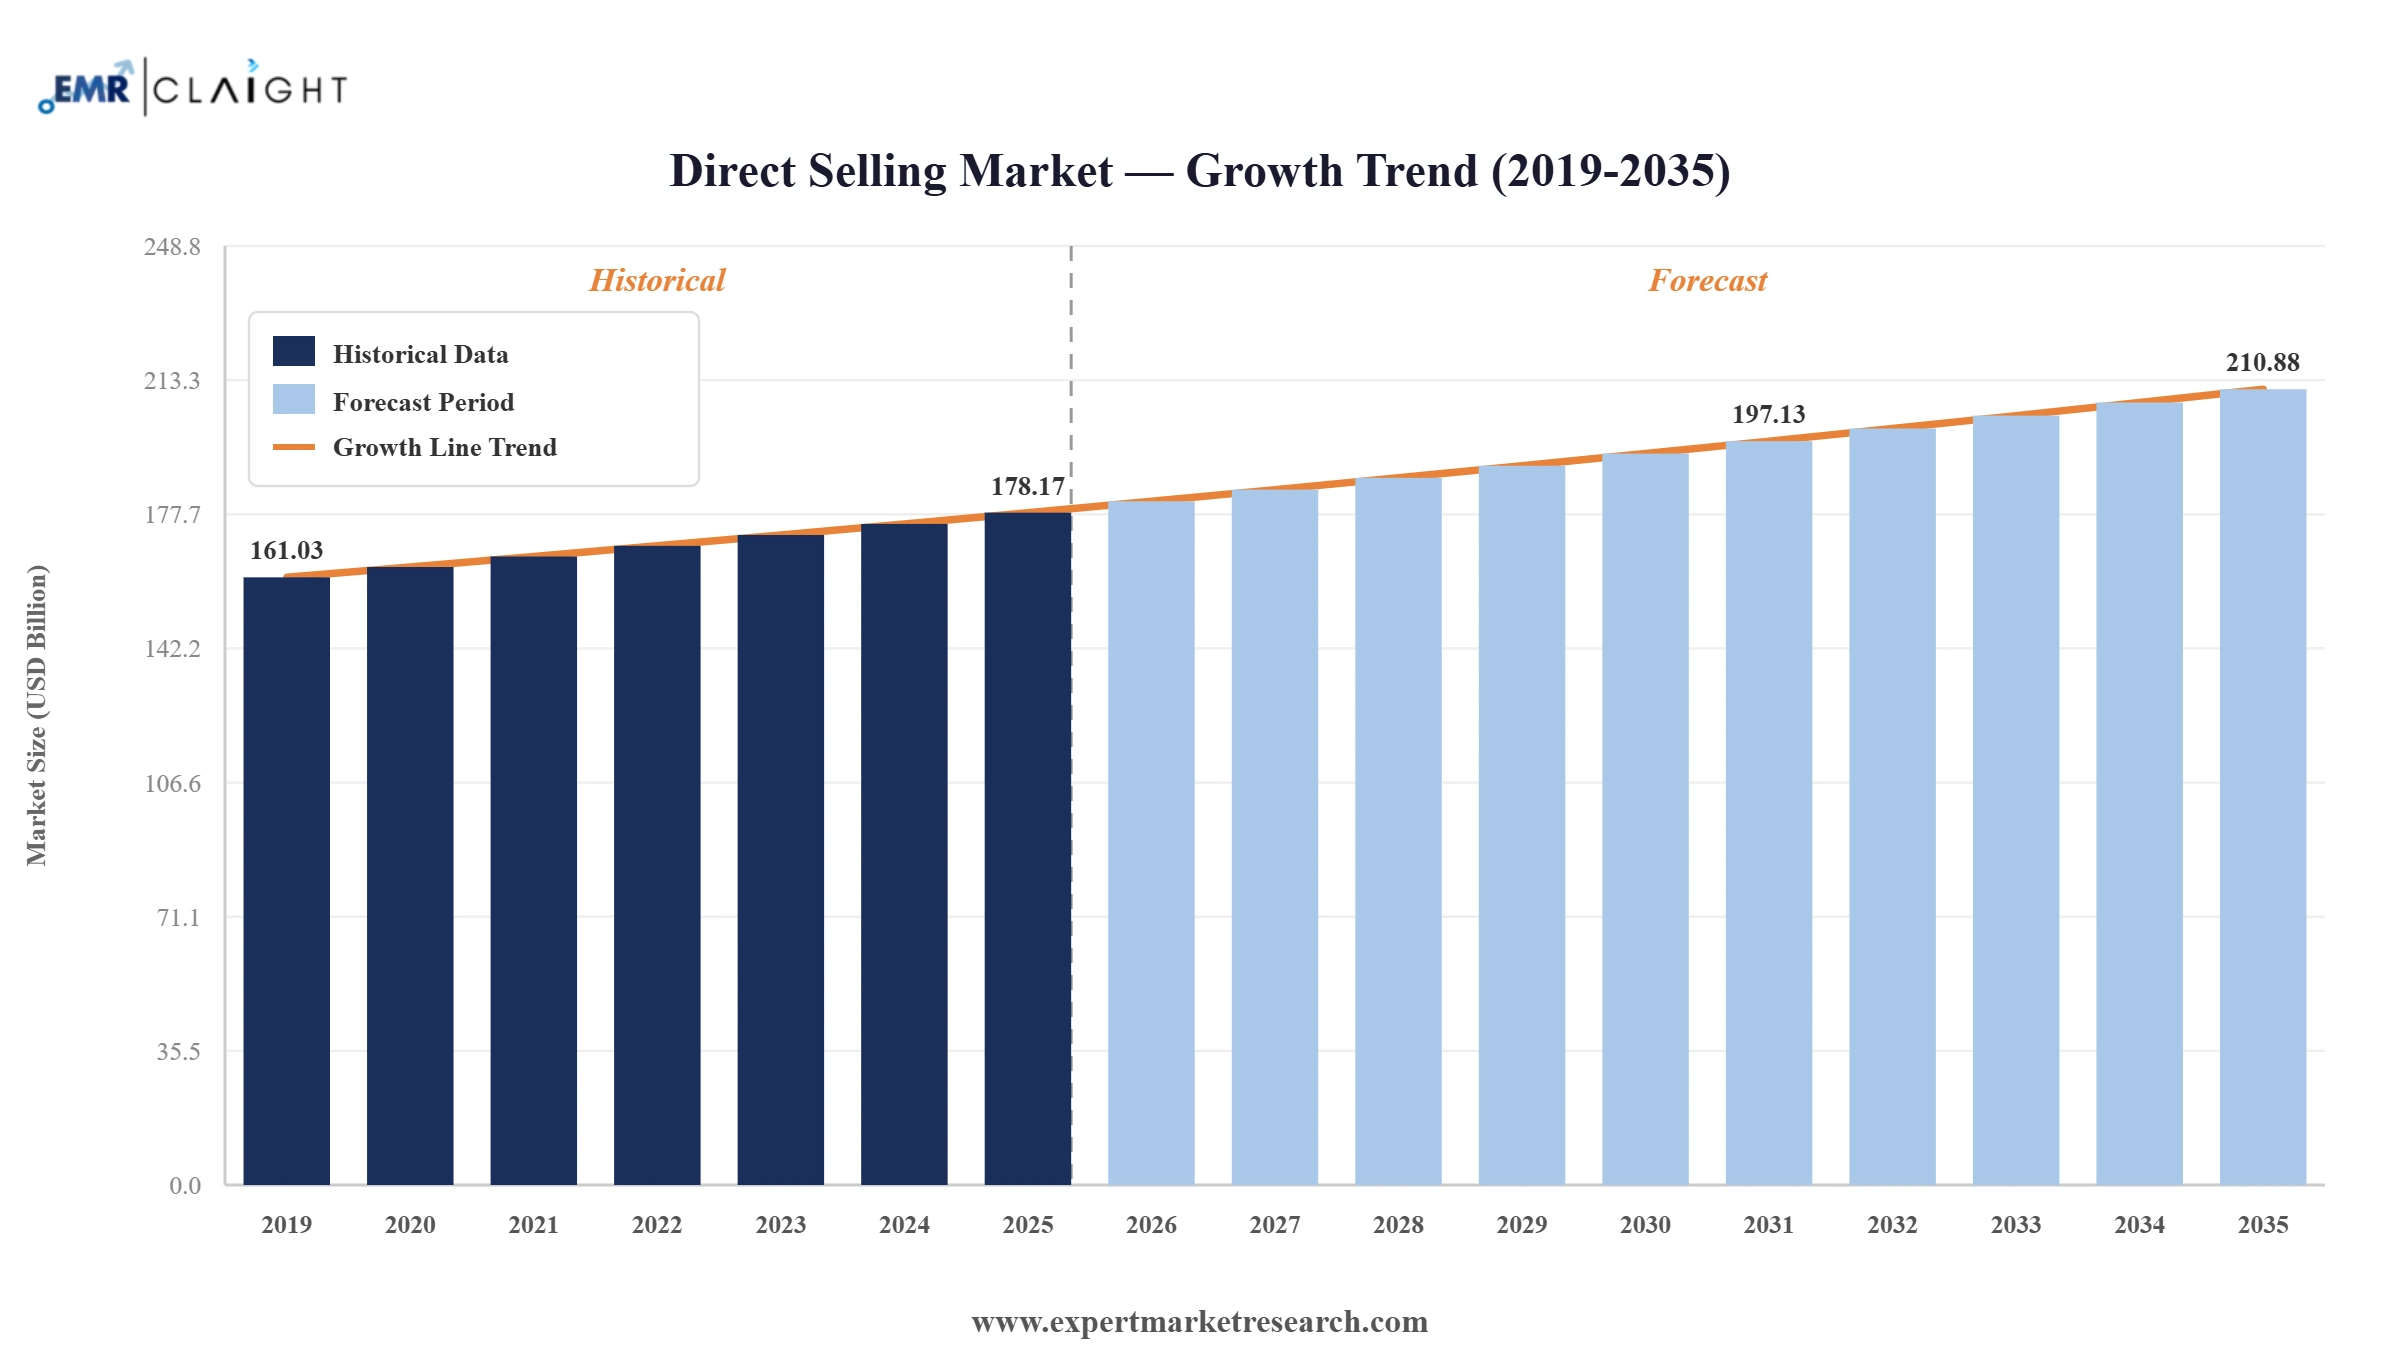
The global direct selling market reached a value of USD 178.17 Billion at 2025 and is projected to expand at a CAGR of around 1.70% during the forecast period of 2026-2035. With rising social and digital selling adoption, steady wellness economy expansion, widening middle-class demand across emerging markets, and AI-enabled distributor productivity, the market is expected to reach USD 210.88 Billion by 2035.
Read more about this report - REQUEST FREE SAMPLE COPY IN PDF
| Global Direct Selling Market Report Summary | Description | Value |
| Base Year | USD Billion | 2025 |
| Historical period | USD Billion | 2019-2025 |
| Forecast Period | USD Billion | 2026-2035 |
| Market Size 2025 | USD Billion | 178.17 |
| Market Size 2035 | USD Billion | 210.88 |
| CAGR 2019-2025 | Percentage | xx% |
| CAGR 2026-2035 | Percentage | 1.70% |
| CAGR 2026-2035 - Market by Region | North America | 2.1% |
| CAGR 2026-2035 - Market by Country | UK | 5.6% |
| CAGR 2026-2035 - Market by Country | USA | 2.1% |
| CAGR 2026-2035 - Market by Type | Single Level Marketing | 2.2% |
| CAGR 2026-2035 - Market by End Use | Household Goods | 2.3% |
| Market Share by Country | USA | 23.7% |
The global direct selling market is being reshaped by a clear migration from living-room demonstrations to social and digital selling, while artificial intelligence quietly rewires how distributors find, advise, and retain customers. At the same time, the sector is consolidating around product categories where personal trust still matters, with wellness and beauty holding firm even as commoditised categories cede ground to mainstream retail.
In April 2026, Amway was named the world's number one direct selling company for the fourteenth straight year in the 2026 Direct Selling News Global 100, ranked on 2025 revenue. The list recognised 59 firms exceeding USD 100 million.
In March 2026, Herbalife announced a planned acquisition of Bioniq to expand its personalised nutritional supplement capabilities. The deal deepens the company's data-driven wellness push, pairing distributor relationships with individualised formulations aimed at lifting repeat purchases globally.
In February 2026, Natura agreed to sell Avon's Russia operations to Arnest Group for roughly USD 31 million, its last asset outside Latin America. The move completes a multi-year simplification refocusing the group on its Latin American brands.
In January 2026, Nu Skin used the ICR Conference to outline a pivot toward retail, hybrid, and direct-to-consumer models alongside its intelligent wellness platform. It has since signalled a formal India launch anticipated in late 2026 to capture emerging-market demand.
Distributors increasingly convert social audiences into sales rather than hosting in-person parties. Oriflame processed 99% of orders online during 2024, and around 79% of direct selling organisations adopted online channels by 2025, signalling that the relationship model simply changed venue.
Artificial intelligence now augments sellers rather than replacing them. In February 2026, Cristiano Ronaldo invested USD 7.5 million for a 10% stake in Herbalife's Pro2col platform, underscoring how AI-led personalisation is fuelling global direct selling market growth across wellness and nutrition.
Honest income disclosure is becoming the norm. In January 2025, the US Federal Trade Commission proposed an Earnings Claim Rule requiring substantiated distributor income statements, a shift expected to trim aggressive recruitment while strengthening long-term direct selling channel credibility overall.
Conglomerates are shedding non-core assets to concentrate firepower. Across 2025 and early 2026, Natura completed the divestiture of Avon International to Regent LP and exited Russia, sharpening its Latin American focus and illustrating how the global direct selling market is consolidating.
Emerging Asia remains the structural growth engine. Nu Skin has flagged a formal India launch for late 2026, targeting a market that already supports about 8 crore direct sellers, reflecting how rising incomes and digital access keep widening the channel.
The report by Expert Market Research,s titled “Global Direct Selling Market Report and Forecast 2026-2035”, offers a detailed analysis of the market based on the following segments:
On the basis of type, the market is divided into
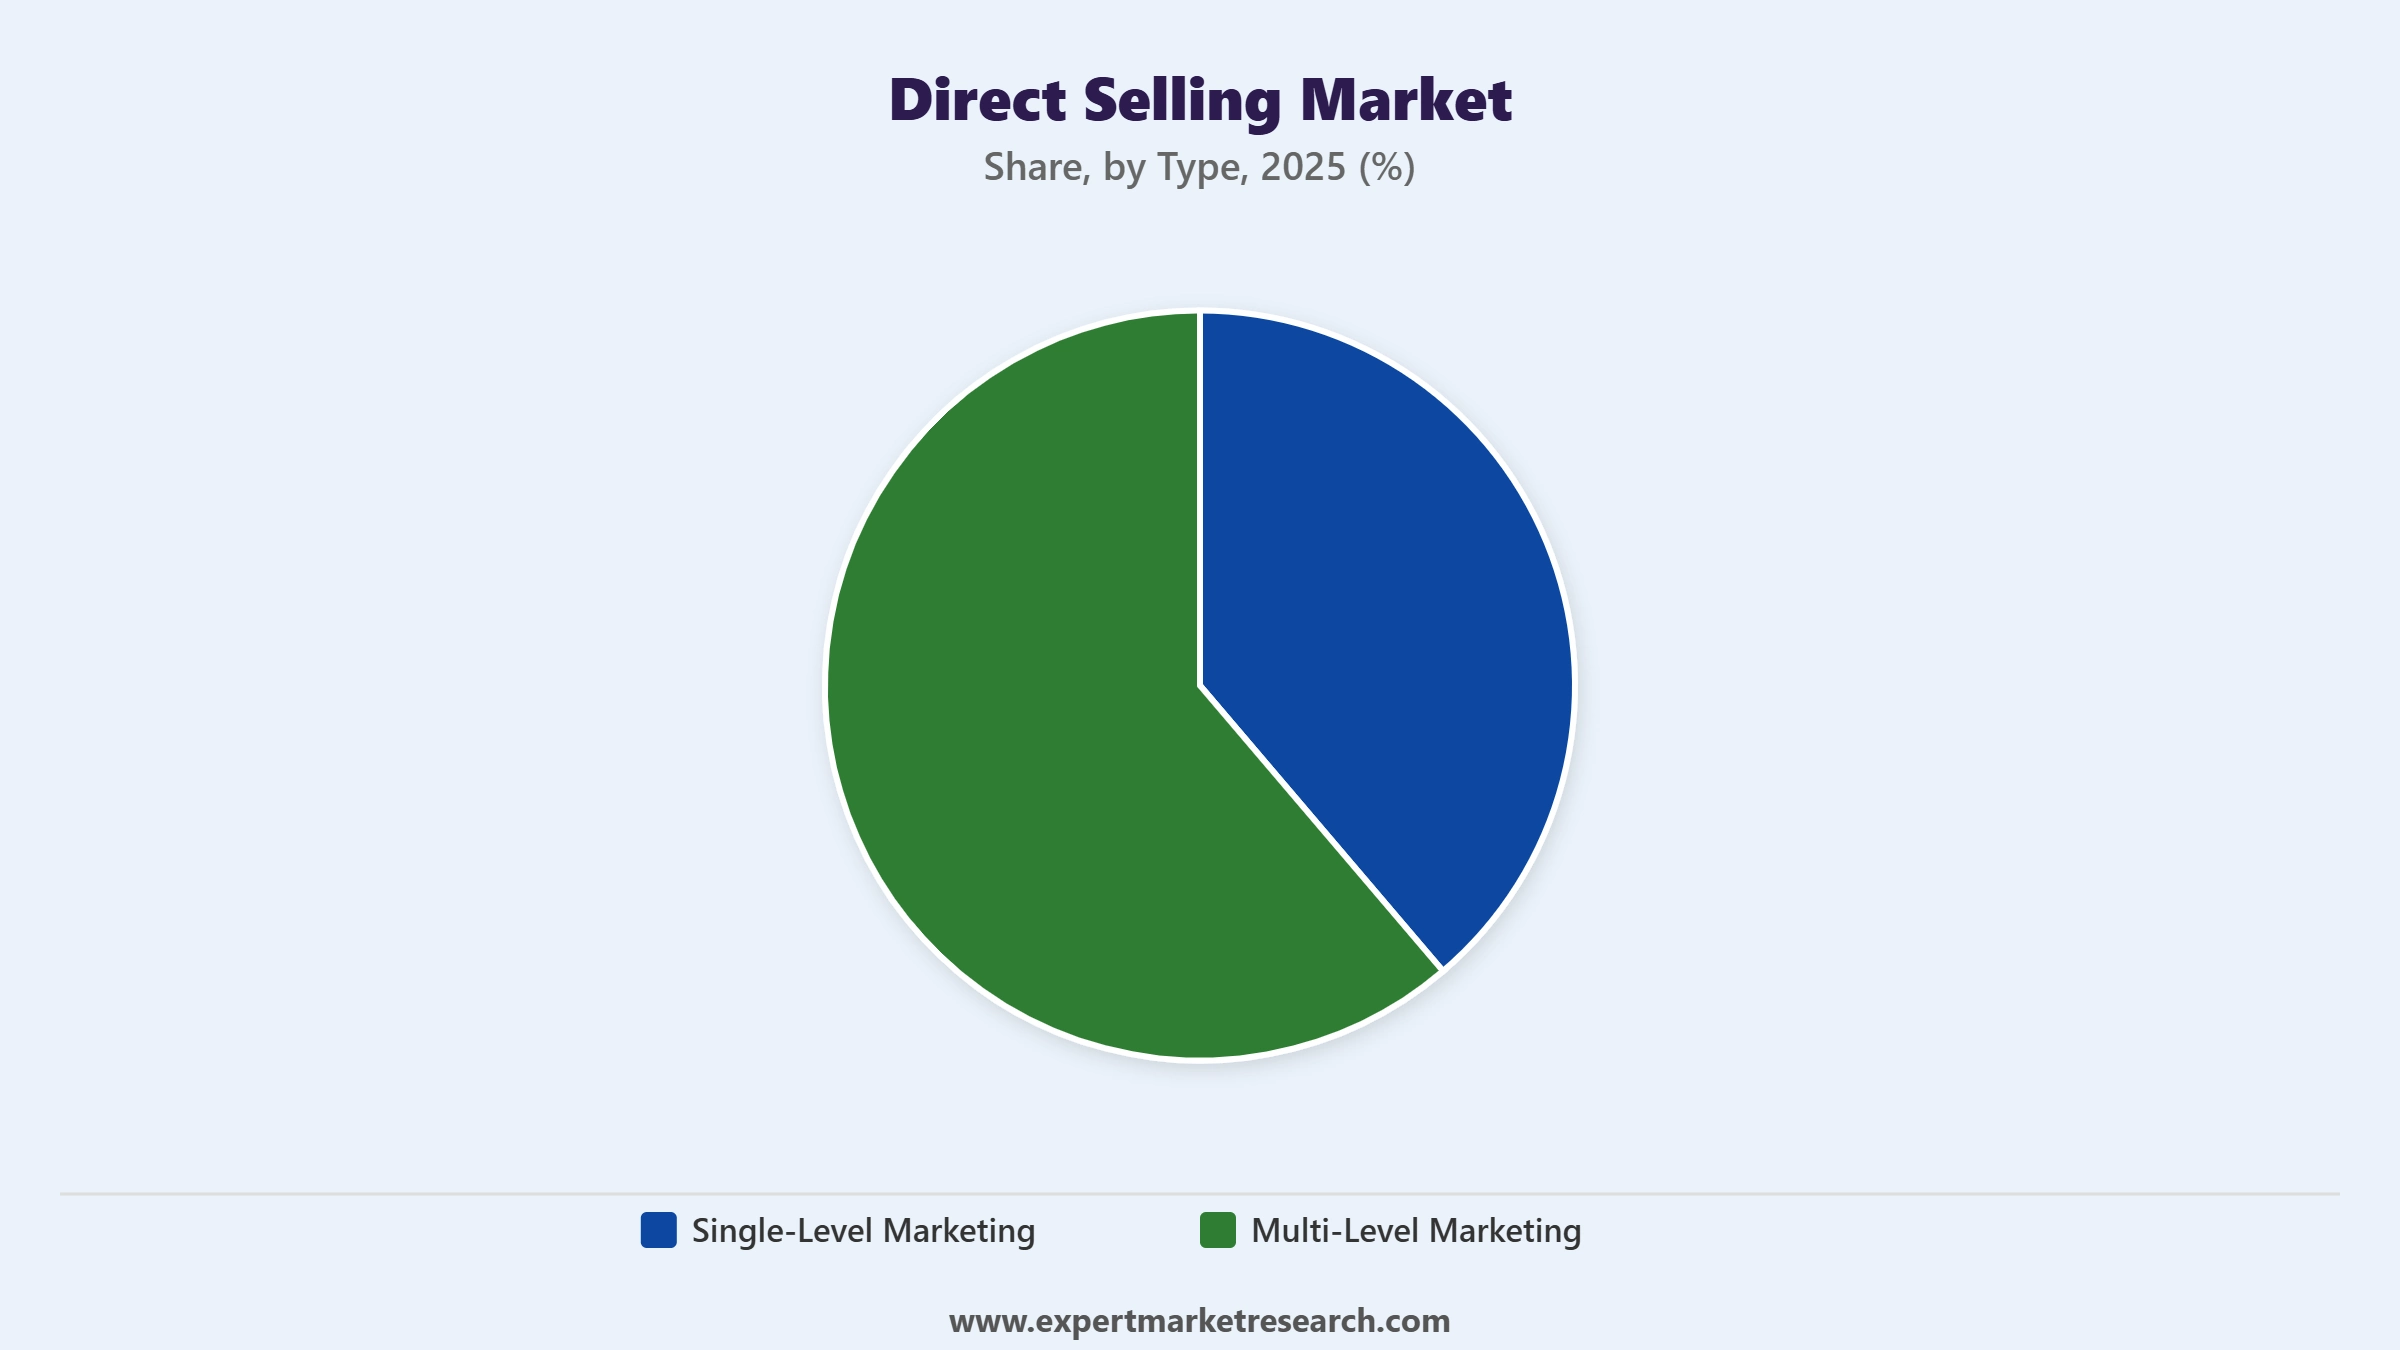
Key Insight: Multi-level marketing accounts for over 59% of global direct selling revenue, anchored by scaled networks at firms like Amway, Herbalife, and PM-International. Single-level marketing covers the remainder through party-plan operators and direct-to-consumer specialists that avoid downline recruitment income. Regulators across more jurisdictions now expect retail sales to end consumers to form the primary income source, gradually tilting the type mix toward cleaner, sales-led models within the global direct selling market.
On the basis of application, the market is segmented into
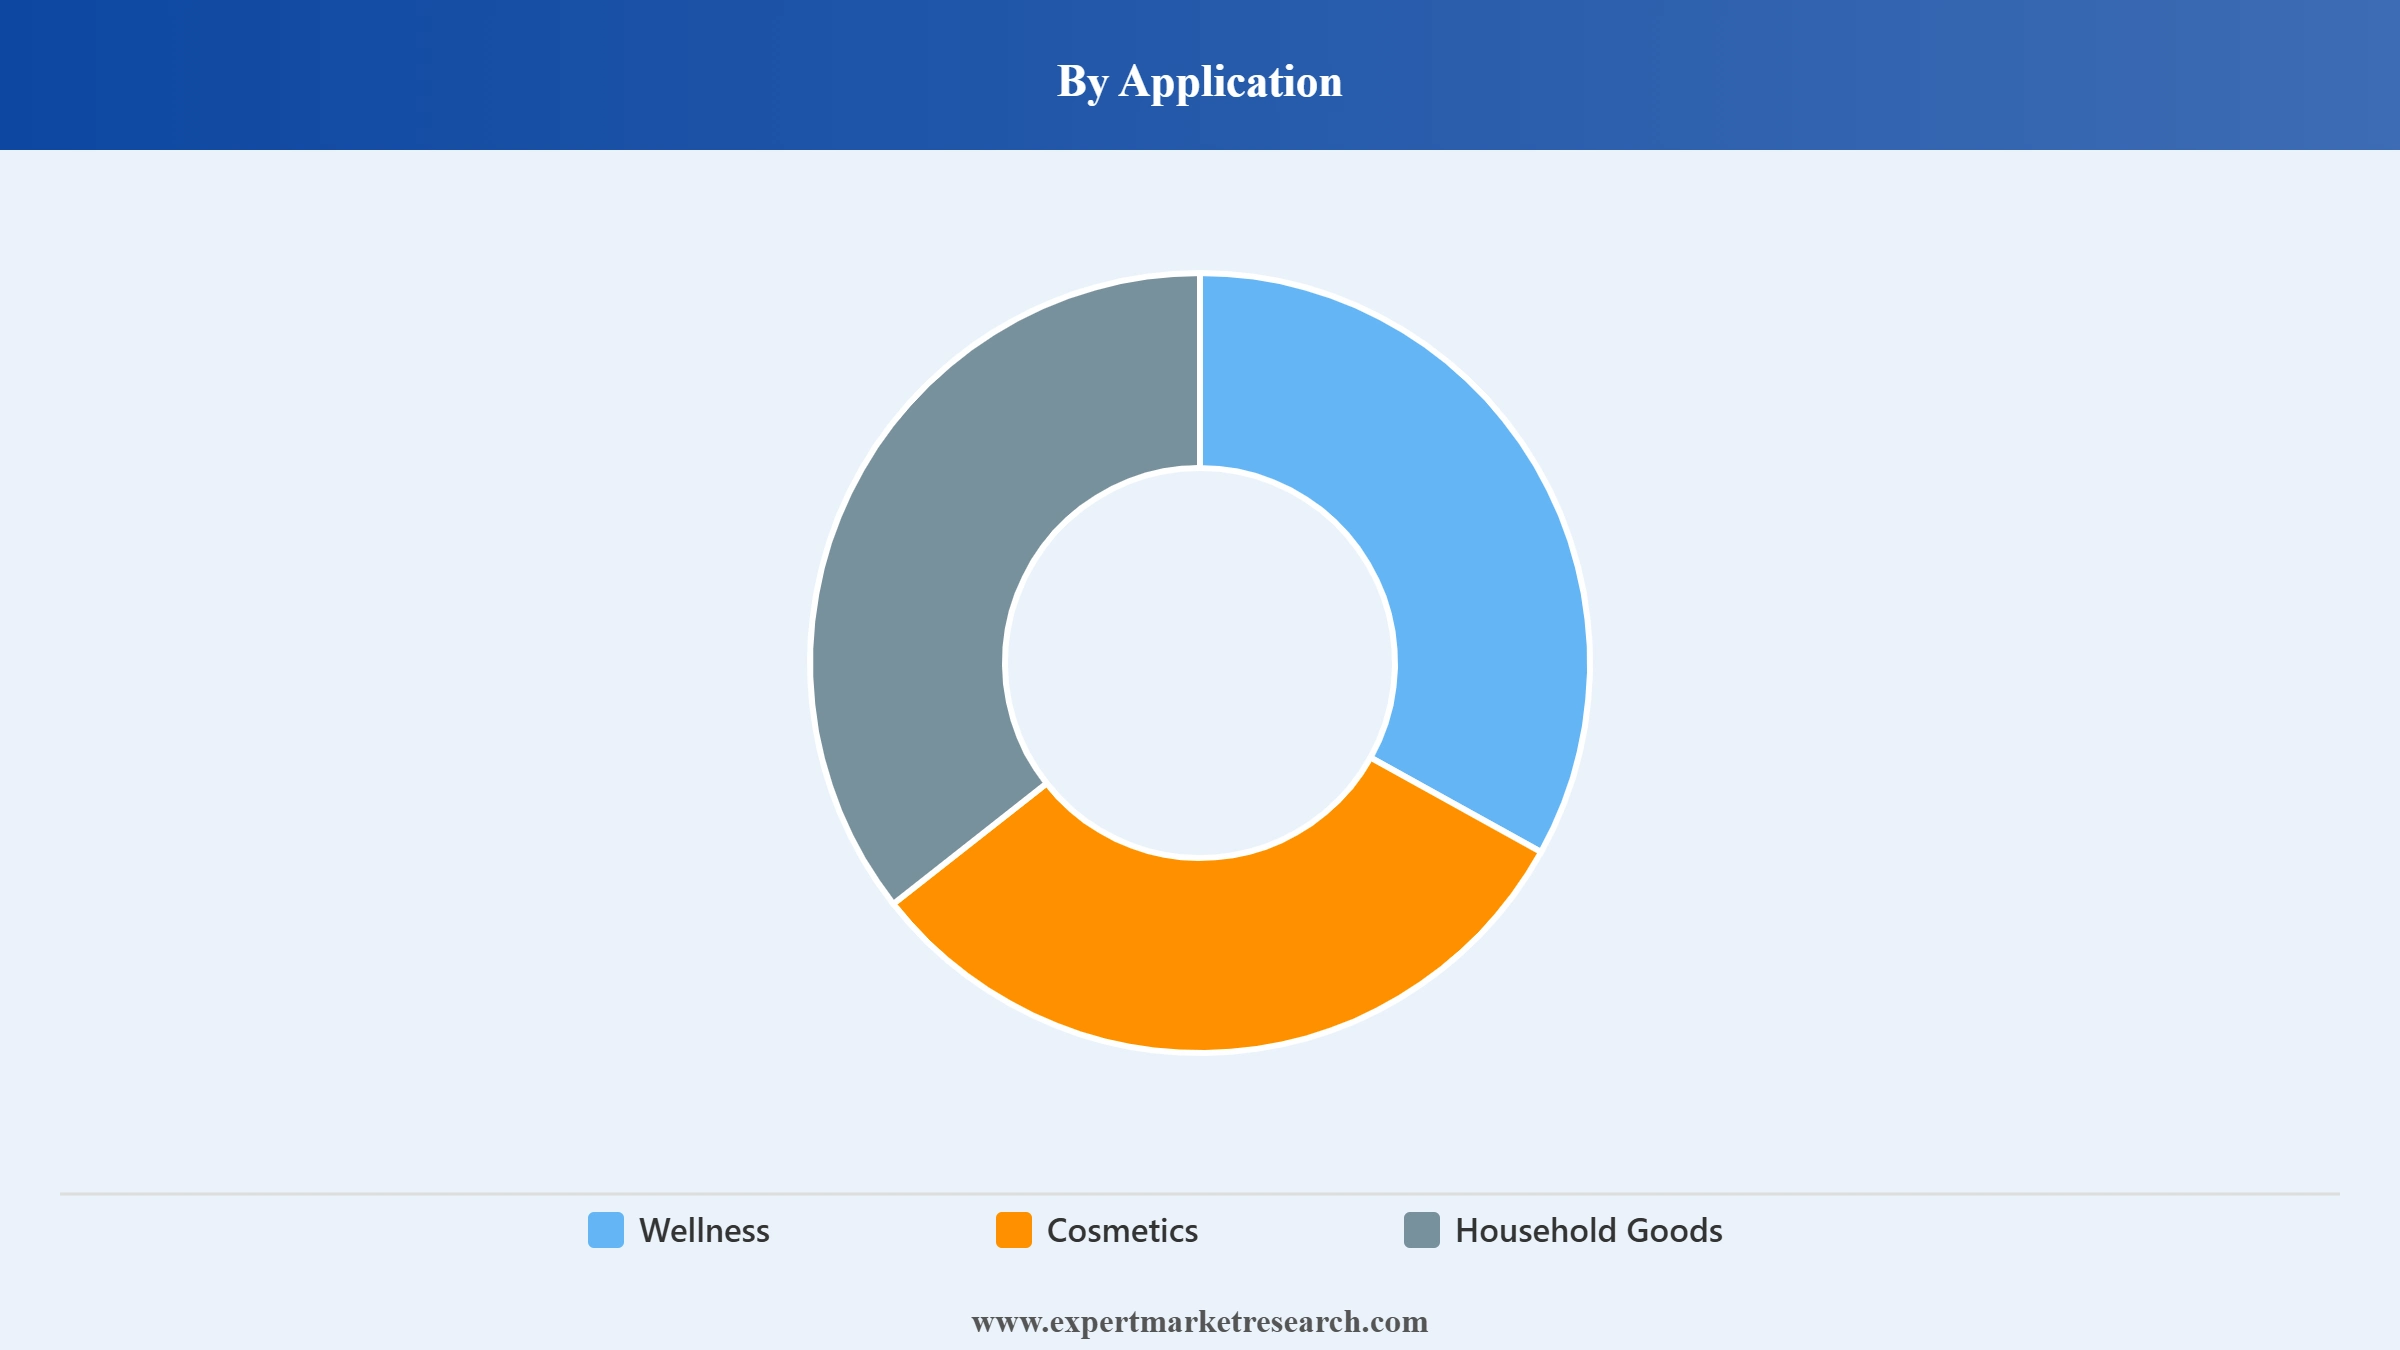
Key Insight: Wellness leads with 35.3% of global revenue and aligns most closely with durable consumer trends, helped by a global wellness economy approaching USD 7 trillion in 2025. Direct selling performs strongly here because supplements and nutrition reward demonstration and ongoing coaching. Cosmetics ranks second and is expected to grow quickly, while household goods, the category where Tupperware once thrived, faces the sharpest pressure from convenient e-commerce alternatives.
On the basis of region, the market is segregated into
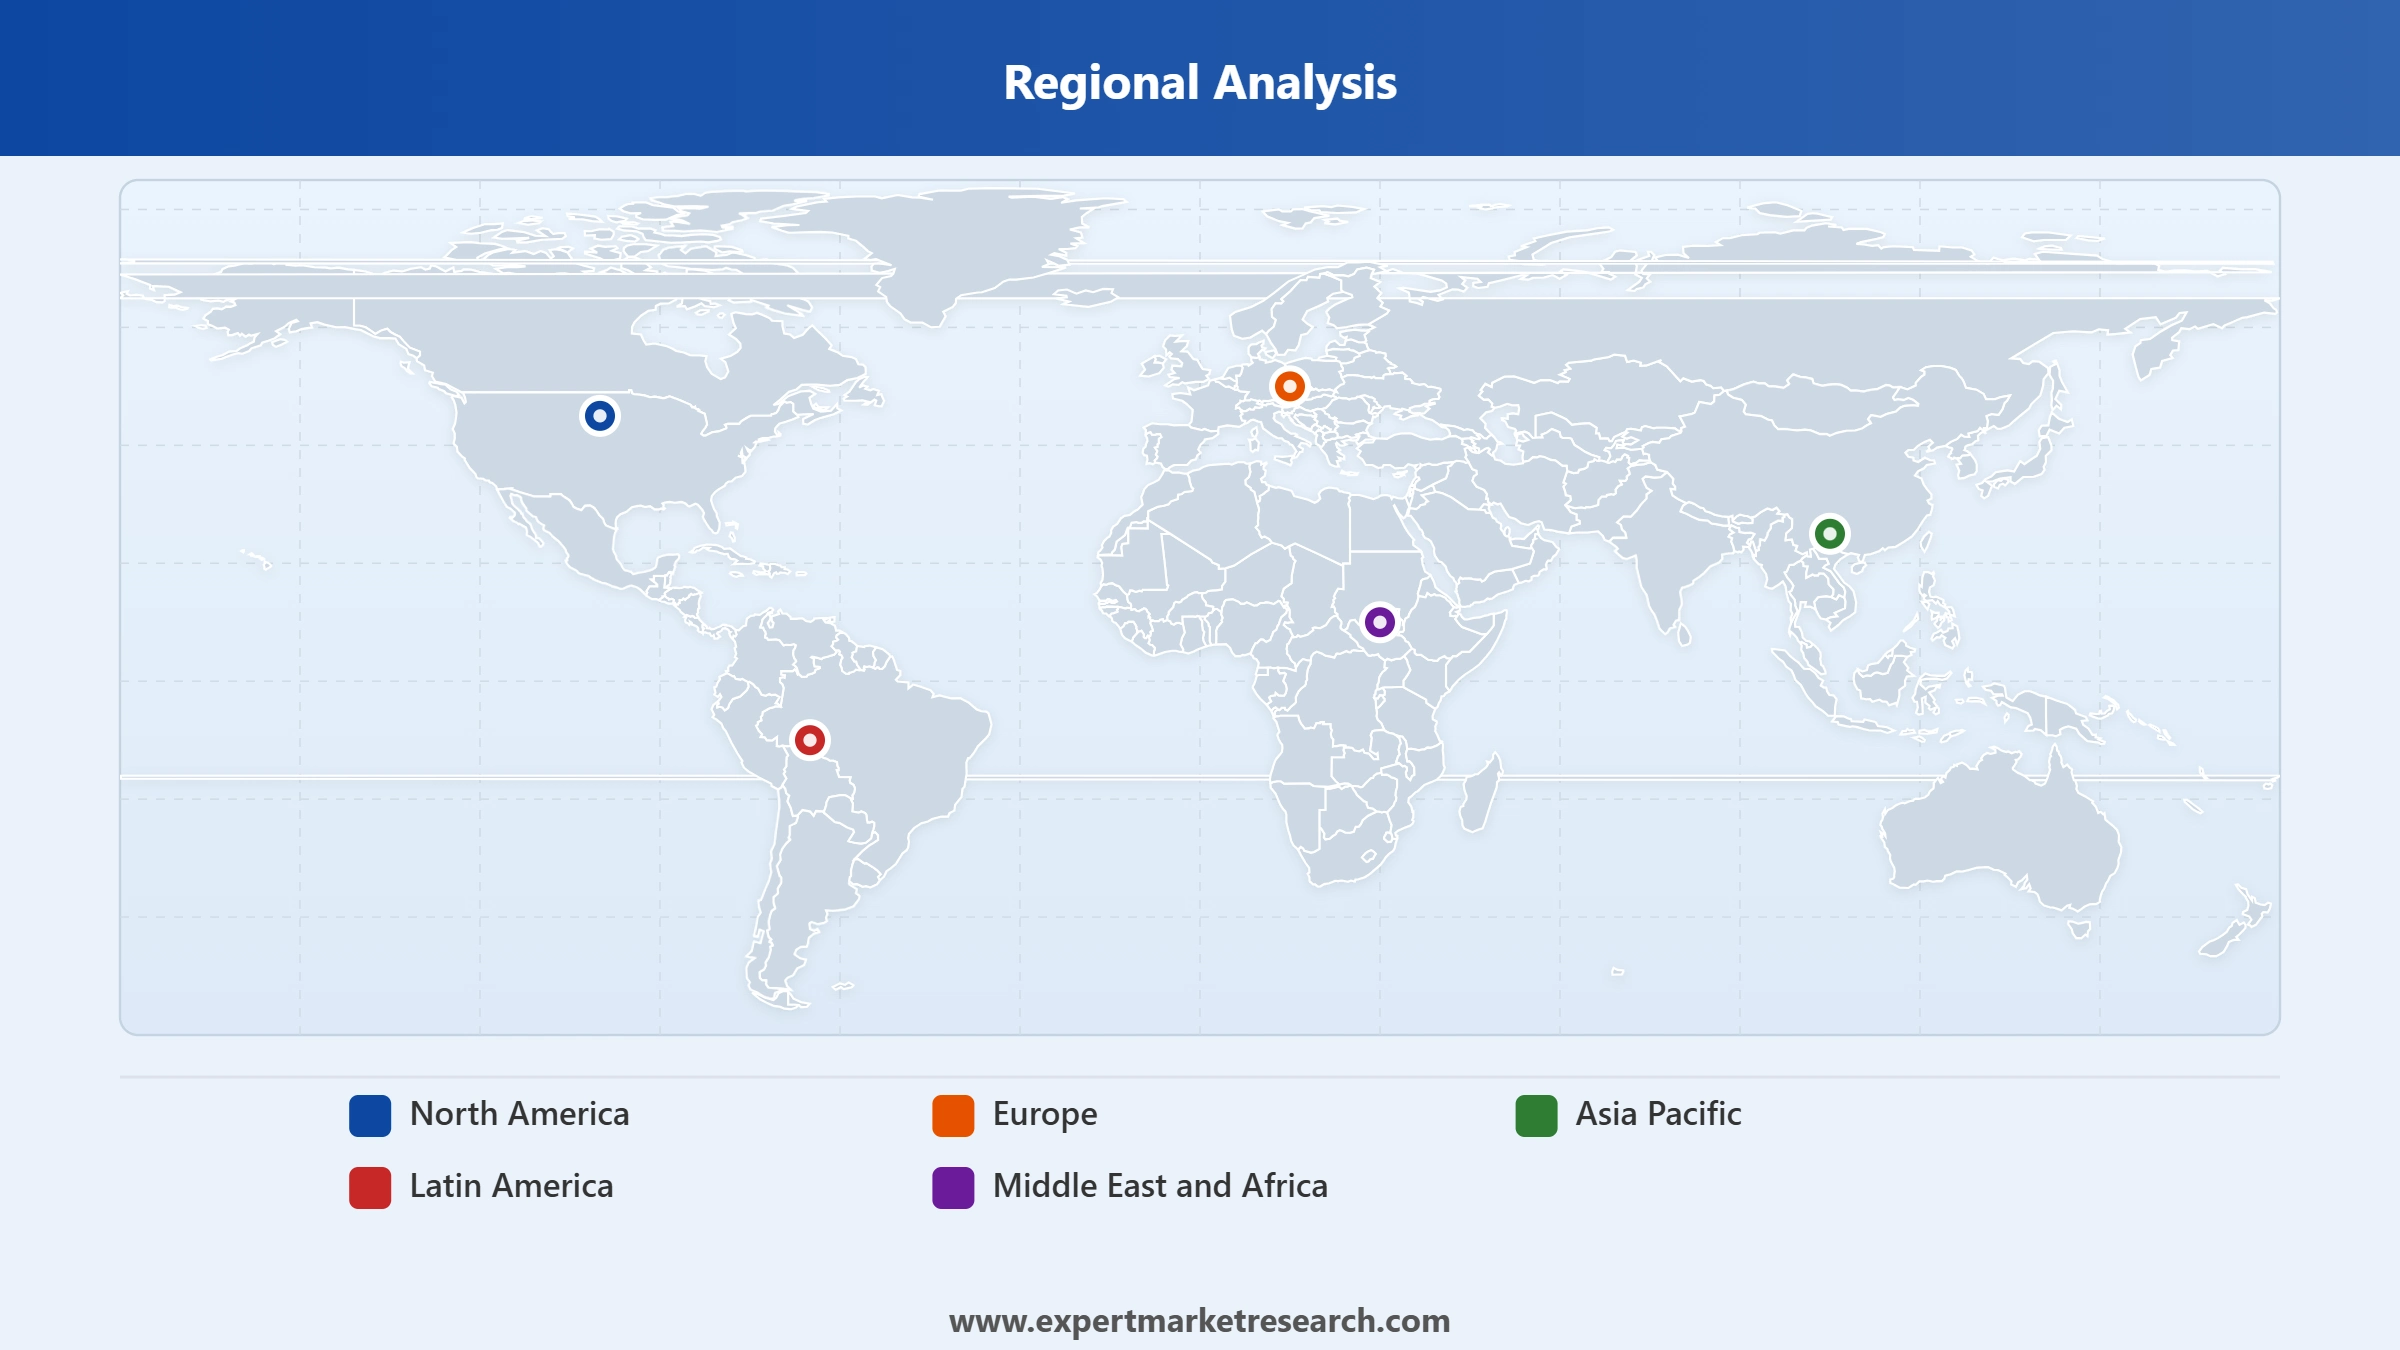
Key Insight: Asia Pacific dominates with 45.9% of global revenue, powered by large populations, expanding middle classes, and cultural comfort with relationship-based commerce across India, Indonesia, Vietnam, and Thailand. North America remains the most mature region, while LAMEA benefits from demographic tailwinds and improving digital infrastructure that lets social selling scale. China carries the most regulatory risk, a reminder that policy shifts can quickly reshape regional direct selling performance. Across the global direct selling market, regional momentum tracks demographics and digital adoption more than legacy presence.


Read more about this report - REQUEST FREE SAMPLE COPY IN PDF
By type, multi-level marketing dominates the market due to large, scaled distributor networks and recurring income
Multi-level marketing holds more than 59% of the global direct selling market because its layered distributor structure scales reach without proportional retail overhead. Wellness and nutrition leaders such as Amway and Herbalife rely on it to deliver products through trusted local relationships rather than store shelves. The model rewards both personal sales and team building, which sustains recruitment, broadens catalogue exposure, and keeps active sellers engaged across dozens of markets simultaneously.
Single-level marketing is gaining relative momentum as scrutiny of recruitment-led income intensifies. The category leans on straightforward retail selling through party plans and online storefronts, and it is expected to grow at about 2.2% over the forecast period. The regulatory backdrop reinforces the shift: in January 2025, the US FTC proposed an Earnings Claim Rule pressing firms toward honest income disclosure, nudging the global direct selling market toward cleaner, sales-first compensation designs.
Read more about this report - REQUEST FREE SAMPLE COPY IN PDF
By application, wellness accounts for the dominant share of the market due to strong trend alignment and repeat purchasing
Wellness commands roughly 35.3% of global application revenue because supplements, nutrition, and weight-management products benefit from demonstration, education, and ongoing coaching that retail channels rarely match. A global wellness economy nearing USD 7 trillion in 2025 expands the addressable base, and recurring consumption supports subscription-like reorder behaviour. For many direct selling distributors, wellness offers the clearest path to durable income, which is why category leaders concentrate innovation and recruitment energy here.
Cosmetics ranks as the second-largest application and is positioned to grow quickly as personalised beauty gains traction. Innovation is accelerating: in March 2026, Herbalife unveiled plans to acquire Bioniq to deepen personalised nutrition, while beauty-led players push device-based and data-driven routines. Household goods, by contrast, faces structural pressure, illustrated by Tupperware's September 2024 bankruptcy, as commoditised items migrate to mainstream e-commerce within the broader global direct selling market.
Read more about this report - REQUEST FREE SAMPLE COPY IN PDF
Asia Pacific dominates the market due to vast population, rising incomes, and cultural acceptance of relationship-based commerce
Asia Pacific leads the global direct selling market with about 45.9% of revenue, supported by enormous populations, fast-growing middle classes, and deep familiarity with personal, relationship-led selling. The WFDSA reports roughly 8 million independent representatives across the region, and demand keeps rising on the back of higher incomes and sharper interest in health and beauty. India stands out as the fastest-growing individual market, while logistics and mobile-payment maturity make social selling easy to scale.
North America posts the strongest forecast CAGR among regions at roughly 2.1%, even as it remains the most mature market. Growth leans on wellness demand and social commerce, with the DSA counting over 6.7 million US sellers in 2022. Corporate momentum continues too: in April 2026, Amway again topped the Direct Selling News Global 100, reflecting steady North American leadership and ongoing investment in nutrition and beauty innovation.
Read more about this report - REQUEST FREE SAMPLE COPY IN PDF
The global direct selling market is led at the top by a handful of scaled multinationals and remains highly fragmented below them, with hundreds of regional operators competing in the USD 100 million to USD 1 billion range. Amway leads by revenue, Herbalife by wellness depth, and Natura & Co by geographic spread and social-mission positioning.
Competition increasingly turns on technology and product-channel fit rather than recruitment alone. Forward-looking firms invest in AI-led personalisation, social selling tools, and emerging-market entry, while operators tied to commoditised categories or legacy distributor systems lose ground. Regulatory transparency is reshaping incentives too, rewarding companies that genuinely sell product through fairly compensated distributors.
Founded in 1959 and headquartered in Ada, Michigan, Amway is the world's largest direct selling company, with around USD 7.4 billion in 2024 revenue and operations in over 100 countries. Its multi-level model spans nutrition, beauty, and home care under the Nutrilite, Artistry, and eSpring brands, backed by continued manufacturing investment in Asia.
Established in 1980 and based in Los Angeles, California, Herbalife is the most commercially important wellness-focused operator, active in more than 90 markets. It pairs nutrition and weight-management lines with a community-driven distributor network, and is deepening data-led personalisation through its Pro2col platform and a planned Bioniq acquisition.
Founded in 1969 and headquartered in Sao Paulo, Brazil, Natura & Co is a beauty and wellness conglomerate built around the Natura and Avon brands. A B-Corp certified group, it has streamlined its portfolio toward Latin America, divesting Avon International to sharpen focus and fund core direct selling growth.
Founded in 1883 and based in Wuppertal, Germany, Vorwerk is a family-owned group known for the Thermomix kitchen appliance and Kobold cleaning systems sold through demonstration-led direct selling. Its premium, product-first approach gives it durable strength across Europe and selected international markets, supported by a loyal advisor network.
Other key players in the market are Tupperware Brands Corporation, Oriflame Holding AG, Mary Kay Inc., and Others.
*Please note that this is only a partial list; the complete list of key players is available in the full report. Additionally, the list of key players can be customized to better suit your needs.*
Explore the latest intelligence on the global direct selling market with our comprehensive report. Understand why outcomes as different as Tupperware's bankruptcy and Herbalife's continued growth unfolded in the same window, and where social selling, AI personalisation, and emerging markets are creating the next openings. Whether you are refining a wellness brand, rethinking your channel strategy, or planning regional expansion, this report gives you the clarity to act. Download your free sample now and uncover the key opportunities across direct selling.
Upto 15% Off
USD
$2499 $2249
$3999 $3599
$4999 $4249
$5999 $5099


*While we strive to always give you current and accurate information, the numbers depicted on the website are indicative and may differ from the actual numbers in the main report. At Expert Market Research, we aim to bring you the latest insights and trends in the market. Using our analyses and forecasts, stakeholders can understand the market dynamics, navigate challenges, and capitalize on opportunities to make data-driven strategic decisions.*
At 2025, the market reached an approximate value of USD 178.17 Billion.
The market is projected to grow at a CAGR of 1.70% between 2026 and 2035.
The market is estimated to witness a healthy growth in the forecast period of 2026-2035 to reach USD 210.88 Billion by 2035.
The major drivers include rising incomes, a heightened awareness of health and beauty concerns, and the expanding middle-class population.
The key trends include the surging demand for customised purchasing experience, rising awareness of health and well-being, and rising internet penetration.
The different types of direct selling include single-level marketing and multi-level marketing.
Major applications of direct selling include wellness, cosmetics, and household goods, among others.
The key players include Amway Corp., Herbalife Nutrition Ltd., Natura & Co., Vorwerk SE & Co. KG, Tupperware Brands Corporation, Oriflame Holding AG, Mary Kay Inc., and Others.
Explore our key highlights of the report and gain a concise overview of key findings, trends, and actionable insights that will empower your strategic decisions.
| REPORT FEATURES | DETAILS |
| Base Year | 2025 |
| Historical Period | 2019-2025 |
| Forecast Period | 2026-2035 |
| Scope of the Report |
Historical and Forecast Trends, Industry Drivers and Constraints, Historical and Forecast Market Analysis by Segment:
|
| Breakup by Type |
|
| Breakup by Application |
|
| Breakup by Region |
|
| Market Dynamics |
|
| Competitive Landscape |
|
| Companies Covered |
|
Datasheet
One User
USD 2,499
USD 2,249
tax inclusive*
Single User License
One User
USD 3,999
USD 3,599
tax inclusive*
Five User License
Five User
USD 4,999
USD 4,249
tax inclusive*
Corporate License
Unlimited Users
USD 5,999
USD 5,099
tax inclusive*
*Please note that the prices mentioned below are starting prices for each bundle type. Kindly contact our team for further details.*
Flash Bundle
Small Business Bundle
Growth Bundle
Enterprise Bundle
*Please note that the prices mentioned below are starting prices for each bundle type. Kindly contact our team for further details.*
Flash Bundle
Number of Reports: 3
20%
tax inclusive*
Small Business Bundle
Number of Reports: 5
25%
tax inclusive*
Growth Bundle
Number of Reports: 8
30%
tax inclusive*
Enterprise Bundle
Number of Reports: 10
35%
tax inclusive*
How To Order

Select License Type
Choose the right license for your needs and access rights.

Click on ‘Buy Now’
Add the report to your cart with one click and proceed to register.

Select Mode of Payment
Choose a payment option for a secure checkout. You will be redirected accordingly.
Strategic Solutions for Informed Decision-Making
Gain insights to stay ahead and seize opportunities.

Get insights & trends for a competitive edge.

Track prices with detailed trend reports.

Analyse trade data for supply chain insights.

Leverage cost reports for smart savings

Enhance supply chain with partnerships.

Connect For More Information
Our expert team of analysts will offer full support and resolve any queries regarding the report, before and after the purchase.
Our expert team of analysts will offer full support and resolve any queries regarding the report, before and after the purchase.
We employ meticulous research methods, blending advanced analytics and expert insights to deliver accurate, actionable industry intelligence, staying ahead of competitors.
Our skilled analysts offer unparalleled competitive advantage with detailed insights on current and emerging markets, ensuring your strategic edge.
We offer an in-depth yet simplified presentation of industry insights and analysis to meet your specific requirements effectively.


