

Consumer Insights
Uncover trends and behaviors shaping consumer choices today
Procurement Insights
Optimize your sourcing strategy with key market data
Industry Stats
Stay ahead with the latest trends and market analysis.

The electric motors market size reached a value of approximately USD 137.86 Billion in 2025. The market is projected to grow at a CAGR of 5.30% between 2026 and 2035, reaching a value of around USD 231.06 Billion by 2035. The electric motor market is experiencing remarkable growth, driven by the mounting need for home appliances and electric vehicles. As the market trend shifts toward sustainability, manufacturers are turning to energy-efficient solutions in a bid to minimize carbon emissions. The adoption of green vehicles has also fueled the market, boosting innovation and investment in new motor technologies. As governments across the globe are driving eco-friendly policies, the electric motors market is likely to grow exponentially. These days, consumers are looking towards efficiency and sustainability, so electric motors have become an essential ingredient in contemporary usage. This development not only advantages the environment but also transforms industries, providing a cleaner and more efficient future.
Base Year
Historical Period
Forecast Period
France intends to allocate €2.5 billion in its 2030 investment strategy to increase the manufacture of approximately two million electric and hybrid cars.
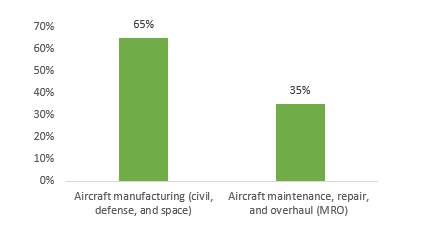
According to ITA, Canada shipped around 57.38% of products from the Aircraft, Engine, and Parts Manufacturing sector to the United States in 2022.
In 2022, Australia's car sector witnessed more than a million new vehicle transactions, with SUVs, according to FCAI.
Compound Annual Growth Rate
5.3%
Value in USD Billion
2026-2035
*this image is indicative*
Read more about this report - REQUEST FREE SAMPLE COPY IN PDF
The market for electric motors is growing at a significant rate with the growing usage of plug-in hybrid electric vehicles (PHEVs), battery electric vehicles (BEVs), and hybrid vehicles. Companies are emphasizing the manufacturing of sophisticated electric motor–driven cars to match the growing need for environmentally friendly transport. For instance, in India, 4.4 million electric vehicles were registered by August 2024, including 956,000 in the first eight months of 2024, achieving a 6.6% market penetration. The boom is giving a boost to the market with massive growth forecasted in the years to come.
Apart from the automotive industry, electric motors play a central role in many sectors, such as machine tools, household appliances, and HVAC applications. The drive for energy-efficient products has caused electric motors to become ubiquitous in industrial and agricultural uses, highlighting their applicability across many sectors.
Efficiency is still an important consideration, especially when it comes to electric vehicles. Motor efficiency affects the performance of vehicles directly and minimizes the energy consumption in the vehicle, thus helping in reducing the greenhouse effect. Increased demand for high-efficiency electric motors is driven by the emerging market for electric vehicles.
Read more about this report - REQUEST FREE SAMPLE COPY IN PDF
In smart offices/buildings as well as commercial spaces, the use of advanced HVAC systems and modern technologies is highly dependent on electric motors. Focusing on energy efficiency, these motors play a central role in powering different appliances, encouraging sustainable and cost-saving building management solutions.
The market for electric motors is expected to grow significantly, fueled by the growing use of electric vehicles, such as hybrid vehicles and passenger cars. Producers are augmenting their range of electric motors to satisfy this increasing need. Furthermore, improved automation and manufacturing technology is helping to develop more energy-efficient and dependable electric motors. Portfolio expansions and strategic planning are also the focus of companies to ensure alignment with market forecasts, thereby remaining competitive in this fast-changing field.
For example, Siemens AG, a prominent player in the electric motor business, reported revenue of EUR 75.93 billion in 2024, evidencing its good market performance. Likewise, Johnson Electric reached revenues of USD 3.8 billion during the 12 months ending March 31, 2024, emphasizing its huge contribution in the market. The above facts underscore the excellent performance and competitive standing of prominent companies in the electric motor business.
CANADA’S AEROSPACE SECTOR ACTIVITIES, 2022
The rise of electric vehicles (EVs), efficiency improvements, integration of IoT and industry 4.0, and focus on sustainable manufacturing are the major trends impacting electric motor industry.
Sustainability initiatives and government support for electric vehicles propel the automotive industry's demand for electric vehicle motor market, resulting in heightened EV adoption.
Enhancing motor efficiency is pivotal in the electric motors market size in technology. Manufacturers innovate with advanced materials and designs, aiming to reduce energy consumption and costs.
Electric motors integrated with IoT and Industry 4.0 enhance operations, enabling remote monitoring, predictive maintenance, and performance optimisation, thereby increasing efficiency, and reducing downtime.
Manufacturers are placing greater emphasis on sustainability, adopting eco-friendly practices in electric motor production to reduce resource consumption and emissions.
The electric motor market has different types, such as AC motors, DC motors, and hermetic motors, each having its own specific application across industries. AC Motors find extensive use in industrial and domestic applications because they are efficient and long-lasting. They drive machinery, HVAC, and many appliances, providing a consistent performance in applications that demand constant speed and torque. In India, energy-efficient motors operate with efficiencies typically 3 to 4 percentage points higher than standard motors, contributing to significant energy savings.
DC Motors are preferred in applications requiring accurate speed control and high starting torque. They play a critical role in electric vehicles, robotics, and portable electronics, ensuring prompt and efficient response. Hermetic Motors are sealed to keep contaminants out, which makes them suitable for use in refrigeration and air conditioning systems. The energy-efficient hermetic motors market is expected to grow each year by notable CAGR, owing to worldwide efforts to increase energy conservation across numerous industries.
One of the most prominent examples of industry expansion is BYD, a top electric vehicle maker, which posted revenues of USD 107 billion in 2024, ahead of Tesla's USD 97.7 billion. This highlights the growing importance of electric motors in the automotive industry and the rising demand for efficient motor technologies.
The technological and market trends of AC, DC, and hermetic motors are an indication of the general trends in energy efficiency and technological development, underscoring their vital place in contemporary industrial and consumer use.
Read more about this report - REQUEST FREE SAMPLE COPY IN PDF
Electric motors are divided depending on their power output into Fractional Horsepower (HP) Motors and Integral Horsepower (HP) Motors, which have specific applications across different industries.
Integral HP Motors are made for applications that need heavy power, often in excess of one horsepower. Industrial machinery, HVAC equipment, and large machine manufacturing equipment use such motors, where heavy torque and aggressive performance are needed. The rise in demand for automation and heavy equipment in industries like automotive and aerospace has played a major role in driving the growth of the integral HP motor market. Moreover, developments in energy-saving technologies have given rise to integral HP motors that provide superior performance along with lower operational costs.
In the United States, electric motors, including integral HP motors, account for approximately 29% of the nation's electricity consumption, resulting in USD 166 billion in electricity costs and 765 million metric tons of CO₂ emissions. This substantial energy usage underscores the importance of adopting energy-efficient motor systems to achieve significant cost savings and environmental benefits.
Fractional HP Motors are, however, referred to as electric motors with a rated output power capacity of less than one horsepower. They are found widely applied in home appliances such as food processors, blenders, and vacuum cleaners, as well as on small machinery including bench grinders and band saws. Due to their high versatility and effectiveness, fractional HP motors are very suitable for tasks demanding reduced power output. Most importantly, the fractional HP motor market dominated more than 80% of the total market value in 2023 due to their high usage across many consumer and industrial applications.
The ongoing development of both motor types reflects the dynamic character of the electric motor market, fueled by technological innovation and the increasing focus on energy efficiency in various industries.
Electric motors are instrumental in various industries, driving efficiency and innovation. They energize crucial machinery in industry, powering equipment such as conveyor belts, pumps, and compressors to make manufacturing smooth and efficient. Electric and hybrid cars in the motor vehicle industry use electric motors to transform electricity into mechanical movement for eco-friendly transport. Likewise, HVAC equipment relies on electric motors to control airflow and temperature in homes and businesses, making climate control energy efficient. In the aerospace & transportation sector, electric motors enable essential systems like hydraulic pumps and environmental controls, improving the efficiency of operation in aircraft and rail transport.
Apart from industrial uses, electric motors are part of daily life. Home appliances like refrigerators, washing machines, and vacuum cleaners use electric motors for convenience and efficiency. In the United States manufacturing sector, electric motors used in machine-driven processes like pumps, fans, compressed air, and materials handling and processing accounted for 68% of electricity use, totaling approximately 2,840 TBtu of direct use energy. In domestic and industrial applications, they drive critical infrastructure like elevators, escalators, and automated doors. The e-mobility space, with electric bicycles and scooters, is expanding fast, offering green urban mobility solutions. Industrial applications like mining, construction, and agriculture also use powerful electric motors to increase productivity and lifespan in harsh conditions. With industries focusing on sustainability and automation, the need for efficient electric motors keeps increasing, defining the future of contemporary applications.


Asia Pacific Electric Motor Market Trends
The Asia Pacific market is experiencing strong growth in the electric motor industry due to rising industrialization and urbanization. The increasing need for energy-efficient applications in industries like manufacturing, automotive, and HVAC systems is a major driver of growth in this sector. Technology improvements and favorable government policies encouraging green practices further increase the use of electric motors in industries. China, Japan, and India are leaders among the countries, using their strong manufacturing foundations and creative prowess to capture the growing demand for electric motors.
Specifically in China, the country is taking large steps toward the integration of electric vehicles (EVs) with the grid to improve energy management. In 2023, China sold approximately 6.69 million battery-electric vehicles, marking a 24.63% increase from the previous year. This surge underscores the country's commitment to electric mobility and the growing demand for electric motors in the automotive sector. The National Development and Reform Commission (NDRC) has launched pilot projects in nine cities, such as Beijing and Shanghai, to use EVs as mobile energy storage. These projects would help stabilize the power grid during periods of high peak demand by allowing vehicles to store and feed electricity back, as well as to shift charging times so that it is not done during peak hours. This pioneering strategy not only serves the grid but also generates further revenue sources for EV charging station operators and owners.
North America Electric Motor Market Trends
In North America, the electric motor industry is driven by a significant focus on sustainability and energy efficiency. The use of electric vehicles (EVs) and integration of renewable resources are major contributors to market expansion. The need for improved motor design and efficiency is also enhanced by stringent regulations on energy use and government policies promoting the investment in high-efficiency motors through industries in the manufacturing, HVAC, and healthcare industries.
Indeed, in the United States, the automobile sector is witnessing a boost in electric vehicle sales. Top automakers have all announced dramatic hikes in EV sales, indicating increasing consumer demand for environmentally friendly modes of transport. For example, General Motors announced a 94% increase in EV sales, with major contributions coming from Chevrolet and Cadillac. This trend reflects the increasing pace of the transition toward electric mobility and the growing presence of electric motors in the American automotive industry.
Europe Electric Motor Market Trends
Europe's electric motor market is propelled by strict energy efficiency regulations and a high level of commitment to sustainability. Germany, France, and the UK are among the countries leading the market, with strong industrial bases and growing investments in renewable energy initiatives. The region's ambitious climate targets require the implementation of energy-efficient motors in many sectors, including manufacturing, transportation, and construction.
Specifically with respect to Germany, the nation is investing heavily in renewable power, specifically solar power. Its push to develop more renewable power capacity is supported by its need to decrease carbon emissions and achieve sustainable methods of production. Renewable energy is compelling the demand for high-performance electric motors that will effectively interface with renewable power schemes and facilitate Germany's energy transition plans.
Major players in the global electric motor industry, such as Siemens, ABB, Nidec, WEG, and Bosch, are looking towards energy efficiency, automation, and sustainability. They are spending on high-efficiency motor technology, scaling up electric vehicle (EV) motor manufacturing, and incorporating IoT and AI-powered smart motors for industrial automation. Besides, they look to improve the compatibility of motors with renewable energy, optimize compact motor design, and extend global market reach by strategic mergers, acquisitions, and alliances in order to capitalize on increasing industry demands.
ABB is a company that was founded in 1988 in Switzerland and provides a vast array of low and high-voltage electric motors for industrial purposes. ABB has recently introduced IE4 super premium efficiency motors and IE3 aluminum motors in India to provide increased energy efficiency. ABB also launched the M3BP high-output series motors, which are compact and powerful in nature. Its IE5 SynRM motors also won the Best Innovation Award, which provides increased energy efficiency standards.
Allied Motion, Inc., established in 1962 in the United States, deals with precision motion control components like brushless DC motors, brushed DC motors, and servo motors. The company also recently created enhanced integrated motion solutions for robotics as well as for medical applications. It has increased its product lineup to frameless motor kits for embedded applications for automation and machinery.
AMETEK, Inc., founded in 1930 in the United States, produces brushless DC, brushed DC, and AC motors for various industries such as aerospace, defense, and industrial markets. Recently, the company has developed high-efficiency brushless DC motors designed specifically for aerospace use. In addition, AMETEK released compact motors with increased power density, specifically suited for medical devices and precision instruments.
Johnson Electric Holdings Limited, established in 1959 in Hong Kong, designs and manufactures micro motors, motion subsystems, and electro-mechanical components for automotive, industrial, and medical applications. New products launched are high-performance motion solutions for electric vehicles and specialized micro motors for surgical robotics and smart home applications.
Nidec Motor Corporation was founded in 1973 in Japan and is a world leader in industrial motors, appliance motors, and electric vehicle drive systems. Nidec has now launched next-generation EV traction motors that promise to enhance efficiency and minimize size. Nidec has also developed energy-saving industrial motors to cater to increasing demand for clean solutions in manufacturing and automation.
*Please note that this is only a partial list; the complete list of key players is available in the full report. Additionally, the list of key players can be customized to better suit your needs.*
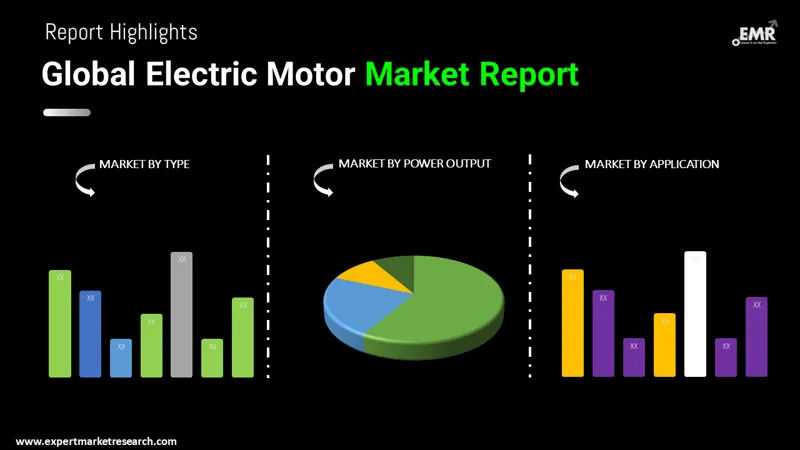
This report forecasts revenue development at the global, regional, and country level and presents an analysis of the most recent industry trends from 2026 to 2035. EMR has divided the global electric motor market report into segments by motor, power output, application, and region for this study.
Motor Outlook (Revenue, Billion, 2026-2035)
Power Output Outlook (Revenue, Billion, 2026-2035)
Application Outlook (Revenue, Billion, 2026-2035)
Region Outlook (Revenue, Billion, 2026-2035)
United States Electric Motors Market
North America Electric Motors Market
Outboard Electric Motors Market
Aircraft Electric Motors Market


Upto 15% Off
USD
$3999 $3599
$2499 $2249
$4999 $4249
$5999 $5099


*While we strive to always give you current and accurate information, the numbers depicted on the website are indicative and may differ from the actual numbers in the main report. At Expert Market Research, we aim to bring you the latest insights and trends in the market. Using our analyses and forecasts, stakeholders can understand the market dynamics, navigate challenges, and capitalize on opportunities to make data-driven strategic decisions.*
Get in touch with us for a customized solution tailored to your unique requirements and save upto 35%!
The electric motors market reached a value of approximately USD 137.86 Billion in 2025.
The market is projected to grow at a CAGR of 5.30% between 2026 and 2035.
The revenue generated from the electric motor market is expected to reach USD 231.06 Billion in 2035.
The rise of electric vehicles (EVs), efficiency improvements, integration of IoT and industry 4.0, and focus on sustainable manufacturing are the major trends impacting the electric motor industry.
The market is categorised according to the type, which includes AC motors, DC motors and hermetic motors.
The market key players are ABB Ltd, Allied Motion Technologies Inc., Ametek Inc., General Electric, Johnson Electric Holdings Limited, Rockwell Automation, Inc., Siemens AG, Nidec Motor Corporation, Franklin Electric, Regal Rexnord Corporation, Schneider Electric, and ORIENTAL MOTOR USA CORP., among others.
Based on the power output, the market is divided into integral HP output and fractional HP output.
Based on the application, the market is divided into industrial, residential, commercial, e-mobility and others.
The market is broken down into North America, Europe, Asia Pacific, Latin America, the Middle East, and Africa.
AC motors contribute to the electric motor market growth due to their versatility, being widely accessible in diverse sizes and configurations, making them suitable for diverse applications.
The Asia-Pacific region is the fastest growing region in the global electric motor market, driven by rising demand across industrial, automotive, and power sectors.
The AC motor segment was the largest revenue-generating motor type in 2025.
Key drivers include increasing demand for electric vehicles (EVs), industrial automation, and technological advancements leading to better efficiency and performance.
Asia Pacific dominated the market in terms of share in 2025.
Urbanization leads to increased demand for automotive, HVAC applications, and other operations across commercial and residential sectors, thereby driving higher adoption of electric motors.
Explore our key highlights of the report and gain a concise overview of key findings, trends, and actionable insights that will empower your strategic decisions.
| REPORT FEATURES | DETAILS |
| Base Year | 2025 |
| Historical Period | 2019-2025 |
| Forecast Period | 2026-2035 |
| Scope of the Report |
Historical and Forecast Trends, Industry Drivers and Constraints, Historical and Forecast Market Analysis by Segment:
|
| Breakup by Motor |
|
| Breakup by Power Output |
|
| Breakup by Application |
|
| Breakup by Region |
|
| Market Dynamics |
|
| Competitive Landscape |
|
| Companies Covered |
|
| Report Price and Purchase Option | Explore our purchase options that are best suited to your resources and industry needs. |
| Delivery Format | Delivered as an attached PDF and Excel through email, with an option of receiving an editable PPT, according to the purchase option. |
Single User License
One User
USD 3,999
USD 3,599
tax inclusive*
Datasheet
One User
USD 2,499
USD 2,249
tax inclusive*
Five User License
Five User
USD 4,999
USD 4,249
tax inclusive*
Corporate License
Unlimited Users
USD 5,999
USD 5,099
tax inclusive*
*Please note that the prices mentioned below are starting prices for each bundle type. Kindly contact our team for further details.*
Flash Bundle
Small Business Bundle
Growth Bundle
Enterprise Bundle
*Please note that the prices mentioned below are starting prices for each bundle type. Kindly contact our team for further details.*
Flash Bundle
Number of Reports: 3
20%
tax inclusive*
Small Business Bundle
Number of Reports: 5
25%
tax inclusive*
Growth Bundle
Number of Reports: 8
30%
tax inclusive*
Enterprise Bundle
Number of Reports: 10
35%
tax inclusive*
How To Order

Select License Type
Choose the right license for your needs and access rights.

Click on ‘Buy Now’
Add the report to your cart with one click and proceed to register.

Select Mode of Payment
Choose a payment option for a secure checkout. You will be redirected accordingly.
Gain insights to stay ahead and seize opportunities.

Get insights & trends for a competitive edge.

Track prices with detailed trend reports.

Analyse trade data for supply chain insights.

Leverage cost reports for smart savings

Enhance supply chain with partnerships.

Connect For More Information
Our expert team of analysts will offer full support and resolve any queries regarding the report, before and after the purchase.
Our expert team of analysts will offer full support and resolve any queries regarding the report, before and after the purchase.
We employ meticulous research methods, blending advanced analytics and expert insights to deliver accurate, actionable industry intelligence, staying ahead of competitors.
Our skilled analysts offer unparalleled competitive advantage with detailed insights on current and emerging markets, ensuring your strategic edge.
We offer an in-depth yet simplified presentation of industry insights and analysis to meet your specific requirements effectively.


Share