

Consumer Insights
Uncover trends and behaviors shaping consumer choices today
Procurement Insights
Optimize your sourcing strategy with key market data
Industry Stats
Stay ahead with the latest trends and market analysis.
The global GaN on silicon technology market attained a value of USD 321.40 Million in 2025. The market is estimated to grow at a CAGR of 38.30% during 2026-2035 to reach a value of USD 8227.50 Million by 2035.
Compound Annual Growth Rate
38.3%
Value in USD Million
2026-2035
| Global GaN on Silicon Technology Market Report Summary | Description | Value |
| Base Year | USD Million | 2025 |
| Historical Period | USD Million | 2019-2025 |
| Forecast Period | USD Million | 2026-2035 |
| Market Size 2025 | USD Million | 321.40 |
| Market Size 2035 | USD Million | 8227.50 |
| CAGR 2019-2025 | Percentage | XX% |
| CAGR 2026-2035 | Percentage | 38.30% |
| CAGR 2026-2035 - Market by Region | North America | 41.5% |
| CAGR 2026-2035 - Market by Region | Asia Pacific | 38.7% |
| CAGR 2026-2035 - Market by Wafer Type | Less than 200 mm | XX% |
| CAGR 2026-2035 - Market by Application | Automotive | 59.2% |
| CAGR 2026-2035 - Market by Country | India | 43.8% |
| 2025 Market Share by Country | China | 24.9% |
The global GaN on silicon technology market is driven by its increased application in the end-use sectors including automotive, power generation, consumer electronics, and healthcare sectors.
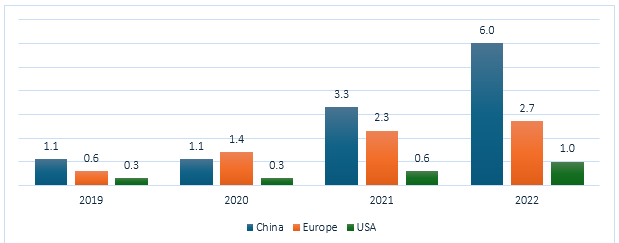
Figure: Total Number of EV Sales by Key Regions (2019-2023); Million
In the consumer electronics sector, GaN on silicon technology is widely used in power conversion and charging as a next-generation power semiconductor. In 2022, in the global consumer electronics market, smartphones generated the highest revenue, accounting for USD 467 billion, a 3.4% increase compared to 2021. This is followed by televisions with 135 billion and laptops with 125 billion of revenue.
In the electric vehicle market, GaN on silicon technology enables smaller, more efficient, and lower-cost power systems. In 2023, electric car sales amounted to around 14 million. Around 900,000 charging stations were installed in 2022, taking the total number of EV charging points to 2.7 million at the end of 2022. The number of fast chargers increased by 330,000, of which China accounted for 90% of the share. By the end of 2022, there were over 70,000 fast chargers throughout Europe, a rise of almost 55% from 2021. The largest installers of fast chargers were Germany (> 12,000), France (9,700), and Norway (9,000), positively influencing EV adoption. The need for faster charging and demand for extended EV range is expected to positively influence the market in the coming years.
Growing electric vehicle market; rising demand for renewable energy; expansion of 5G; and increasing investments are the key trends impacting the GaN on silicon technology market expansion.
Infineon Technologies has announced its success in developing the world’s first 300 mm power gallium nitride (GaN) wafer technology. As the first company globally to master this groundbreaking innovation within an existing and scalable high-volume manufacturing environment, Infineon is set to significantly propel the market for GaN-based power semiconductors.
Texas Instruments (TI) introduced the industry's first 650V three-phase GaN IPM for 250W motor drive applications. This innovative GaN IPM addressed many of the design and performance challenges that engineers typically encountered when designing major home appliances and heating, ventilation, and air-conditioning (HVAC) systems.
Porotech partnered with Powerchip Semiconductor Manufacturing Corp. to announce their collaboration for the mass production of MicroLEDs on 200mm GaN-on-Silicon for display applications. This partnership aimed to accelerate the production of the brightest, high pixel density, smallest, and low-cost MicroLEDs, ensuring high-yield manufacturing for consumer display applications.
Infineon Technologies AG completed of its acquisition of GaN Systems Inc. The Ottawa-based company brought with it a wide range of gallium nitride (GaN)-based power conversion solutions and advanced application expertise.
In the electric vehicle motor driving systems, GaN devices regulate the speed and torque of the electric motor, and offer higher efficiency, and better thermal management. In 2023, China ranked 1st in the production of EVs, accounting for over 66% of total production, followed by Europe (22%) and the United States (10%).
In renewable energy inverters, GaN transistors increase power density, minimise heat dissipation, and reduce the size of passive components. Governments’ aim towards decarbonisation, and policies create opportunities for GaN technology. In 2023, global renewable capacity accounted for more than 440 GW. By 2030, the global renewable capacity is expected to witness a minimum 16.4% growth rate annually.
GaN is playing a pivotal role in the development of 5G technology by enabling faster data transfer speeds and improved efficiency. It can handle high frequency signals due to its wider bandgap. By 2025, 5G networks are likely to cover one-third of the global population, offering lucrative opportunity in GaN on Si technology market.
A steady increase in world energy demands combined with the depleting fossil fuel reserves is driving research into cheaper and more energy-efficient solid-state lighting and photovoltaics. GaN-based LEDs are significantly more expensive than filament light bulbs or CFLs. The power electronics sector is increasingly investing in research to grow GaN-based LEDs on silicon wafers, which have the advantage of being readily available in large diameters (e.g., 150 mm or larger) and at low cost.
Integrating GaN with silicon can enhance the efficiency of both power devices and next-generation LEDs, including MicroLEDs. GaN on silicon technology can be utilized in a wide range of applications, from consumer chargers and power supplies to military radars and aerospace systems. This combination offers improved efficiency, more compact designs, and enhanced performance compared to traditional silicon-based solutions.
GaN technology enhances power conversion in data centers for advanced computing applications such as machine learning and artificial intelligence by offering greater efficiency, higher power density, and reduced size and weight compared to traditional power electronics. As of Q4 2023, the US held 51% of global hyperscale data center capacity, while Europe and China accounted for 17% and 16%, respectively.
“Global GaN on Silicon Technology Market Report and Forecast 2026-2035” offers a detailed analysis of the market based on the following segments:
Market Breakup by Wafer Size
Market Breakup by Application
Market Breakup by Region
Based on application, the consumer electronics sector accounts for a significant share of the market
GaN technology enhances power conversion in consumer electronics by delivering higher efficiency, smaller size, lighter weight, and faster charging compared to traditional silicon-based solutions. The major consumer electronics manufacturing countries across the globe are China, South Korea, United States, Japan, Taiwan, and Mexico. During January- April 2024, China produced 496 million units of electronic products, marking a 12.6% year-on-year increase.
GaN-based RF devices are being widely used in 5G base stations, and satellite communications. The expansion of 5G across the globe provide significant opportunities for market growth. In Q1 2024, global 5G connections reached nearly 2 billion, with 185 million new additions. By 2028, 5G connections are forecasted to reach 7.7 billion.
Based on wafer size, less than 200 mm is a major contributor to the global GaN on silicon technology market revenue
GaN-based LEDs on silicon wafers, which are inexpensive and easily accessible in large diameters (such as 150 mm or greater), could result in significant cost savings by increasing the usable wafer area. There is a growing demand for smart LED bulbs that can be operated through smartphones and voice assistants such as Alexa and Google Assistant. The increase in the number of global smartphone users by 6.2% in 2023 compared to 2022 further supports the market.
In the telecommunications sector, GaN technology with a wafer size of 200 mm offers greater power density and can be used to produce high-electron-mobility transistor (HEMT) technologies.
According to the OECD, from 2013 to 2023, the global ICT sector grew by an average of 6.3%, and in 2023 itself, the sector grew with an average growth rate of 7.6%. This growth is attributed to the rising investment in generative AI and rising 5G adoption globally which provides an opportunity for GaN on silicon technology.
The market players are focusing on providing products at competitive prices with high quality, integrating improved performance features.
Infineon is a leading global company that develops, manufactures, and markets a wide range of semiconductors and semiconductor-based solutions. Headquartered in Germany, the company focuses on key markets, including the automotive, industrial, and consumer sectors.
Headquartered in China, Innoscience designs, develops, and manufactures high-performance and reliable GaN devices for a broad range of applications and voltage. Innoscience has 3 offices in China and operates across North America, Europe, and Asia, establishing a strong global presence with a workforce of over 1,400 employees worldwide.
Navitas designs, develops, and markets next-generation power semiconductors, including gallium nitride (GaN) power integrated circuits (ICs), silicon carbide (SiC) power devices, high-speed silicon system controllers, and digital isolators for power conversion and charging applications.
Power Integrations is a leading innovator in semiconductor technologies for high-voltage power conversion. Founded in 1988, the company designs, develops, and markets analog and mixed-signal integrated circuits (ICs) and other electronic components and circuitry utilized in high-voltage power conversion systems.
*Please note that this is only a partial list; the complete list of key players is available in the full report. Additionally, the list of key players can be customized to better suit your needs.*
Other notable players operating in the global GaN on silicon technology market are Toshiba Corporation, Texas Instruments Incorporated, MACOM Technology Solutions Holdings Inc, Ampleon Netherlands B.V., and Poro Technologies Ltd, among others.


According to 2023, East and Southeast Asia contribute to over 80% of the world's semiconductor production. In 2023, China, a major semiconductor manufacturer, witnessed an increase in integrated circuits (ICs) output of 6.9% to 351.4 billion pieces as compared to 2022.
| CAGR 2026-2035 - Market by | Country |
| India | 43.8% |
| Germany | 38.3% |
| China | 37.8% |
| Canada | 35.8% |
| Brazil | 35.8% |
| USA | XX% |
| UK | XX% |
| France | 33.2% |
| Italy | XX% |
| Japan | XX% |
| Australia | XX% |
| Mexico | XX% |
| Saudi Arabia | 29.1% |
Meanwhile, the number of colocation data centres in North America is expected to reach 1.8k (2030) from 1.4 k (2024). In 2022, General Motors delivered 39,096 EVs, a 57% YoY rise, and aims to annually produce over 1 million EVs in North America by 2025.
Upto 15% Off
USD
$2499 $2249
$3999 $3599
$4999 $4249
$5999 $5099


*While we strive to always give you current and accurate information, the numbers depicted on the website are indicative and may differ from the actual numbers in the main report. At Expert Market Research, we aim to bring you the latest insights and trends in the market. Using our analyses and forecasts, stakeholders can understand the market dynamics, navigate challenges, and capitalize on opportunities to make data-driven strategic decisions.*
The global market for GaN on silicon technology attained a value of USD 321.40 Million in 2025.
The market is estimated to grow at a CAGR of 38.30% during 2026-2035.
The market is estimated to witness a healthy growth in the forecast period of 2026-2035 to reach a value of USD 8227.50 Million by 2035.
The factors driving the market growth are increasing inclination towards environmental safety, rising adoption of electric vehicles, expansion of semiconductor sector, rising technological advancements, etc.
The key trends augmenting the market growth are the rising demand for GaN semiconductors and growing consumer electronics usage.
The key regional markets for GaN on silicon technology are North America, Europe, the Asia Pacific, Latin America, and the Middle East and Africa.
The wafer sizes are less than 200 mm, 200 - 300 mm, and more than 300 mm.
The applications include automotive, consumer electronics, defence and aerospace, healthcare, industrial and power, information and communication technology, and others.
The key players in the market include Infineon Technologies AG, Innoscience Technology Co., Ltd., Navitas Semiconductor Corp., Power Integrations, Inc., Toshiba Corporation, Texas Instruments Incorporated, MACOM Technology Solutions Holdings Inc, Ampleon Netherlands B.V., and Poro Technologies Ltd, among others.
Explore our key highlights of the report and gain a concise overview of key findings, trends, and actionable insights that will empower your strategic decisions.
| REPORT FEATURES | DETAILS |
| Base Year | 2025 |
| Historical Period | 2019-2025 |
| Forecast Period | 2026-2035 |
| Scope of the Report |
Historical and Forecast Trends, Industry Drivers and Constraints, Historical and Forecast Market Analysis by Segment:
|
| Breakup by Wafer Size |
|
| Breakup by Application |
|
| Breakup by Region |
|
| Market Dynamics |
|
| Competitive Landscape |
|
| Companies Covered |
|
| Report Price and Purchase Option | Explore our purchase options that are best suited to your resources and industry needs. |
| Delivery Format | Delivered as an attached PDF and Excel through email, with an option of receiving an editable PPT, according to the purchase option. |
Datasheet
One User
USD 2,499
USD 2,249
tax inclusive*
Single User License
One User
USD 3,999
USD 3,599
tax inclusive*
Five User License
Five User
USD 4,999
USD 4,249
tax inclusive*
Corporate License
Unlimited Users
USD 5,999
USD 5,099
tax inclusive*
*Please note that the prices mentioned below are starting prices for each bundle type. Kindly contact our team for further details.*
Flash Bundle
Small Business Bundle
Growth Bundle
Enterprise Bundle
*Please note that the prices mentioned below are starting prices for each bundle type. Kindly contact our team for further details.*
Flash Bundle
Number of Reports: 3
20%
tax inclusive*
Small Business Bundle
Number of Reports: 5
25%
tax inclusive*
Growth Bundle
Number of Reports: 8
30%
tax inclusive*
Enterprise Bundle
Number of Reports: 10
35%
tax inclusive*
How To Order

Select License Type
Choose the right license for your needs and access rights.

Click on ‘Buy Now’
Add the report to your cart with one click and proceed to register.

Select Mode of Payment
Choose a payment option for a secure checkout. You will be redirected accordingly.
Strategic Solutions for Informed Decision-Making
Gain insights to stay ahead and seize opportunities.

Get insights & trends for a competitive edge.

Track prices with detailed trend reports.

Analyse trade data for supply chain insights.

Leverage cost reports for smart savings

Enhance supply chain with partnerships.

Connect For More Information
Our expert team of analysts will offer full support and resolve any queries regarding the report, before and after the purchase.
Our expert team of analysts will offer full support and resolve any queries regarding the report, before and after the purchase.
We employ meticulous research methods, blending advanced analytics and expert insights to deliver accurate, actionable industry intelligence, staying ahead of competitors.
Our skilled analysts offer unparalleled competitive advantage with detailed insights on current and emerging markets, ensuring your strategic edge.
We offer an in-depth yet simplified presentation of industry insights and analysis to meet your specific requirements effectively.


